🐋 VRT $110M Diagonal Calendar Spread - Institutional Giant Builds a Leveraged Long on the AI Power King!
📅 February 27, 2026 | 🔥 Unusual Activity Detected
🎯 The Quick Take
A sophisticated institution just executed a $110M diagonal calendar spread on Vertiv Holdings, simultaneously buying 10,000 June 2026 $210 deep ITM calls (~$55.8M) and selling 10,000 January 2027 $260 OTM calls (~$54.2M) for a net cost of just ~$1.6M. This is essentially a leveraged long position with a built-in call overwrite -- the trader gets massive upside exposure to VRT through June while collecting nearly all the cost back from the longer-dated short calls. With VRT sitting at $248 and sporting a $15 billion AI data center backlog (+109% YoY), this trade captures the May 19-20 Investor Day and Q1 earnings on April 29 with near-zero net premium at risk.
📊 Company Overview
Vertiv Holdings Co (VRT) is the dominant pure-play on AI data center infrastructure:
- ⚡ What they do: Designs and manufactures critical power, cooling, and IT infrastructure for data centers -- the company literally keeps AI running by providing the electricity and thermal management that GPU clusters require
- 💰 Market Cap: ~$99.2B
- 🏢 Sector: Electronic Components (Data Center Infrastructure - Power & Cooling)
- 📈 Exchange: NYSE
- 📊 Current Price: ~$252
- 🤖 Key Story: NVIDIA's official partner on 800 VDC power architecture, $15B backlog, 252% organic orders growth in Q4, and a two-day Investor Conference on May 19-20
💰 The Option Flow Breakdown
📊 The Tape
| Time | Symbol | Side | Buy/Sell | Type | Expiration | Premium | Strike | Volume | OI | Size | Spot | Option Price | Option Symbol |
|---|---|---|---|---|---|---|---|---|---|---|---|---|---|
| 13:44:00 | VRT | MID | BUY | CALL $210 | 2026-06-18 | $39M | $210 | 10K | 12K | 7,000 | $247.76 | $56.00 | VRT20260618C210 |
| 13:44:00 | VRT | BELOW BID | SELL | CALL $260 | 2027-01-15 | $38M | $260 | 8.1K | 7.6K | 7,000 | $247.76 | $53.90 | VRT20270115C260 |
| 13:44:00 | VRT | MID | BUY | CALL $210 | 2026-06-18 | $5.6M | $210 | 3K | 12K | 1,000 | $247.76 | $56.00 | VRT20260618C210 |
| 13:44:00 | VRT | MID | BUY | CALL $210 | 2026-06-18 | $5.6M | $210 | 1K | 12K | 1,000 | $247.76 | $56.00 | VRT20260618C210 |
| 13:44:00 | VRT | MID | BUY | CALL $210 | 2026-06-18 | $5.6M | $210 | 2K | 12K | 1,000 | $247.76 | $56.00 | VRT20260618C210 |
| 13:44:00 | VRT | BELOW BID | SELL | CALL $260 | 2027-01-15 | $5.4M | $260 | 9.1K | 7.6K | 1,000 | $247.76 | $53.90 | VRT20270115C260 |
| 13:44:00 | VRT | BELOW BID | SELL | CALL $260 | 2027-01-15 | $5.4M | $260 | 10K | 7.6K | 1,000 | $247.76 | $53.90 | VRT20270115C260 |
| 13:44:00 | VRT | BELOW BID | SELL | CALL $260 | 2027-01-15 | $5.4M | $260 | 1.1K | 7.6K | 1,000 | $247.76 | $53.90 | VRT20270115C260 |
🤓 What This Actually Means
Let me break this down in plain English -- this is one of the most sophisticated trades we have seen on the tape recently:
The Buy Side (Long Leg):
- 💰 ~$55.8M spent buying 10,000 June 2026 $210 calls at $56.00 each
- 📈 $210 strike is $38 deep in-the-money with VRT at $247.76 -- these calls behave almost like stock
- ⏰ 111 days to expiration (June 18, 2026) -- captures both Q1 earnings and Investor Day
- 📊 Volume vs OI: 10K contracts bought into 12K existing OI -- significant new positioning
- 🤝 MID fill on all four blocks -- institutional negotiation, not retail chasing
The Sell Side (Short Leg):
- 💸 ~$54.2M collected selling 10,000 January 2027 $260 calls at $53.90 each
- 📈 $260 strike is $12 out-of-the-money -- caps upside above $260
- ⏰ 322 days to expiration (January 15, 2027) -- longer duration provides higher premium
- 📊 Volume vs OI: 10K sold into 7.6K OI -- this is 1.3x existing open interest, a massive new position
- 🔻 BELOW BID fills on all four blocks -- the seller was aggressive, eager to get this trade done
The Combined Strategy: Diagonal Calendar Spread
- 🎯 Net cost: ~$1.6M ($55.8M paid - $54.2M received) for 10,000 contracts
- 📊 Net debit per spread: ~$2.10 ($56.00 - $53.90)
- 🧠 What they're really doing: Getting leveraged long exposure to VRT through the June catalyst window while paying for it by selling expensive longer-dated calls above the current price
- 💡 Max profit zone: VRT between $248-$260 at June expiration. The June calls are deep ITM and capture all the upside, while the January calls haven't expired yet and retain time value (which is profit for the seller)
- ⚠️ Risk after June: Once the June calls expire, the trader is left naked short the January $260 calls. They'll need to manage this -- likely by rolling, covering, or holding stock
Why this is brilliant: The trader is paying just ~$1.6M net for exposure to $100M+ in VRT notional value through the most catalyst-dense period of the year. If VRT rallies to $260+ by June, the long June $210 calls gain $50+ in intrinsic value while the short January $260 calls also gain value (partially offsetting). The key edge: time decay works FOR this trader on the short leg (longer-dated options decay slower) while the deep ITM long leg has minimal extrinsic value to lose.
📈 Technical Setup / Chart Check-Up
YTD Performance
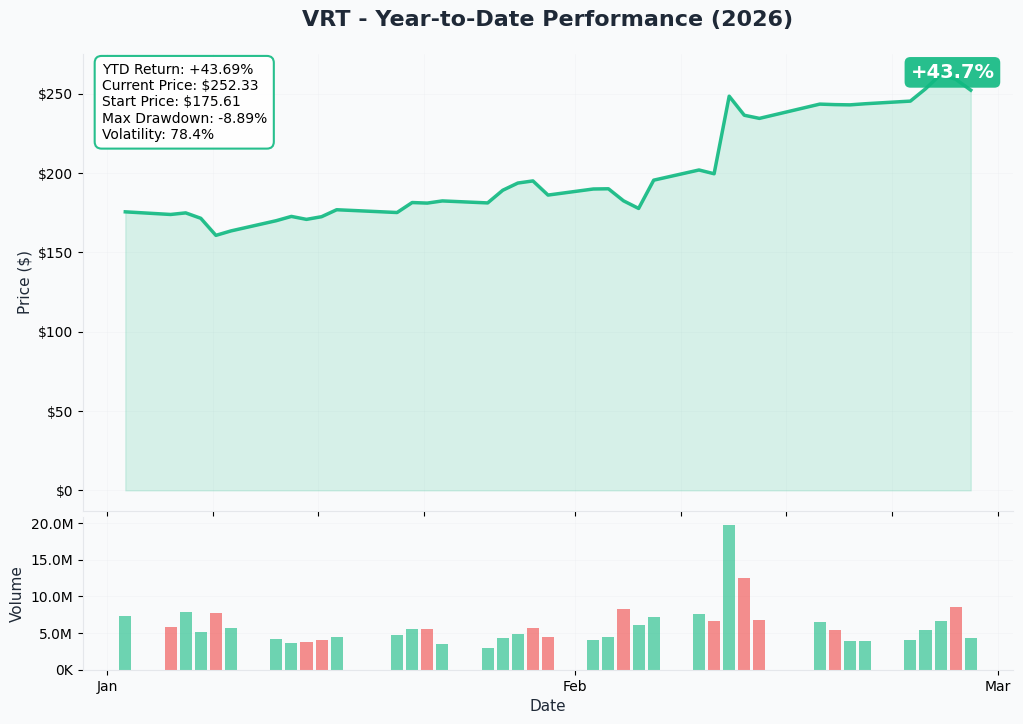
VRT has been on a strong run from the 2025 lows. Here is the context:
- 🚀 52-week range: $53.60 (April 2025) to $264.86 (February 2026) -- a +153.9% gain over 52 weeks
- 📈 3-month rally: Up ~59% from ~$165 in late December 2025 to ~$262 in late February 2026
- 🔥 Post-earnings surge: Stock jumped ~17.5% on February 11-12 following Q4 2025 results
- 📊 Current pullback: Trading around $248-252, pulling back slightly from the $265 all-time high area
- 💪 Volume context: Elevated trading volume throughout February on institutional accumulation
Key takeaway: VRT is in a strong uptrend but has pulled back ~5% from all-time highs, creating a potential re-entry point. The diagonal spread trader is positioning for continued strength through the $210-$260 range during this pullback.
Gamma-Based Support & Resistance Analysis
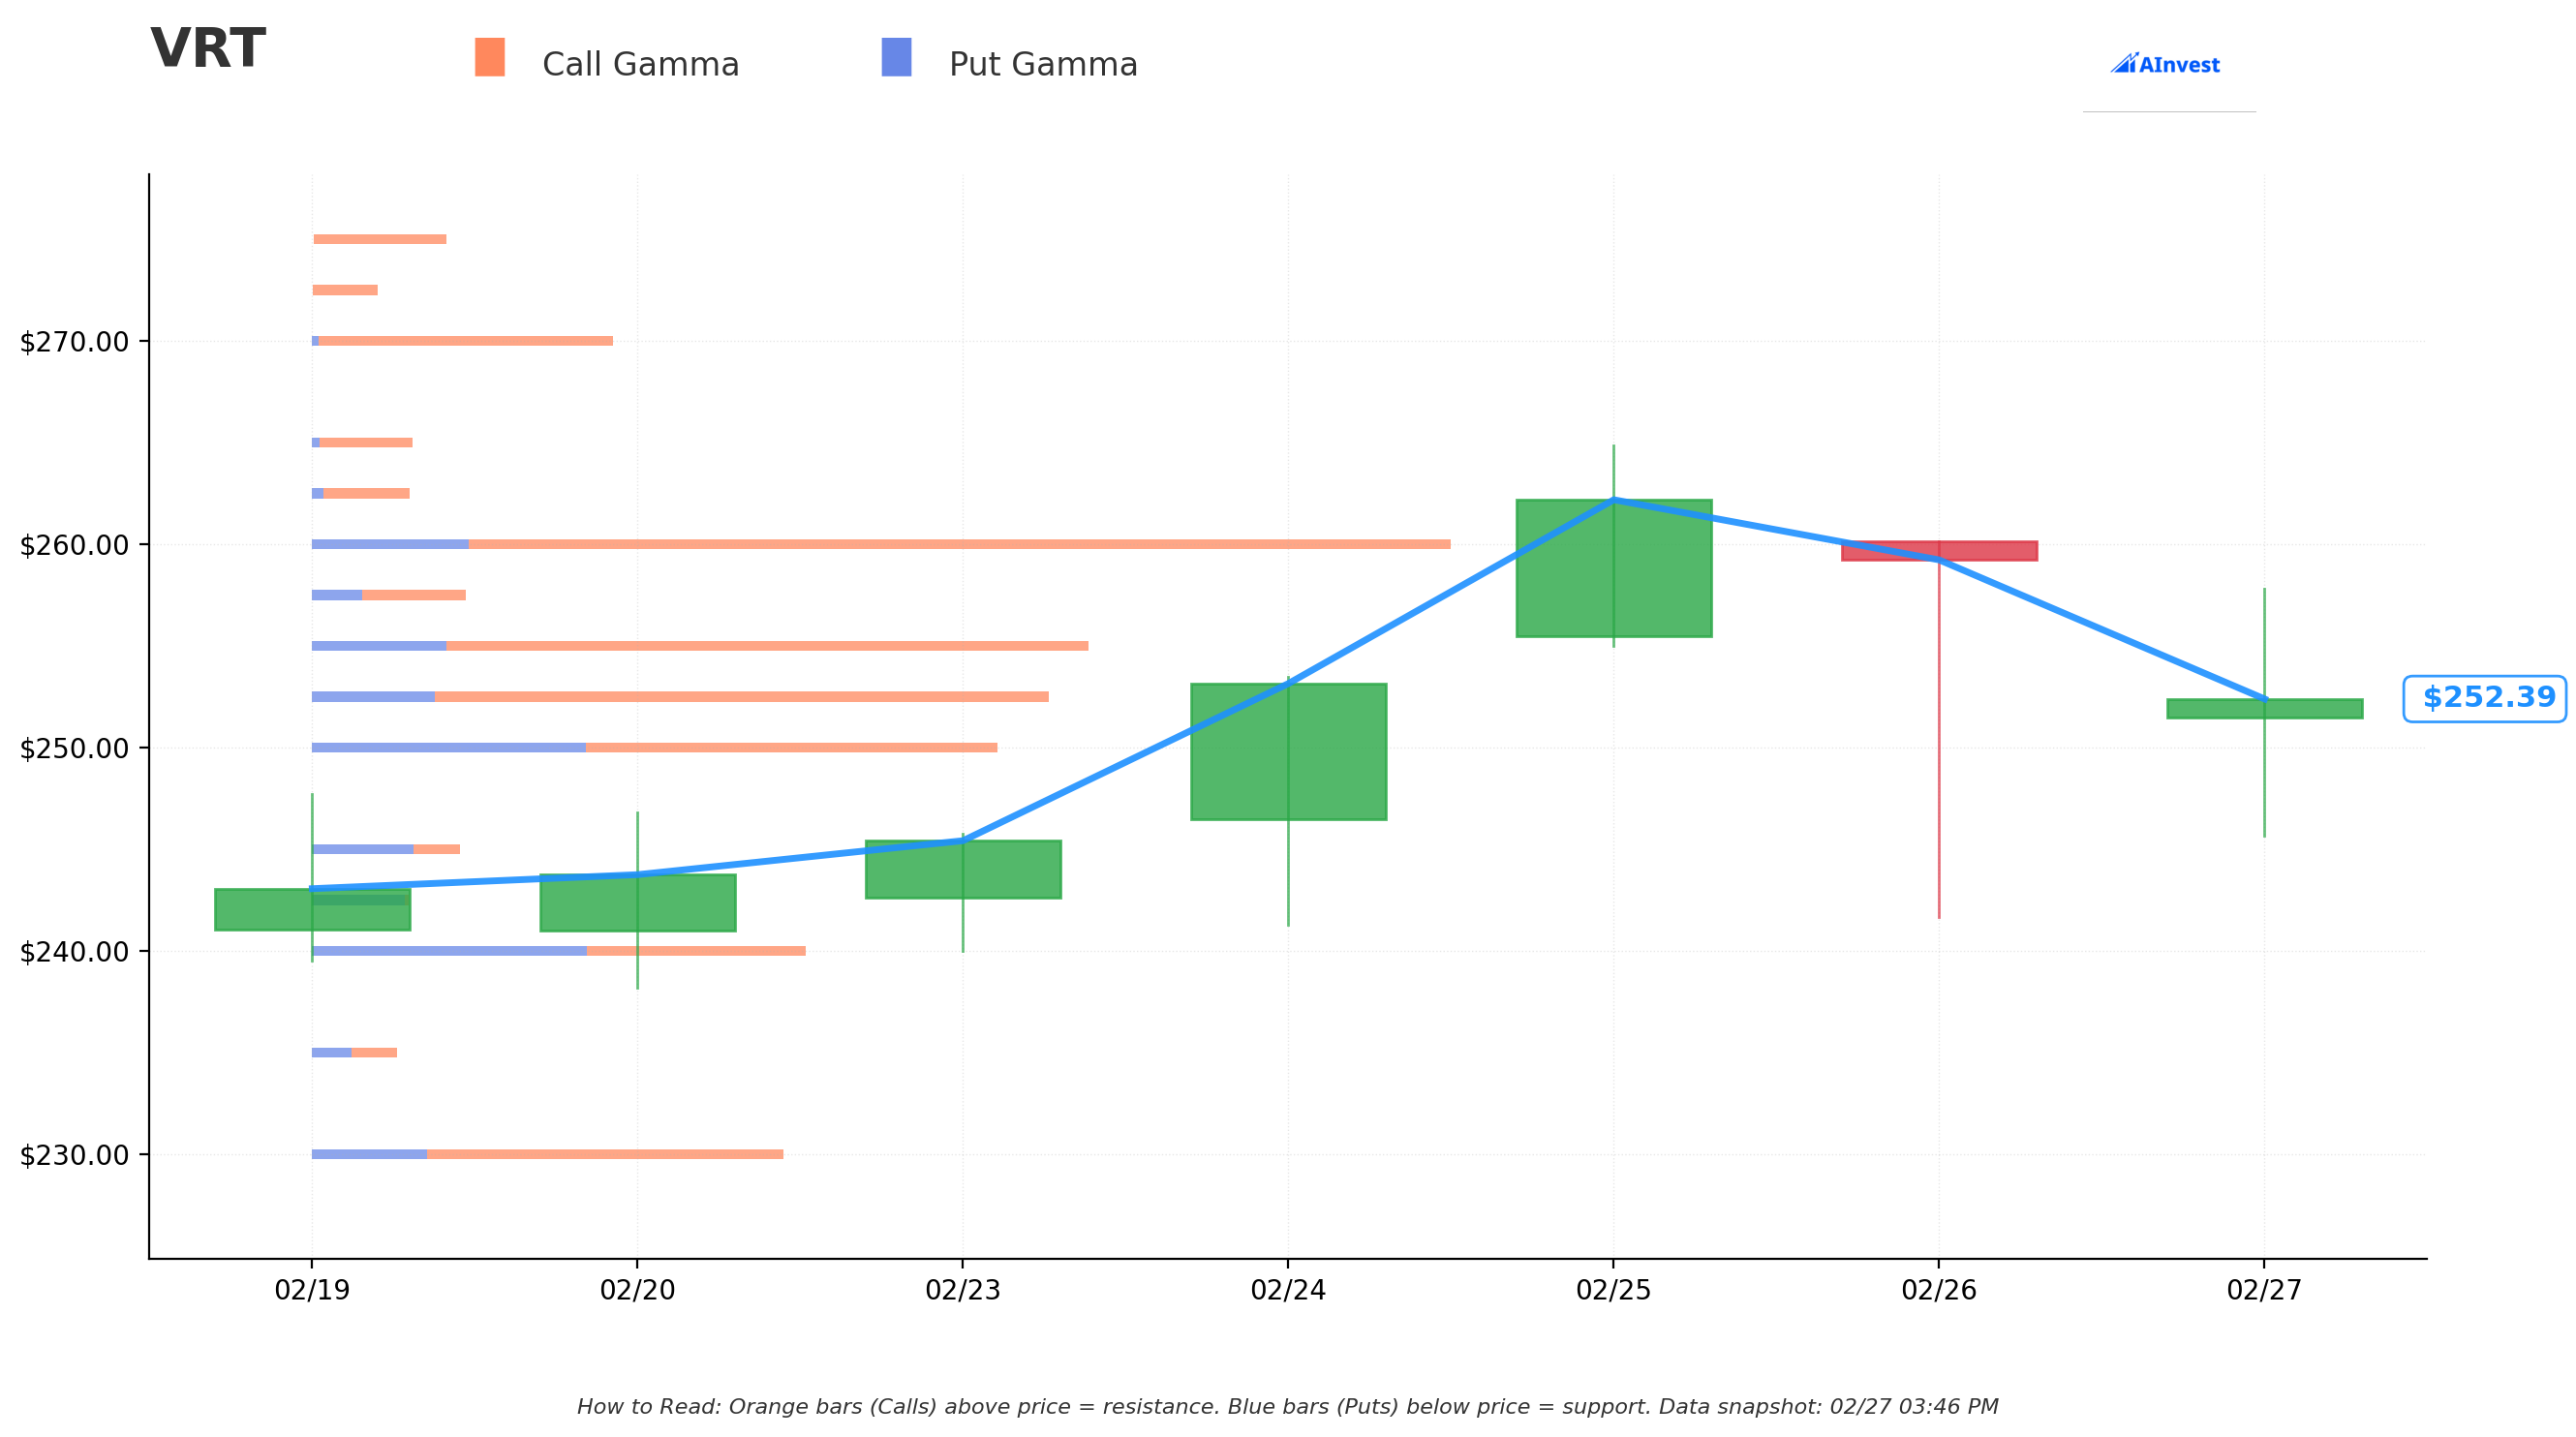
Current Price: $252.25
The gamma exposure map shows where options market maker hedging activity creates natural price floors and ceilings:
🔵 Support Levels (Gamma Below Price):
- $250 - Strongest immediate support with 5.54B total gamma exposure (less than 1% below current price - very tight floor!)
- $240 - Secondary support at 2.77B gamma (4.9% below - key level if $250 breaks)
- $230 - Structural support at 2.64B gamma (8.8% below)
- $210 - Deep support at 2.62B gamma (16.7% below) - notably, this is exactly where the trader bought the long calls
🟠 Resistance Levels (Call Gamma Above Price):
- $252.50 - First resistance right at current price with 3.88B gamma (essentially at-the-money)
- $255 - Near-term resistance at 4.06B gamma (1.1% above)
- $260 - Major resistance wall at 6.33B gamma (3.1% above) -- THE highest gamma concentration on the board, and exactly where the trader sold the short calls!
- $270 - Extended resistance at 1.66B gamma (7.0% above)
- $280 - Further resistance at 1.34B gamma (11.0% above)
- $290 - Upper boundary at 1.25B gamma (15.0% above)
What this means for traders:
The $260 strike is the single largest gamma exposure level for VRT -- 6.33B total gamma, with 5.48B from calls alone. This creates a strong "gamma wall" that will act as a magnet and resistance zone. The trader selling calls at exactly this strike is exploiting this: they know $260 is a natural ceiling where market maker hedging activity will slow the advance. Meanwhile, $250 provides solid support just below.
Net GEX Bias: Bullish (33.8B total call gamma vs 16.1B total put gamma). Dealers are positioned net long gamma, meaning they'll buy dips and sell rallies, creating a stabilizing force. This supports range-bound trading between $250-$260 -- exactly the sweet spot for this diagonal spread.
Implied Move Analysis
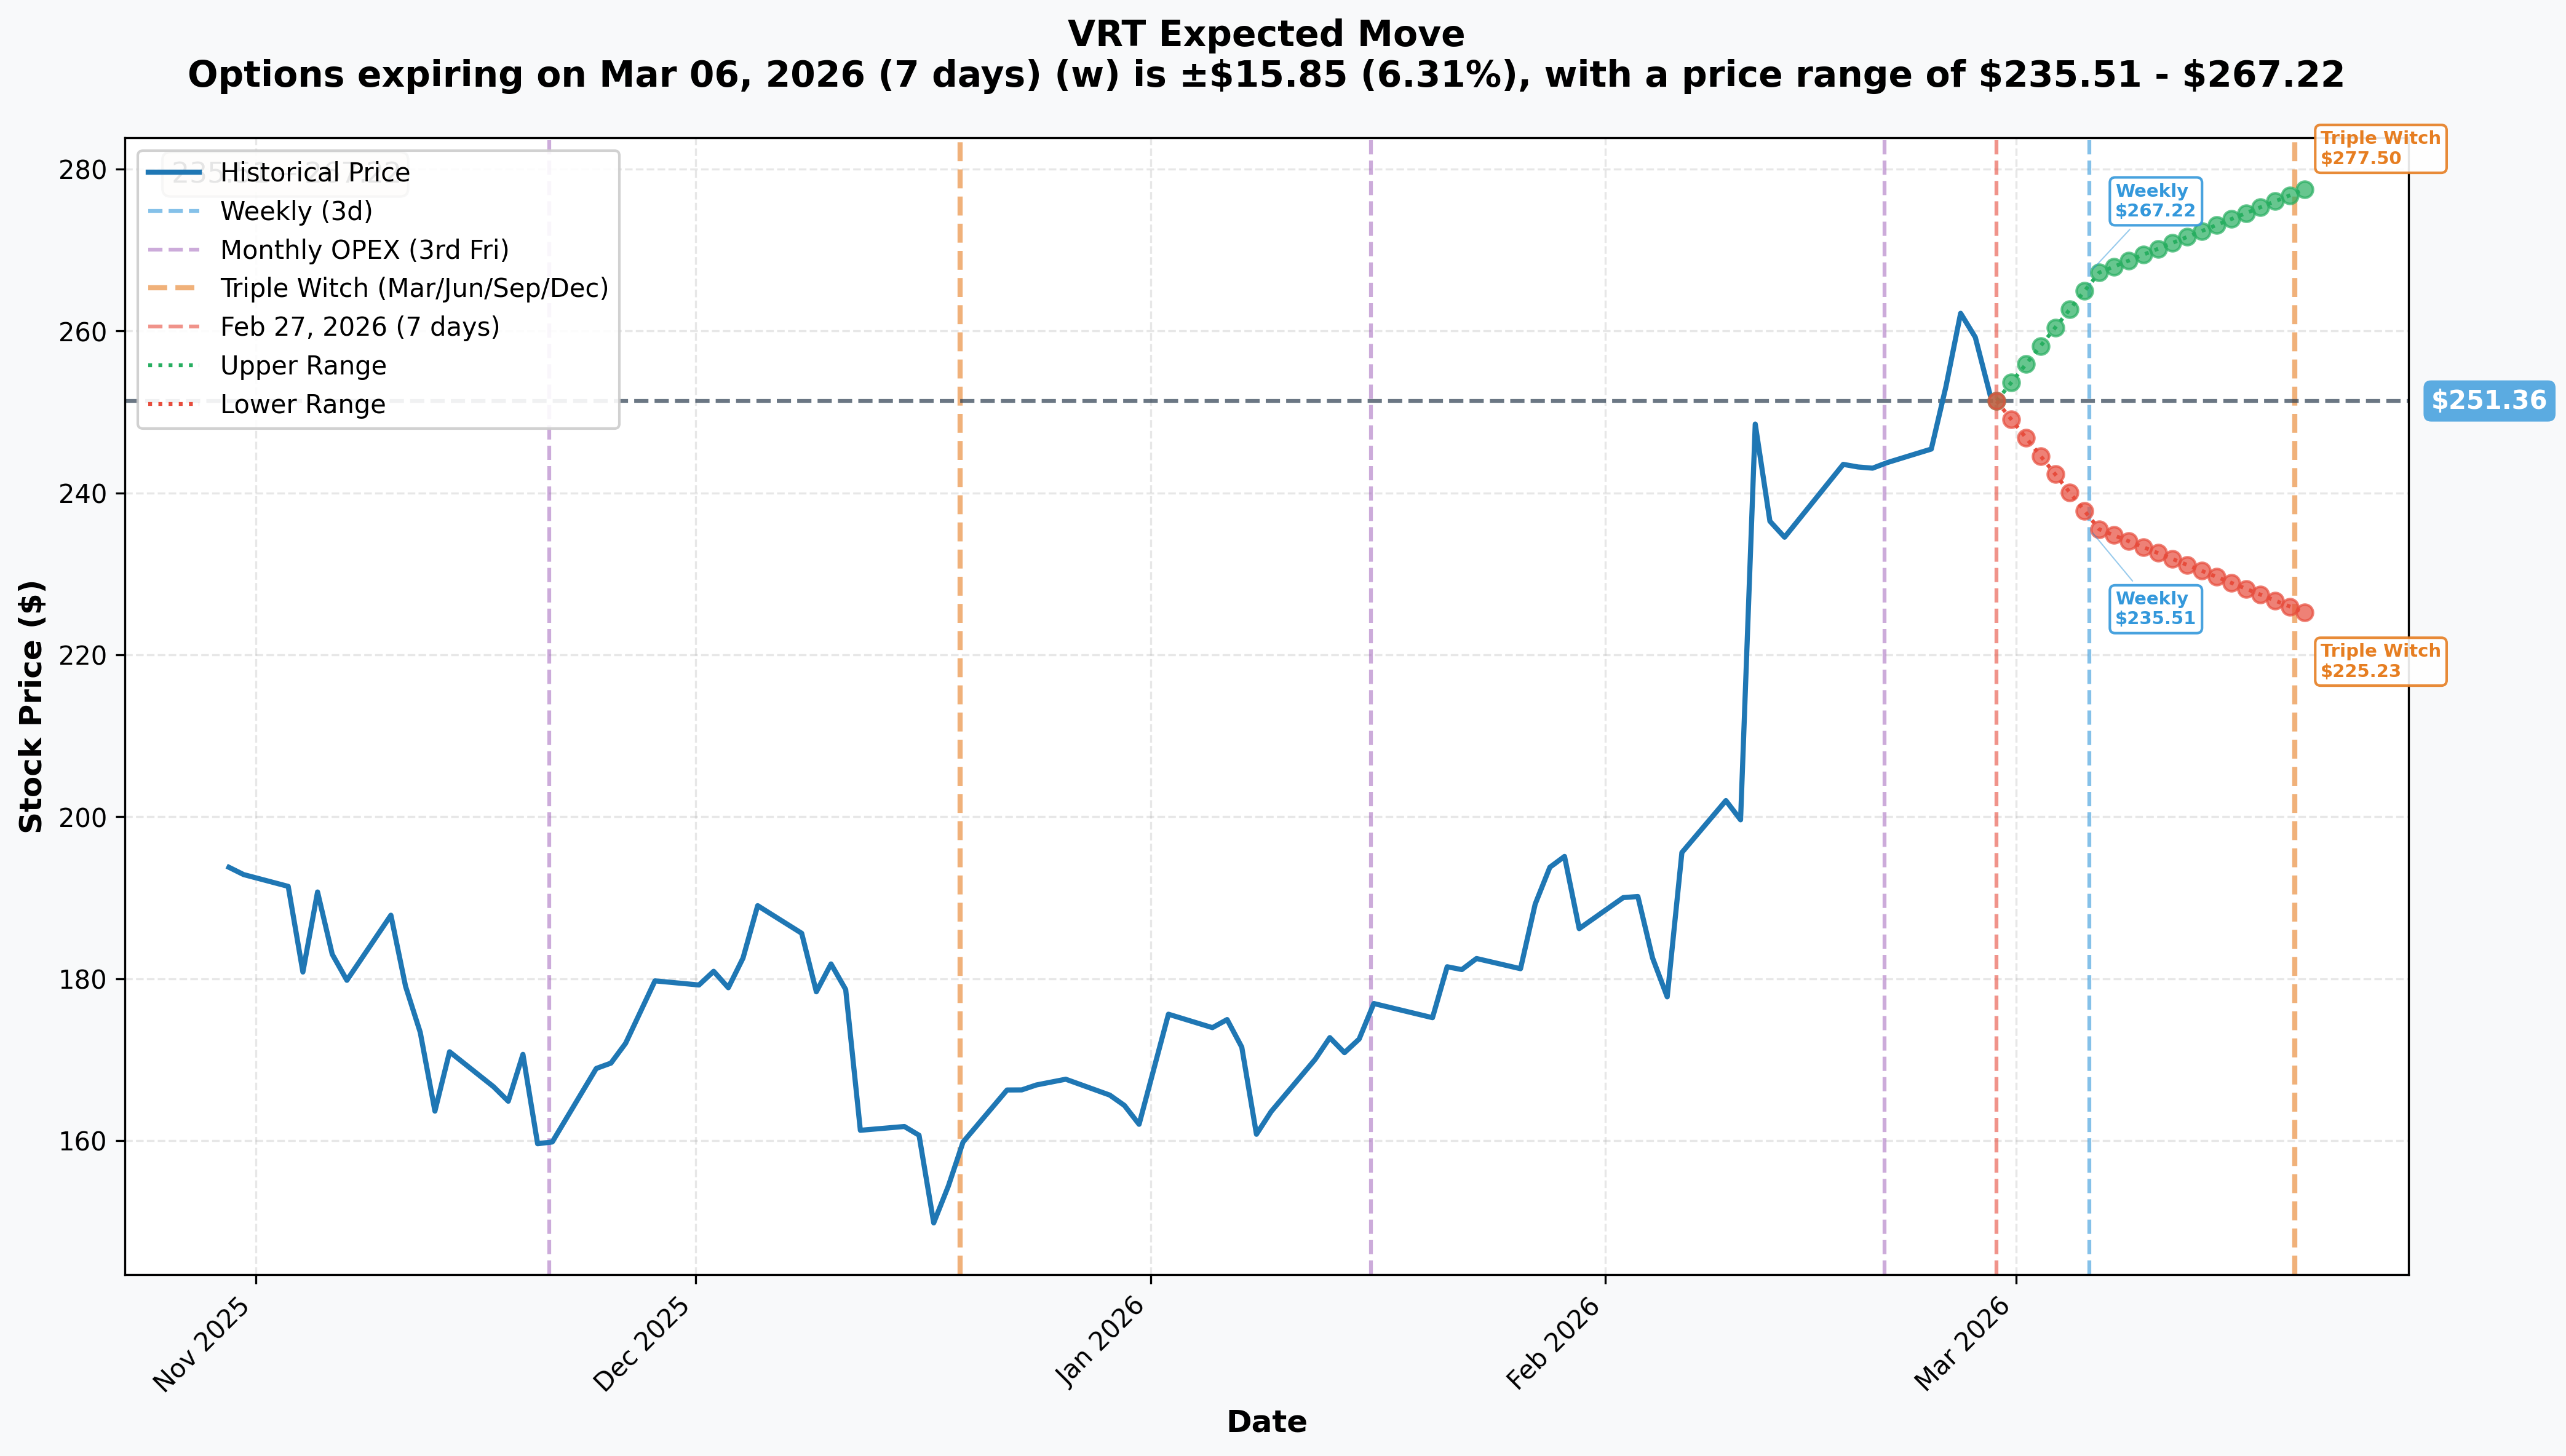
What the options market is pricing for upcoming expirations:
- 📅 Weekly (March 6 - 7 days): ±$15.85 (±6.3%) --> Range: $235.51 - $267.22
- 📅 Monthly OPEX / Triple Witch (March 20 - 21 days): ±$26.14 (±10.4%) --> Range: $225.23 - $277.50
Translation:
The options market expects VRT could swing 6.3% in either direction over the next week alone. That is elevated volatility for a $100B industrial company -- but it reflects the AI narrative and the stock's momentum. The monthly OPEX range of $225-$278 covers a wide band, showing that traders expect continued large moves.
Key insight for this trade: The $210 long call strike sits well below even the lower end of the monthly implied range ($225), meaning those deep ITM calls are very safe from going out-of-the-money. The $260 short call strike sits within the upper monthly range ($278) -- meaning there is a real chance VRT could test $260, but the gamma wall there should slow any advance. This positioning is deliberate.
🎪 Catalysts
🔥 Upcoming Catalysts
1. Q1 2026 Earnings - April 29, 2026 (Pre-Market) 📊
This is the next major data point. Vertiv guided Q1 revenue to $2.5B-$2.7B with EPS of $0.95-$1.01 (consensus: $0.97). Key things to watch:
- 📊 Whether 252% organic orders growth pace sustains into 2026
- 📈 Backlog trajectory -- can it hold or grow beyond $15B?
- 🏭 Margin expansion progress (Q4 adjusted operating margin was 23.2%)
- 💰 First full-quarter contribution from PurgeRite acquisition ($1B)
- ⚡ Tariff mitigation progress -- management stated countermeasures should materially offset tariff impact by Q1 exit
2. Vertiv 2026 Investor Conference - May 19-20, 2026 (Greenville, SC) 🏭
This could be THE catalyst that pushes VRT past the $260 wall. Two-day event featuring:
- 📊 Strategy presentations and updated long-term financial targets on Day 1
- 🏭 Technology-focused sessions and guided facility tours on Day 2
- 📈 Likely to include 2027+ pipeline visibility and multi-year backlog composition
- 🤖 Showcase of 800 VDC power architecture developed with NVIDIA
This two-day event falls exactly within the June $210 call's expiration window. The diagonal spread trader has this circled in red.
3. 800 VDC Power Portfolio Release - H2 2026 ⚡
Developed in collaboration with NVIDIA to power next-gen AI factories:
- 🔌 Centralized rectifiers, high-efficiency DC busways, and rack-level DC-DC converters
- 🤖 Engineered for megawatt-scale rack demands of NVIDIA Rubin Ultra platform (2027)
- ⚡ Represents a fundamental shift from AC to DC power distribution in AI data centers
- 🏭 4,000+ field service engineers positioned for deployment readiness
4. Q2 2026 Earnings - Expected Late July / Early August 2026 📊
- First full quarter of 2026 guidance execution
- Backlog conversion rate and margin trajectory will be closely watched
- Falls after the June call expiration, so relevant mainly for the short January 2027 leg
5. Potential S&P 500 Index Events 📊
- With market cap exceeding $100B, VRT qualifies for consideration in major index rebalancing
- Any inclusion event could drive meaningful passive buying flows
✅ Recent Catalysts (Already Happened)
Q4 2025 Earnings - February 11, 2026 📊
Record-breaking results that sent VRT up ~17.5%:
- 💰 Revenue: $2,880M (+23% YoY), Adjusted EPS: $1.36 (+37% YoY, beat by $0.06)
- 📈 Organic orders: +252% YoY -- an extraordinary number for an industrial company
- 📊 Backlog: $15.0B (+109% YoY) with book-to-bill ratio of ~2.9x
- 🎯 2026 guidance: Revenue $13.25B-$13.75B (27-29% organic growth), Adj. EPS $5.97-$6.07 (+43% YoY)
- 🏦 Moody's upgraded credit rating to Ba1 from Ba2 on improved financial profile
Massive Analyst Re-Rating - February 12, 2026 📈
Wall Street consensus jumped from $196.83 to $265.81 average (+35%):
- 🏦 JPMorgan raised to $305 (highest on the Street)
- 🏦 Citi raised to $286
- 🏦 Deutsche Bank raised to $281
- 🏦 Goldman Sachs raised to $277
- 📊 Consensus: Strong Buy (14 Buy, 1 Hold, 0 Sell)
MegaMod HDX Launch - January 14, 2026 🏭
New prefabricated modular solution for AI data centers delivering up to 10 MW per installation with rack densities from 50 kW to over 100 kW.
PurgeRite Acquisition - December 4, 2025 💰
$1.0B acquisition of Houston-based liquid cooling services leader, expanding Vertiv's end-to-end liquid cooling lifecycle capability with up to $250M earn-out potential.
Caterpillar Energy Collaboration - November 18, 2025 🤝
Non-binding MOU combining Vertiv's power distribution with Caterpillar's power generation for behind-the-meter AI data center solutions.
🎲 Price Targets & Probabilities
Using gamma levels, implied move data, analyst targets, and the catalyst calendar, here are the scenarios through the June 18, 2026 expiration (the long leg) and beyond:
📈 Bull Case (30% probability)
Target: $270-$305 by June 2026
How we get there:
- 🚀 Q1 earnings on April 29 beat guidance, orders growth sustains above 100% YoY
- 🏭 May 19-20 Investor Day raises long-term targets and reveals multi-year backlog extending to 2028+
- 📈 Stock breaks through the $260 gamma wall on heavy volume and runs toward JPMorgan's $305 target
- ⚡ NVIDIA collaboration generates additional product announcements
- 📊 Potential S&P 500 inclusion triggers passive fund buying
- 💪 Tariff countermeasures prove effective, providing a margin tailwind
Diagonal spread P&L at $280: June $210 calls worth ~$70, short Jan $260 calls worth ~$55 (estimated with time value). Net position profit: ~$15/spread minus $2.10 cost = ~$12.90/spread x 10,000 = ~$12.9M profit
Diagonal spread P&L at $305 (JPM target): Gets more complex -- the short $260 calls gain significant intrinsic value. Net profit depends on timing and management of the short leg, but the June long leg alone would be worth $95 (vs $56 cost) = ~$39M gain on long side. Short leg assignment risk becomes real.
🎯 Base Case (50% probability)
Target: $248-$265 range (stays near current levels through June)
Most likely scenario:
- ✅ Q1 earnings meet guidance -- strong but already priced in after the 17.5% post-Q4 rally
- 📊 Investor Day confirms the growth story without dramatically raising targets
- ⚖️ Stock oscillates between $250 support and $260 gamma wall resistance
- 🔄 Gradual grind toward analyst consensus of $265.81
- 📈 Net GEX bullish bias keeps the floor at $250
Diagonal spread P&L at $255: June $210 calls worth ~$45 intrinsic + minimal extrinsic. Short Jan $260 calls still have ~7 months of time value remaining, worth roughly $38-42 (mostly time value). Net position: the long leg loses ~$11 from cost ($56 to $45) but the short leg has also decayed modestly in value. Modest loss to modest gain depending on IV levels -- roughly -$3 to +$3 per spread.
This is where the trade shines -- the net cost of only $2.10 means the trader needs very little movement to break even.
📉 Bear Case (20% probability)
Target: $220-$240
What could go wrong:
- 😰 Q1 earnings miss guidance, backlog conversion slows or margins disappoint
- 🏭 Tariff countermeasures fall short, compressing margins
- 📉 AI spending narrative weakens (echoes of the DeepSeek selloff in early 2025)
- ⚔️ Reports of hyperscalers developing in-house cooling technology resurface
- 📊 Stock breaks below $250 support and tests $240 gamma level (4.9% below)
- 💸 At 71x trailing P/E, any negative surprise triggers aggressive multiple compression
Diagonal spread P&L at $230: June $210 calls worth ~$20 (mostly intrinsic), short Jan $260 calls worth ~$20-25 (mostly time value). Long leg loss: $56 - $20 = -$36/contract. Short leg gain: $53.90 - $22 = ~$32/contract. Net loss: ~$4-6 per spread x 10,000 = ~$4M-$6M loss. Still a contained loss relative to the $56M long notional -- the short leg acts as a significant cushion.
💡 Trading Ideas
🛡️ Conservative: "Follow the Smart Money" - June Call Spread
Play: Buy the VRT June 2026 $250 calls, sell the VRT June 2026 $270 calls
Why this works:
- 📊 Mirrors the institutional thesis (bullish through June) at a fraction of the cost
- 🛡️ Defined risk: max loss is the net debit paid (~$9-11 per spread)
- 💰 Max profit: $20 per spread minus debit ($9-11 gain) if VRT above $270 at June expiry
- ⏰ Same expiration captures Q1 earnings (April 29) and Investor Day (May 19-20)
- 📈 $250 strike sits right at the strongest gamma support level
- 🎯 $270 strike aligns with the gamma resistance at that level (1.66B gamma)
- 🤝 If the institutional diagonal spread thesis is correct, the stock moves into your profit zone
Position sizing: Risk no more than 3-5% of portfolio. 10 spreads at ~$10 each = ~$10,000 risk for ~$10,000 max profit.
Risk level: Moderate (defined risk, directional) | Skill level: Intermediate
⚖️ Balanced: "Catalyst Capture" - June $240/$250/$260 Call Butterfly
Play: Buy 1x June $240 call, sell 2x June $250 calls, buy 1x June $260 call
Why this works:
- 🎯 Targets the $240-$260 sweet spot where the institutional trade profits most
- 💸 Very low cost -- butterfly spreads typically cost $3-5 per spread
- 📊 Max profit zone centered on $250 (strongest gamma support and current price area) = ~$6-7 per spread
- ⏰ Same June expiration captures both major catalysts
- 📈 Risk/reward roughly 2:1 if VRT settles near $250
- 🔄 Benefits from the range-bound thesis supported by gamma positioning ($250 support, $260 resistance)
Position sizing: 20-50 spreads at ~$4 each = $8,000-$20,000 risk for $12,000-$35,000 max profit.
Risk level: Moderate (defined risk, needs price precision) | Skill level: Intermediate-Advanced
🚀 Aggressive: "Ride the Backlog" - June $260 Calls
Play: Buy VRT June 2026 $260 calls outright
Why this works (and why it is risky):
- 💥 Positioned right at the $260 gamma wall -- if VRT breaks through, the move could accelerate
- 📊 Strike aligns with the $260 analyst average target and the diagonal spread trader's short strike
- ⏰ Captures Q1 earnings, Investor Day, and any potential index inclusion news
- 🚀 If VRT hits $280 (Citi's target area), these calls could double or triple from entry
- 📈 JPMorgan's $305 target implies significant room above $260
Why it could blow up:
- 💸 The $260 strike is the biggest gamma wall on the board -- market maker hedging will resist the breakout
- ⏰ 111 days of time decay eating at your premium daily
- 📉 If VRT stays below $260, you lose everything
- 🎢 At ~$15-18 per contract, you are paying a meaningful premium for OTM calls on a stock that already rallied 17.5% post-earnings
Position sizing: Risk ONLY what you can afford to lose completely. 5-10 contracts = ~$7,500-$18,000 at risk.
Risk level: HIGH (can lose 100% of premium) | Skill level: Advanced
⚠️ Risk Factors
Don't overlook these potential headwinds:
-
📊 Valuation is stretched: VRT trades at 71x trailing P/E and ~43x forward P/E -- well above the sector average of ~38x. Some valuation models suggest 30-40% overvaluation at current levels. Any earnings miss or guidance cut would trigger sharp multiple compression.
-
🏭 Hyperscaler in-housing risk: There have been reports of major cloud operators testing in-house microfluidic chip-cooling. If hyperscalers develop proprietary cooling technology at scale, long-term demand for Vertiv's core cooling business could erode. This risk triggered a notable selloff earlier in 2025.
-
⚡ Backlog conversion execution risk: A $15B backlog must be converted to revenue without margin erosion. Scaling operations by 27-29% in a single year while integrating a $1B acquisition is operationally demanding. CapEx is rising to 3-4% of sales (from 2-3%), increasing capital intensity.
-
🌍 Tariff and trade policy uncertainty: Management acknowledged tariff conditions remain "fluid and uncertain". Q2 2025 was impacted by higher supply chain costs. While countermeasures are reportedly in place, tariff escalation remains a margin risk.
-
⚔️ Competitive pressure from Schneider Electric and Eaton: Schneider is virtually tied for global data center infrastructure market share and investing heavily. Eaton is gaining ground with liquid-ready products. Pricing pressure could emerge if hyperscalers pit vendors against each other.
-
📉 AI spending deceleration risk: A slowdown in hyperscaler CapEx spending would directly impact Vertiv's order pipeline. The DeepSeek efficiency narrative in early 2025 showed how quickly sentiment can shift -- VRT dropped 42% during that episode.
-
⏰ Diagonal spread specific risk -- naked short call after June: When the long June $210 calls expire, this trader will be left short 10,000 January 2027 $260 calls without a hedge. If VRT rallies sharply above $260 in H2 2026 (800 VDC launch, strong earnings), those naked calls could generate substantial losses. The trader will need to manage this actively.
🎯 The Bottom Line
Here's the deal: A sophisticated institutional player just put on a $110M notional diagonal calendar spread in VRT, paying just ~$1.6M net to get massively long through the most catalyst-dense period in the company's history. This is not a gamble -- it is a calculated, low-cost-basis play that exploits the time value difference between near-term deep ITM calls and longer-dated OTM calls.
What this trade tells us:
- 🎯 The institution believes VRT stays in the $248-$260 range through June -- the sweet spot where this diagonal spread generates maximum returns
- 💰 They are NOT betting on a massive breakout above $260 -- in fact, they are capping themselves there by selling the $260 calls
- ⏰ The timing is surgical: June 18 expiration captures Q1 earnings (April 29) and the Investor Conference (May 19-20) -- the two biggest near-term catalysts
- 📊 The $260 gamma wall (highest gamma exposure on the board) validates their thesis that VRT will struggle to break above that level in the near term
- 🧠 The ~$1.6M net cost means this trader can be wrong by a lot and still not take a devastating loss. This is professional risk management in action.
If you are bullish on VRT:
- ✅ Consider call spreads or butterflies targeting the $250-$260 range -- the gamma structure and institutional positioning both point to this zone
- 📊 The $250 gamma support is your near-term floor -- if it breaks, reassess
- ⏰ Mark April 29 (Q1 earnings) and May 19-20 (Investor Day) as the key dates on your calendar
- 💡 Do not chase above $260 without strong conviction -- the gamma wall there is real and the institutions are selling into it
If you are watching from the sidelines:
- 🎯 A pullback to $240 (secondary gamma support) would offer a better risk/reward entry
- 📊 Wait for Q1 earnings confirmation that 252% orders growth is sustainable
- 📈 The analyst consensus average of $265.81 with a high of $305 (JPMorgan) shows the Street sees further upside
- ⏰ The Investor Day on May 19-20 could be a turning point -- updated long-term targets and facility tours have historically been re-rating events for VRT
If you are cautious:
- ⚠️ At 71x trailing earnings, VRT is priced for a lot of good news -- a single earnings miss could trigger a 15-20% correction
- 📉 The 2025 selloff (down 42% on AI spending concerns) shows how violently this stock can move on sentiment shifts
- 🛡️ Consider put spreads or collars to protect existing long positions through earnings
- 📊 The $240 and $230 gamma supports are your downside reference points
Key dates to mark:
- 📅 March 6, 2026 - Weekly OPEX (implied range $235-$267)
- 📅 March 20, 2026 - Monthly OPEX / Triple Witch (implied range $225-$278)
- 📅 April 29, 2026 - Q1 2026 earnings (Pre-Market)
- 📅 May 19-20, 2026 - Vertiv Investor Conference (Greenville, SC)
- 📅 June 18, 2026 - Long June $210 calls expire -- THIS TRADE's long leg moment of truth
- 📅 H2 2026 - 800 VDC power portfolio launches with NVIDIA
- 📅 January 15, 2027 - Short January $260 calls expire -- short leg expiration
Final verdict: This $110M diagonal spread is the work of a seasoned professional who wants leveraged long exposure to VRT's catalyst window at minimal net cost. They are not swinging for the fences -- they are methodically positioning for the stock to consolidate in the $248-$260 range while catalysts play out. For retail traders, the message is clear: VRT's Q1 earnings and Investor Day could move the stock materially, but the smart money is playing it with defined risk and exploiting time value differences rather than making naked directional bets. Follow their lead -- use spreads, manage your risk, and let the catalysts come to you. 💪
Disclaimer: Options trading involves substantial risk of loss and is not suitable for all investors. This analysis is for educational purposes only and not financial advice. Past performance does not guarantee future results. Calendar and diagonal spreads are complex strategies with multiple legs that require active management -- consult a licensed financial advisor before trading. Always do your own research.
About Vertiv Holdings Co: Vertiv designs and manufactures critical digital infrastructure and continuity solutions for data centers, communication networks, and commercial and industrial environments. As the leading pure-play on AI data center power and cooling, the company holds a ~$100B market cap in the Electronic Components sector with a $15B backlog and 252% organic orders growth powered by the global AI infrastructure buildout.