🐻 XLK: $10M Tech Sector Short Call - Betting Against the Mag 7!
📅 December 19, 2025 | 🔥 Extremely Unusual Activity Detected
🎯 The Quick Take
Someone just sold $10 MILLION worth of June 2027 calls on XLK (the tech ETF) at the $145 strike - basically at-the-money with the ETF at $144.36! This 18-month long-dated position screams either massive covered call income generation or a big bet that tech won't rally significantly over the next year and a half. With a z-score of 9.59, this is roughly 10x the normal activity level - institutional money is making a statement about tech's upside limits. 👀
💰 The Option Flow Breakdown
📊 What Just Happened
| Time | Symbol | Side | Type | Expiration | Strike | Premium | Volume | Z-Score | Option Chart |
|---|---|---|---|---|---|---|---|---|---|
| 09:44:40 | XLK | 🔴 SELL | CALL | 2027-06-17 | $145 | $10M | 6,100 | 9.59 | View Chart |
Unusualness Metrics:
- 🎯 Strategy: Short Call (STANDALONE)
- 🔥 Signal: OPEN (new position initiated)
- 📊 Vol/OI Ratio: 3.389 (HIGH_ACTIVITY)
Current Market Context:
- 💹 XLK Price: $144.36
- 📊 Distance to Strike: Just $0.64 above current price (0.4% OTM)
- ⏰ Time Value: 550 days to expiration
🤓 What This Actually Means
Real talk: Selling $10M worth of calls 18 months out at essentially the current price is a MAJOR strategic bet. Let's break down what this trader is thinking:
If This Is a Covered Call (Most Likely):
- They own $87.9M worth of XLK shares (6,100 contracts x 100 x $144.36)
- They're collecting premium (likely $14-18 per share = $8.5M-11M total) to cap their upside at $145
- Translation: "I own tech, I'll take the premium income, but I don't think XLK goes much above $145 before June 2027"
- This is income generation at scale - probably an institutional portfolio overlay strategy
If This Is Naked/Synthetic Short (Less Likely But Possible):
- They're betting tech DOESN'T rally more than $0.64 over the next 18 months
- Maximum profit = premium collected (roughly $8.5M-11M)
- Maximum risk = UNLIMITED if XLK explodes higher
- This would require massive margin and institutional risk tolerance
Why This Matters:
- XLK holds 38% concentration in NVIDIA (13.86%), Apple (13.28%), and Microsoft (11.74%)
- This trade is essentially capping upside on the "Magnificent 7" tech stocks
- The $145 strike becomes a key resistance level where this institution will defend by selling shares if assigned
- With 6,100 contracts, this creates MASSIVE gamma resistance at $145
📈 Technical Setup
Year-to-Date Chart Analysis
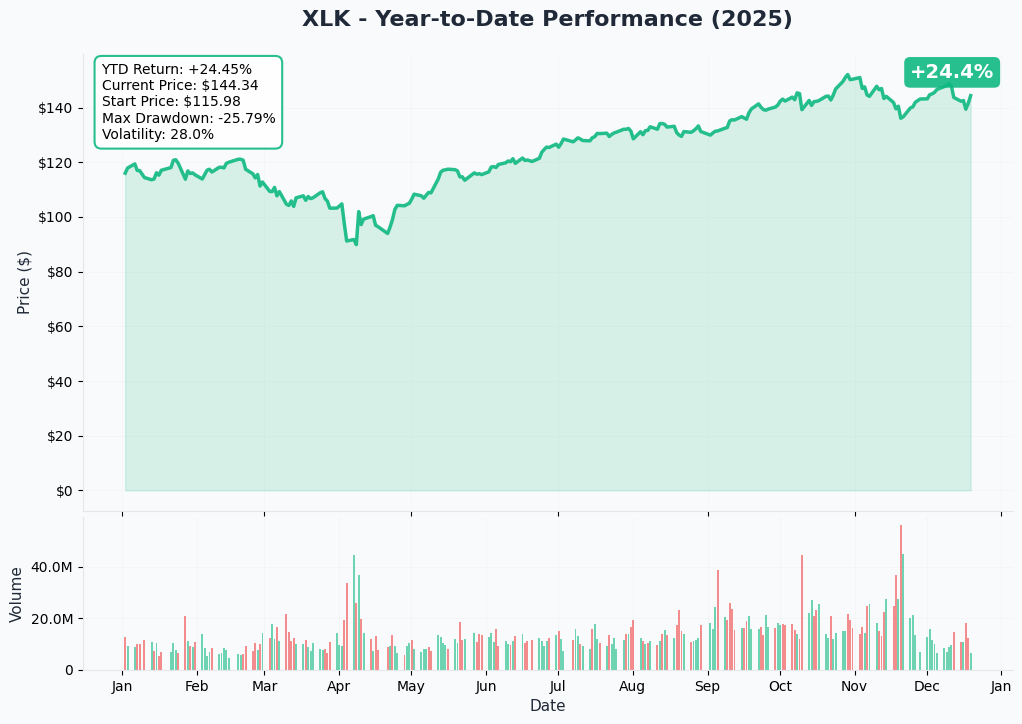
Chart Tells the Story: XLK has delivered a stellar 24.17% YTD return through December 18, surging from the mid-$110s to recent highs near $153 [^1_1]. The ETF is currently trading at $144.36, about 5.6% off its 52-week high of $152.99. Recent price action shows:
- 📈 Strong uptrend since October lows around $126
- 🎯 Current consolidation in the $142-147 range
- 📊 Key support holding at the $142-143 zone
- ⚠️ Recent pullback from December highs suggests some exhaustion
The bigger picture: Tech has been THE growth engine in 2025, but sector rotation saw tech down 4.29% in November as money flowed into financials and industrials. Net outflows of $137.98M over five days through mid-December suggest institutional appetite may be cooling [^5_1].
Gamma-Based Support & Resistance Analysis
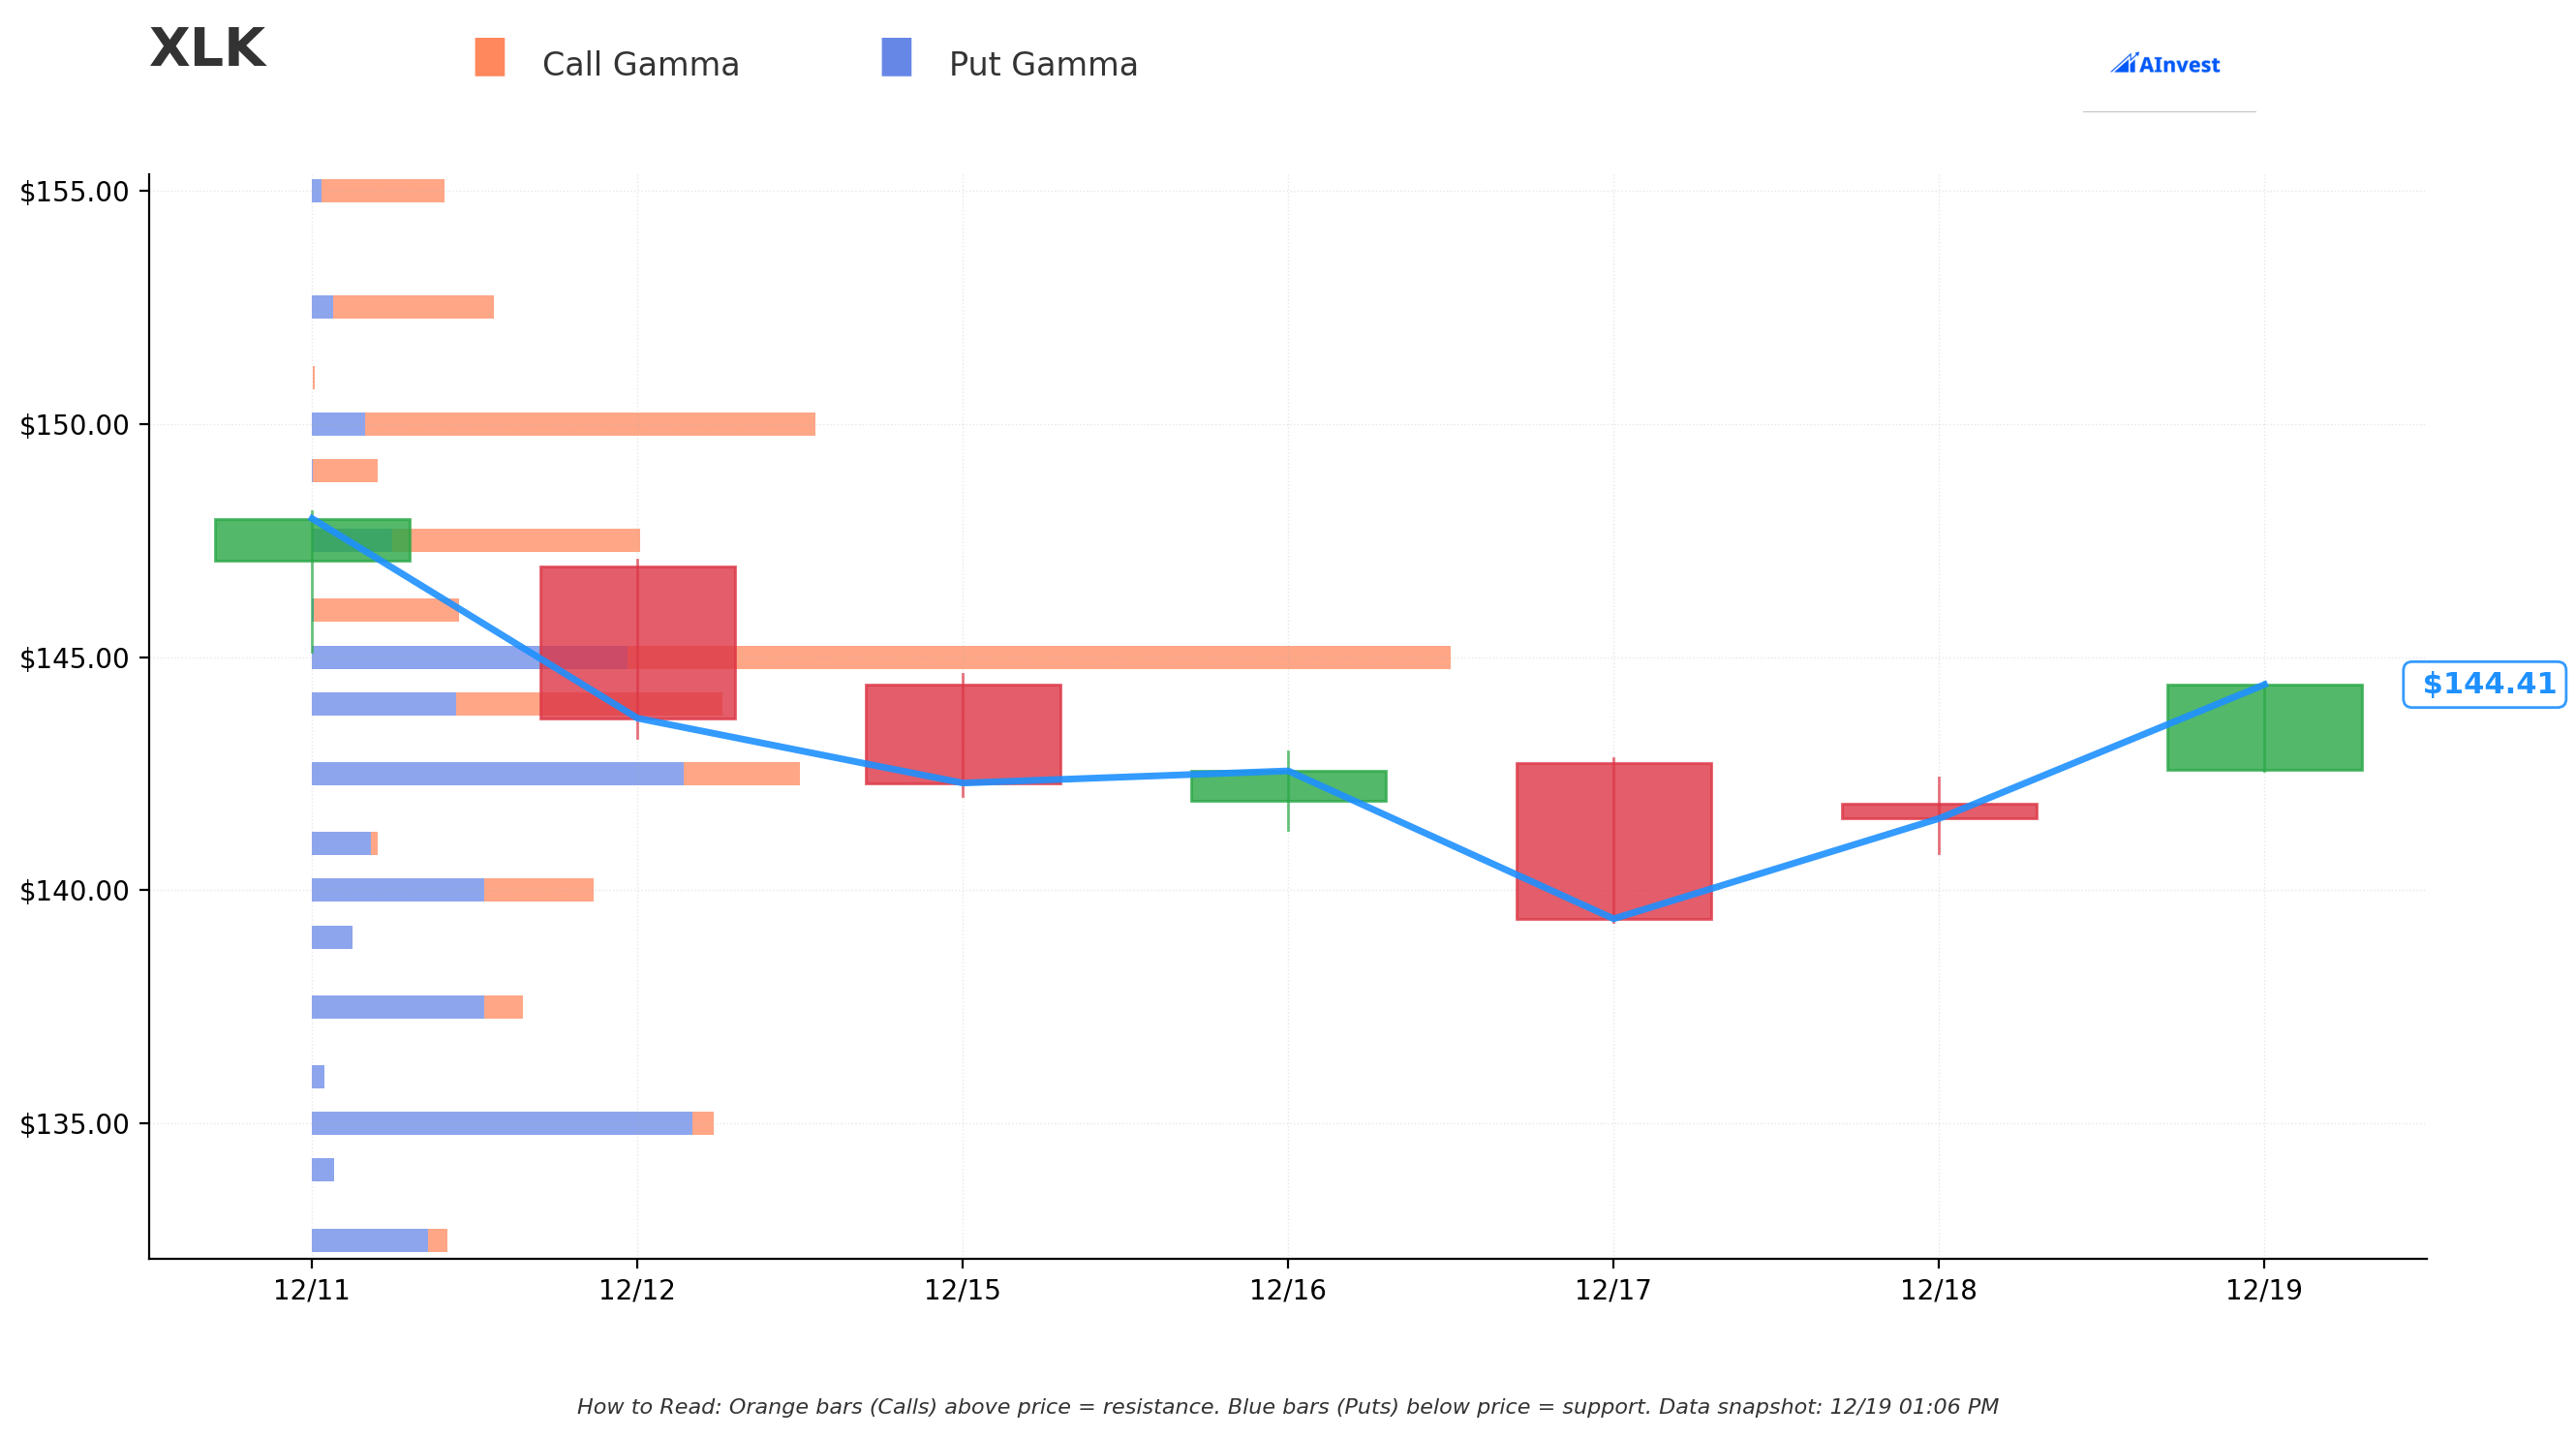
What the Gamma Levels Tell Us:
Market makers and options dealers have HUGE positions clustered at these key strikes, creating natural support and resistance zones:
Resistance Levels (Call Gamma):
- 🟠 $145 - Very Strong (7.72M) ← THIS IS WHERE OUR TRADE IS!
- 🟠 $152.50 - Strong (4.11M)
- 🟠 $155 - Moderate (2.31M)
Support Levels (Put Gamma):
- 🔵 $142.50 - Very Strong (-6.93M)
- 🔵 $137.50 - Strong (-3.82M)
- 🔵 $135 - Very Strong (-5.44M)
Translation: The $145 strike already had massive call gamma BEFORE this trade - now with 6,100 additional contracts, it's become an even bigger wall. Market makers will actively hedge by selling XLK shares as price approaches $145, creating selling pressure. The $142.50 put support should act as a floor where dealers buy to hedge their put exposure.
Implied Move Analysis
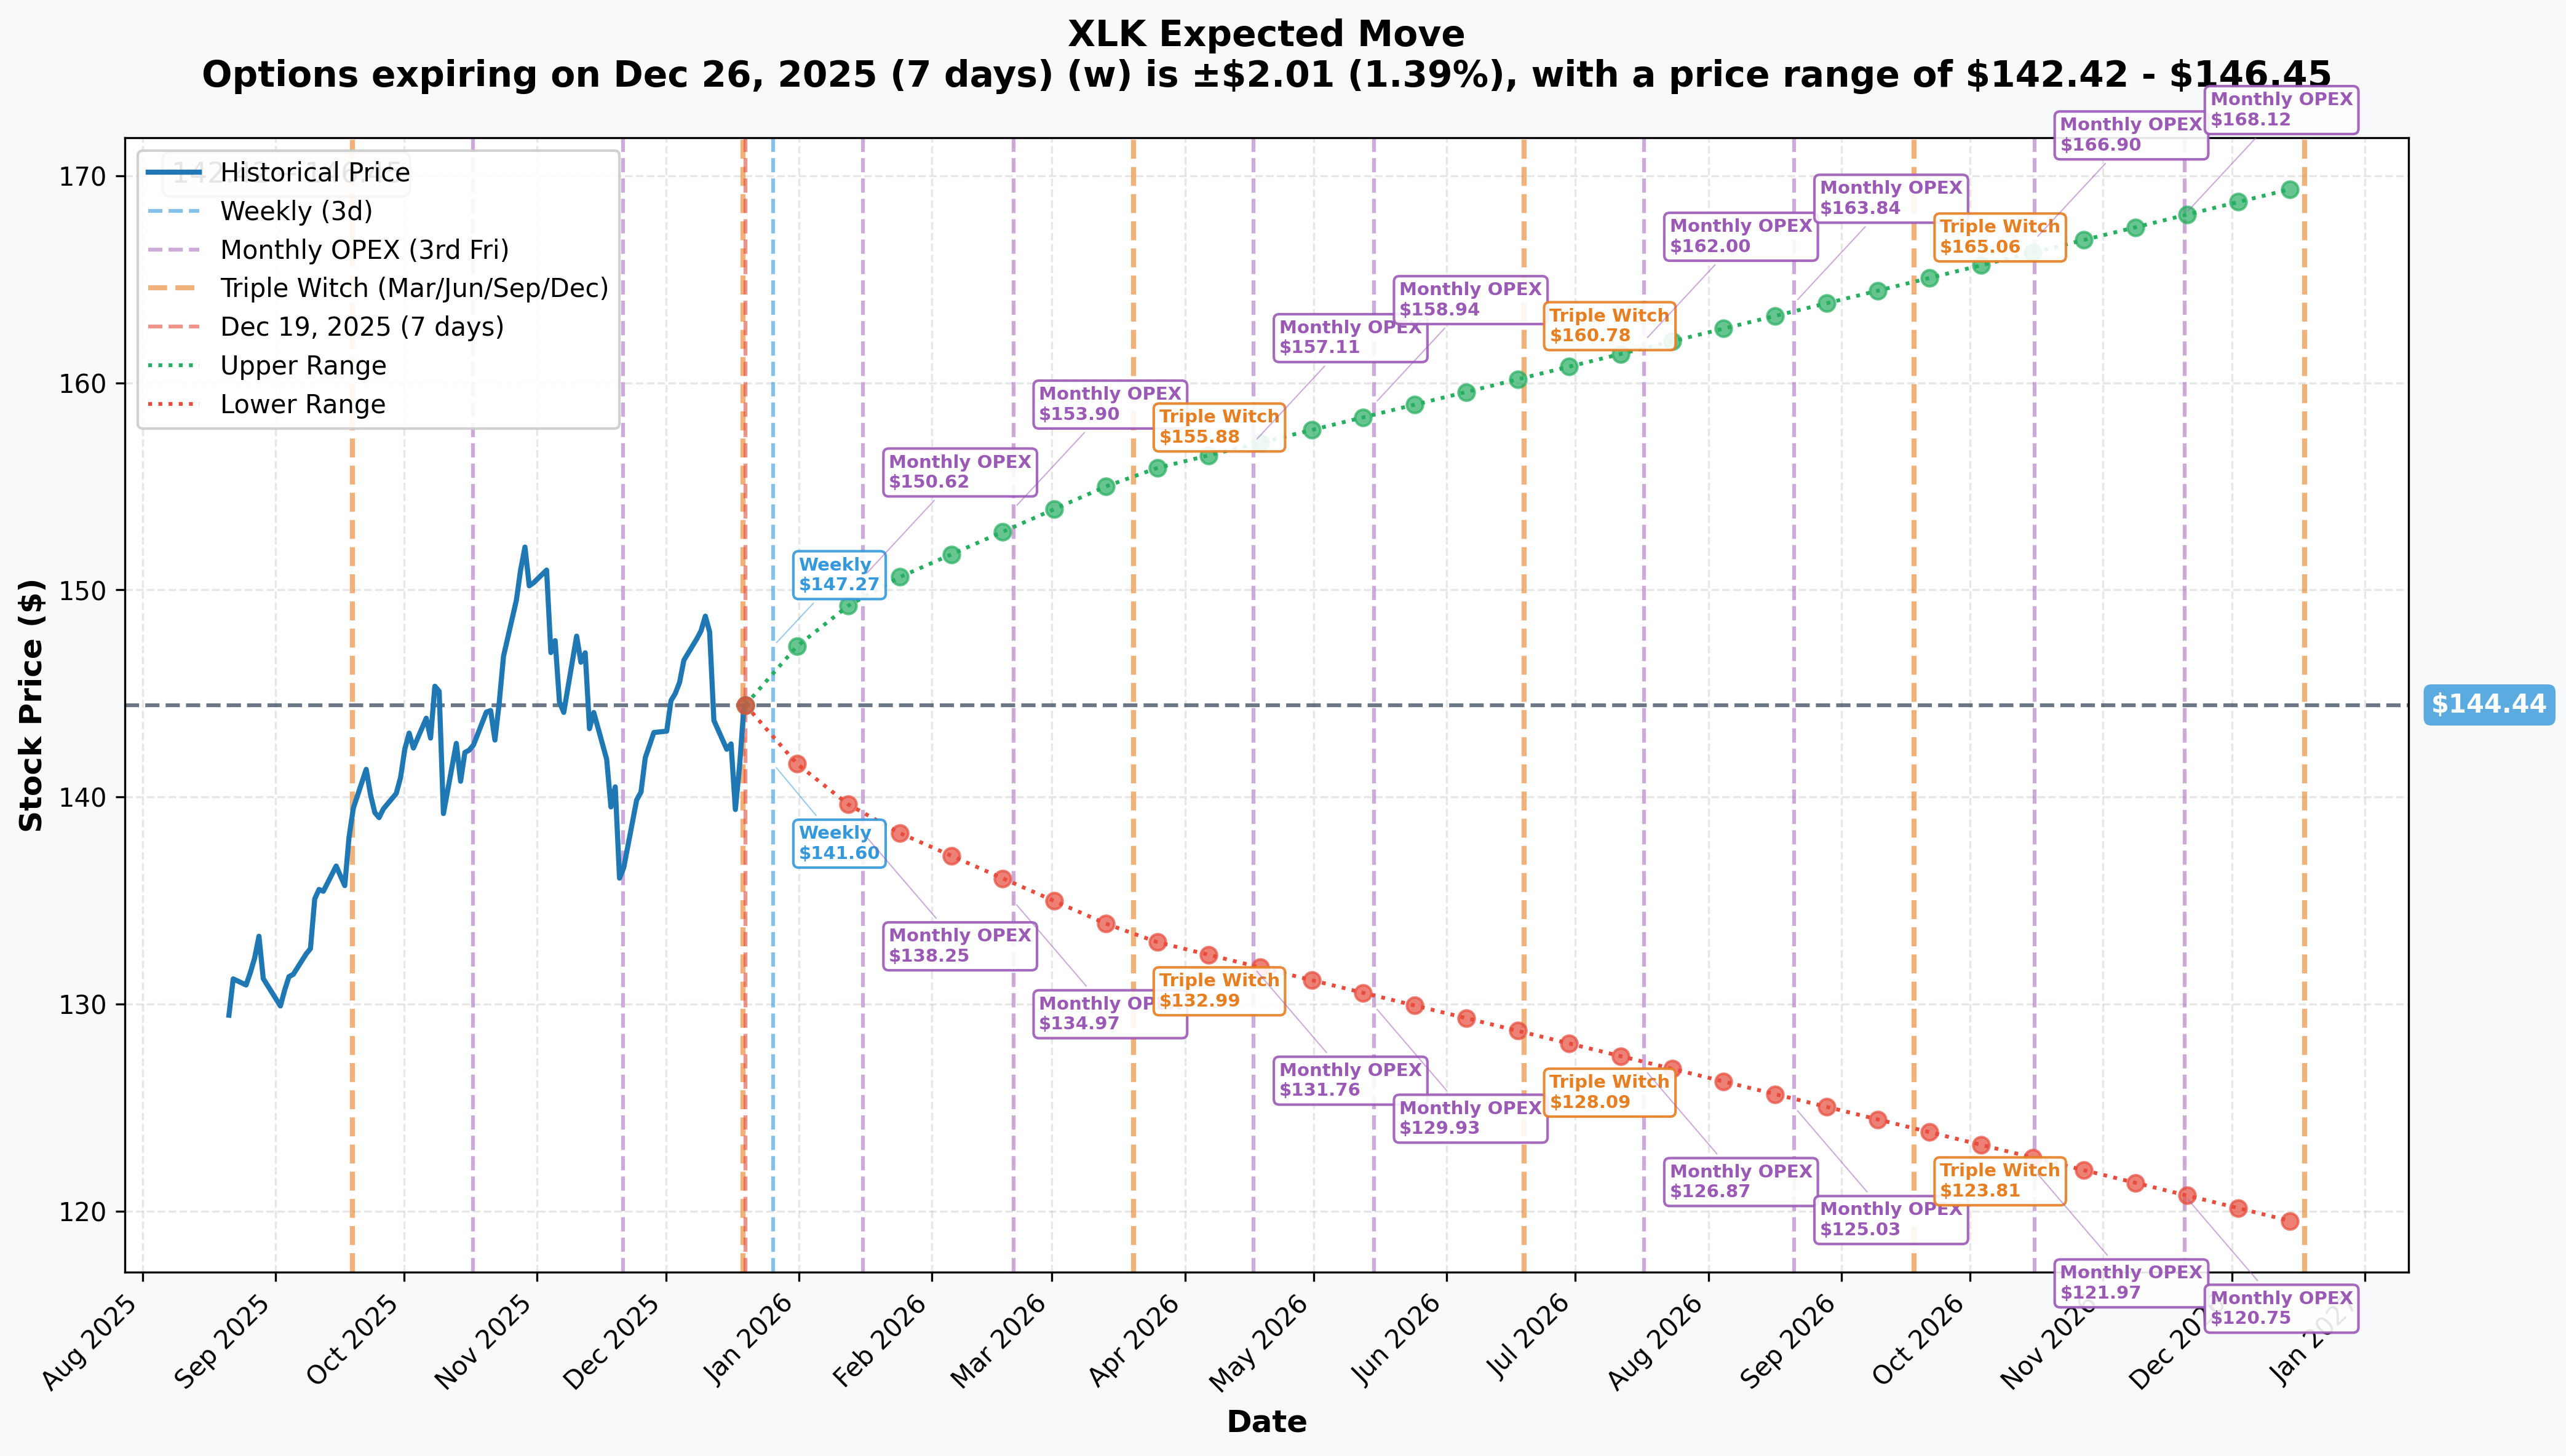
What Options Are Pricing In:
- 📅 Weekly (Dec 26): ±1.39% ($142.42 - $146.45)
- 📅 Monthly OPEX (Jan 16): ±3.78% ($138.98 - $149.89)
- 📅 June 2027 Expiration: ±17.39% (18-month timeframe)
Here's the Catch: The implied move for June 2027 is roughly ±17.39%, which would put the range at approximately $119-169. The $145 strike is RIGHT IN THE MIDDLE of where options expect XLK to be trading. By selling the $145 call, this institution is betting tech stays in the lower half of that range or just grinds sideways.
Key Insight: With XLK at $144.36 and the June 2027 call sold at $145, breakeven is probably around $158-163 (strike + premium received). The seller is confident tech won't gain more than 10-13% over 18 months - a bold statement given tech's 24%+ YTD performance!
🎪 Catalysts
Upcoming Events (The Make-or-Break Moments)
Apple Q1 FY2026 Earnings - January 29, 2026 📊 Apple (13.28% of XLK) reports December quarter results with consensus expecting $137-138 billion in revenue and $2.65-2.67 EPS [^3_1][^3_6]. Management's October guidance called for 10-12% revenue growth with double-digit iPhone growth [^10_4]. This is THE critical catalyst for XLK in the near term - a miss could send tech lower, validating this short call bet.
CES 2026 - January 6-9, 2026 🚀 Tech's biggest conference features major product launches [^4_2]:
- Intel unveils Panther Lake chips (Core Ultra Series 3) promising 50% faster performance [^4_3]
- Qualcomm expected to debut Snapdragon X2 Elite laptop chips [^4_4]
- AMD CEO Lisa Su presents chip roadmap [^4_7]
- Samsung showcases AI-driven home appliances [^4_5]
If announcements underwhelm, it could dampen tech enthusiasm. If they impress, could create short-term rally pressure against this trade.
Microsoft Azure Capacity Expansion - Q1 FY2026 ☁️ Microsoft (11.74% of XLK) expects to remain capacity constrained through H1 FY2026, with Azure projected to deliver ~37% constant-currency revenue growth in Q1 FY2026 [^7_6]. Azure brought in $75 billion in FY2025, up 34% YoY [^7_2]. Continued execution here supports XLK upside, challenging the short call thesis.
NVIDIA AI Infrastructure Build-Out 🔥 NVIDIA (13.86% of XLK - the largest holding) maintains its $3-4 trillion annual AI infrastructure market opportunity projection by 2030 [^12_5]. However, emerging competition from Google's TorchTPU initiative and potential AWS Trainium deals with OpenAI signal diversification away from pure NVIDIA dominance [^12_1][^12_2].
Broadcom AI Chip Demand 💻 Broadcom (6.08% of XLK) just reported AI chip sales surged 74% in Q4 2025, with management projecting AI revenue to double YoY to $8.2 billion in Q1 FY2026 [^11_3][^11_4]. The company sits on a $73 billion backlog for custom chips and data center infrastructure [^11_6].
Already Happened (Context Matters)
Fed Hawkish Pivot - December 18, 2025 ⚠️ The Federal Reserve cut rates by 25 bps to 3.5%-3.75% but dropped a bombshell: the "dot plot" projects just ONE additional cut in 2026 and one in 2027 [^2_2][^2_4]. This hawkish stance increases discount rates for growth stocks, creating headwinds for high-multiple tech names. Tech is particularly sensitive to rate changes given elevated valuations.
Sector Rotation Out of Tech - November 2025 📉 Technology was the worst-performing sector in November, down 4.29% [^14_1]. The Nasdaq declined 1.45% as investors rotated into financials, industrials, and real estate [^14_2]. This validates concerns about tech concentration risk and supports the short call narrative.
Broadcom Post-Earnings Selloff - December 11, 2025 💔 Despite beating estimates, Broadcom stock sold off on margin compression concerns from higher AI revenue mix carrying lower margins [^11_5]. This signals AI monetization challenges even for winners.
Apple Q4 FY2025 Beat - October 31, 2025 ✅ Apple delivered a revenue beat at $102.5 billion (up 8% YoY) with EPS of $1.85 vs. $1.76 consensus [^10_1][^10_2]. Services hit an all-time record $28.8 billion (up 15%), and iPhone revenue reached $49 billion (up 6%) [^10_1]. Management's positive guidance supports near-term tech strength, but the stock hasn't made new highs since.
🎲 Price Targets & Probabilities
Bull Case - Tech Keeps Running 🚀
Target: $152-155 by March 2026
Path There:
- Apple January 29 earnings crush expectations with iPhone 16 AI features driving upgrade cycle
- CES 2026 showcases breakthrough AI PC products that reignite consumer demand [^4_1]
- Microsoft Azure maintains 37%+ growth trajectory, validating $87B run-rate [^7_7]
- Fed delivers the projected one 2026 rate cut by mid-year, easing discount rates
- Tech sector delivers expected 12.4% Q1 2026 earnings growth and 17.8% Q2 growth [^16_1]
Gamma Resistance: The $152.50 level has strong call gamma (4.11M), creating natural resistance. Breaking through would require significant fundamental catalysts.
Probability: 35-40% - Tech fundamentals remain strong (24% YTD gains, 13% expected Q4 earnings growth [^9_1]), but valuations at 38-41x P/E are stretched [^1_2][^17_1]. Fed hawkishness and recent rotation reduce odds.
Impact on Trade: XLK rallying to $152-155 would put this short call under pressure but likely still profitable. At $155, the position would show a loss on the option leg, but if it's covered, the stock gains would offset. This is EXACTLY the scenario the seller planned for - capped upside but collected premium.
Base Case - Sideways Grind 📊
Target: $140-148 range through June 2027
Path There:
- XLK holds current levels with periodic volatility
- Tech continues delivering solid earnings (10-12% growth) but without multiple expansion
- Valuation concerns keep XLK range-bound despite positive fundamentals
- AI infrastructure spending continues ($500B in 2025 to $700B in 2026) but monetization questions persist [^2_5][^9_3]
- Sector rotation continues episodically but tech holds support
- NVIDIA maintains dominance (80-92% AI accelerator market share [^12_3]) but competitive pressures intensify
Support Levels: The $142.50 gamma support (-6.93M) should provide a floor on pullbacks. The $137.50 level (-3.82M) offers secondary support if selling intensifies.
Probability: 45-50% - This is the MOST LIKELY scenario and perfectly aligns with the short call strategy. XLK trading sideways to slightly higher keeps the calls out-of-the-money while the seller collects full premium. The hawkish Fed stance (only one 2026 cut projected [^2_4]) and elevated valuations support range-bound action.
Impact on Trade: IDEAL outcome for the short call seller. Premium collected ($8.5M-11M estimated) represents 10-12% annualized yield on the underlying position over 18 months. If XLK stays below $145, calls expire worthless and seller keeps 100% of premium plus any dividends.
Bear Case - Tech Correction 📉
Target: $130-135 by Q2 2026
Path There:
- Apple January earnings disappoint on weaker iPhone 16 demand or services slowdown
- Fed maintains hawkish stance with NO additional cuts in 2026, pressuring growth stocks
- AI monetization concerns intensify as capital expenditures soar without commensurate revenue growth [^2_5]
- Sector rotation accelerates as industrials surge (18.2% YTD through November vs. S&P 500's 9.5%) [^14_5]
- Margin compression spreads beyond Broadcom as AI revenue mix pressures profitability
- Geopolitical risks escalate (China export restrictions threaten $17 billion NVIDIA revenue [^12_7])
- Valuation multiples compress from 38-41x P/E toward historical averages
Support Levels: The $135 put gamma level (-5.44M) would be the ultimate test, representing about 6.5% downside from current levels. This zone also aligns with the lower end of the monthly implied move range.
Probability: 20-25% - While elevated valuations create vulnerability and the November sector rotation signals risk [^14_1], tech fundamentals remain solid. The sector still expects to contribute 35.6% of S&P 500 earnings while accounting for 44.6% of market cap [^9_2]. A correction of this magnitude would require multiple negative catalysts hitting simultaneously.
Impact on Trade: This is the DREAM scenario for the short call seller. Calls become worthless quickly, full premium captured, and if this is a covered call, they could even buy back the short calls at a profit and sell new ones at lower strikes. Maximum profit achieved with minimal risk of assignment.
💡 Trading Ideas
🛡️ Conservative: "The Watch and Learn"
Strategy: Don't fight institutional money - observe the $145 level closely
Execution:
- ✅ If you own XLK, consider the $145 level as a natural profit-taking zone (institutional resistance)
- ✅ Set alerts at $142.50 (strong gamma support) for potential re-entry if pullback occurs
- ✅ Wait for Apple earnings (January 29) and CES reactions before making directional bets
- ✅ If bearish on tech, buy $140-142 puts for February expiration (~$2-3 per contract) to capitalize on potential earnings volatility
Why This Works: With $10M of short calls creating massive gamma resistance at $145, trying to push through that level is swimming against the institutional tide. Better to work WITH the flow, using $145 as a decision point.
Risk Level: Low - Capital preservation focused with defined risk if using put protection
⚖️ Balanced: "The Copycat with Training Wheels"
Strategy: Replicate a smaller version of this trade if you own XLK or want income
Execution:
- ✅ If you own 100 shares of XLK ($14,436 position), sell ONE June 2027 $145 call against it
- ✅ Collect approximately $14-18 per share premium ($1,400-1,800 total)
- ✅ This caps your upside at $145 (+0.4%) but generates 10-12% return over 18 months if called away
- ✅ Alternative: Sell March 2026 $148-150 calls (4 months out) for $4-6 premium, giving more upside room
Why This Works: You're following the institutional playbook at retail scale. If XLK stays flat or drifts higher slowly, you collect premium income. If it tanks, the premium provides cushion. The only "loss" is if XLK explodes above $160 - but you still profit up to $145.
Position Sizing: Only do this with XLK shares you're willing to sell at $145. Don't use margin for naked short calls unless you have institutional-level risk tolerance.
Risk Level: Medium - Defined maximum gain, undefined opportunity cost if tech rallies hard
🚀 Aggressive: "The Contrarian Breakout Bet"
Strategy: Fade this institutional bearishness by buying calls ABOVE the resistance
Execution:
- ✅ Buy March 2026 $150 calls (3 months out) for approximately $3-4 per contract
- ✅ Position size: Risk only 1-2% of portfolio ($300-800 for a $40-80K account = 100-200 contracts)
- ✅ Thesis: If Apple crushes earnings January 29 and CES delivers positive catalysts, XLK breaks through $145-148 resistance
- ✅ Target: $155-158 by March expiration (7-9% move), which would put calls at $5-8 (50-100% gain)
- ✅ Stop loss: Exit if XLK closes below $142 or after earnings if Apple disappoints
Why This Works (or Doesn't): You're betting the institutional short call seller is WRONG about tech's upside. Tech has delivered 24% YTD gains, and AI infrastructure spending is accelerating ($700B projected 2026 vs. $500B in 2025 [^2_5]). If earnings season ignites momentum, short gamma at $145 could create explosive moves higher as dealers hedge.
The Counter-Argument: You're fighting a $10M institutional position, valuations are stretched (38-41x P/E), the Fed is hawkish, and sector rotation is real. This is PURE speculation that catalysts will overwhelm technicals.
Risk Level: High - This is a lottery ticket. Accept 100% loss if thesis fails, but capped risk makes it acceptable for aggressive traders.
⚠️ Risk Factors
What Could Go Wrong (Let's Be Honest)
For The Short Call Seller:
❌ Tech Explodes Higher on AI Monetization Breakthrough If Microsoft, NVIDIA, or Apple announce massive AI revenue ramps that prove monetization is real (not just spending), XLK could surge to $160-170. The short call seller would cap gains at $145, missing 10-20% upside. Opportunity cost could exceed $10M on a $88M position.
❌ Fed Pivots More Dovish Than Expected If economic data weakens and the Fed delivers 2-3 cuts in 2026 instead of one, growth stocks could rip higher. Lower discount rates expand tech multiples quickly.
❌ Gamma Squeeze Forced Covering If a sudden catalyst drives XLK above $148-150 rapidly, market makers hedging their short calls will buy shares aggressively, creating a feedback loop. The seller could face assignment risk and forced liquidation of their XLK position at unfavorable prices.
For Retail Traders Following This Trade:
❌ Misunderstanding the Strategy Selling naked calls without owning shares is EXTREMELY dangerous. If you're not running this as a covered call, one explosive move can wipe out your account. This isn't a get-rich-quick scheme.
❌ Overconcentration Risk XLK has 38% concentration in just three stocks (NVIDIA, Apple, Microsoft) [^1_4]. A single company-specific event (regulatory action, CEO change, product failure) can move the entire ETF significantly.
❌ Margin Calls and Forced Liquidation If you sell calls on margin and XLK rallies, brokers can force you to close positions at the worst possible time. January is earnings season - volatility will spike, and margin requirements could increase.
Macro Risks Everyone Faces:
⚠️ Valuation Compression At 38-41x P/E, XLK is trading at extreme valuations vs. historical norms [^17_1][^17_2]. If rates stay higher longer or earnings growth slows, multiples could compress violently. A reversion to 28-30x P/E would send XLK to $110-120.
⚠️ China Geopolitical Risks The Trump administration's semiconductor policy allowing some H200 sales to China is unstable [^13_1][^13_2]. Policy reversals could wipe out $17B of NVIDIA revenue overnight [^12_7].
⚠️ AI Bubble Concerns If the market decides AI infrastructure spending ($700B projected 2026) won't generate returns for years, a sentiment shift could trigger broad tech selling. The November rotation already hints at this [^14_1].
⚠️ Apple Regulatory Pressure App Store policies face global regulatory scrutiny. A forced revenue-sharing change could crater the $100B+ Services business that's growing 15% annually [^10_1].
🎯 The Bottom Line
Real talk: This $10M short call trade is institutional money telling us they don't expect tech to rally more than 0.4% over the next 18 months. That's a BOLD statement given XLK's 24% YTD performance, but it's backed by $88M of capital and sophisticated risk management.
The Bull Case: Tech fundamentals are strong - 13% expected Q4 earnings growth [^9_1], Azure at $75B+ revenue growing 37% [^7_6], NVIDIA dominating 80-92% of AI chips [^12_3], and Apple's Services hitting records [^10_1]. The AI infrastructure build-out is multi-year and real [^9_3]. CES 2026 and January 29 Apple earnings could ignite momentum.
The Bear Case: Valuations are stretched (38-41x P/E vs. S&P 500's ~21x), the Fed is hawkish (only one 2026 cut projected [^2_4]), sector rotation is accelerating (tech down 4.29% in November [^14_1]), and AI monetization remains unproven. Net outflows of $138M over five days signal institutional profit-taking [^5_1].
What To Do:
If You Own XLK: Mark your calendar for January 29 (Apple earnings) and watch the $145 level closely. Consider taking some profits if XLK approaches $150 - that institutional short call seller isn't wrong about resistance. The $142.50 support is your re-entry zone if you get shaken out.
If You're Watching: Don't blindly fade this trade. Institutional money has better information and risk management than retail. Use the $145 gamma wall as a key technical level. If XLK breaks convincingly above $148 with volume, the thesis failed and tech leadership continues. If it stalls at $145-147, the seller was right.
If You're Trading Options: This is ADVANCED strategy requiring 18-month commitment. Only sell covered calls if you own shares and are comfortable capping gains. If buying calls to fade this, keep position sizes small (1-2% of portfolio max) and use March/April expiration to capture earnings catalysts without paying for excessive time value.
The Lesson: When institutional money makes a $10M bet against tech upside, they're not gambling - they're expressing a calculated view that valuation, Fed policy, and sector rotation create a ceiling. The next 45 days (through Apple earnings and CES) will tell us if they're right. Buckle up! 🎢
⚠️ Disclaimer: Options trading carries substantial risk and is not suitable for all investors. This analysis is for educational purposes only and does not constitute financial advice. The strategies discussed, particularly selling uncovered calls, can result in unlimited losses. Past performance (including XLK's 24% YTD return) does not guarantee future results. Always consult with a qualified financial advisor and never trade with money you cannot afford to lose. Z-scores and unusual activity do not predict future price movements.
📊 Position Summary:
- Underlying: XLK @ $144.36
- Trade: SELL 6,100 June 2027 $145 Calls
- Premium: ~$10M
- Max Profit: Premium collected (if XLK ≤ $145)
- Max Risk: Unlimited (if naked) / Capped upside (if covered)
- Breakeven: ~$158-163 (strike + premium received per share)
- Days to Expiration: 550 days (18 months)
🔗 Learn More:
Analysis based on trade data from December 19, 2025, 09:44:40 ET. Catalyst research sourced from XLK catalyst report dated December 19, 2025. Gamma levels and implied moves calculated from current market data and subject to change throughout the trading session.