🛒 XLP: Massive $3.9M Put Position Signals Defensive Rotation Ahead!
📅 December 22, 2025 | 🔥 Unusual Activity Detected
🎯 The Quick Take
Someone just dropped $3.9 MILLION on XLP February puts - the largest single trade we've seen on this consumer staples ETF. With 75,000 contracts at the $74 strike, this isn't retail panic - it's institutional money positioning for downside into early 2026. Translation: Big players are hedging their defensive portfolios just as everyone else is rotating INTO staples.
💰 The Option Flow Breakdown
📊 What Just Happened
| Time | Strike | Type | Expiry | Premium | Volume | Action |
|---|---|---|---|---|---|---|
| 10:38 AM | $74 | PUT | Feb 20, 2026 | $3.9M | 75,000 | BUY TO OPEN |
Total Premium Deployed: $3,900,000 💰
🤓 What This Actually Means
Let me break this down - someone paid $0.52 per contract ($52 per share) for the right to sell XLP at $74 by February 20, 2026. With XLP trading at $78.05 when this trade hit, they're buying 5% out-of-the-money puts with 60 days to expiration.
Translation for us regular folks: This is a classic "insurance policy" trade. The buyer is protecting a massive staples position against a potential 5%+ drop through mid-February. At nearly $4M in premium, this could be hedging $80-100M+ in underlying XLP holdings.
What makes this unusual: 🚨
- Volume of 75,000 contracts vs only 6 contracts of existing open interest = 12,500x the typical activity
- Single largest trade we've tracked on XLP in months
- Opens brand new position at the $74 strike
- Timed right after XLP's recent bounce off support
The signal: When institutions hedge this aggressively, they're either:
- Protecting existing long positions from known upcoming risk
- Positioning ahead of market volatility they expect
- Implementing a spread (though we don't see the other leg yet)
Given the timing - right before Fed meetings, earnings season, and tariff developments - this screams "smart money hedging."
📈 Technical Setup
YTD Chart Analysis
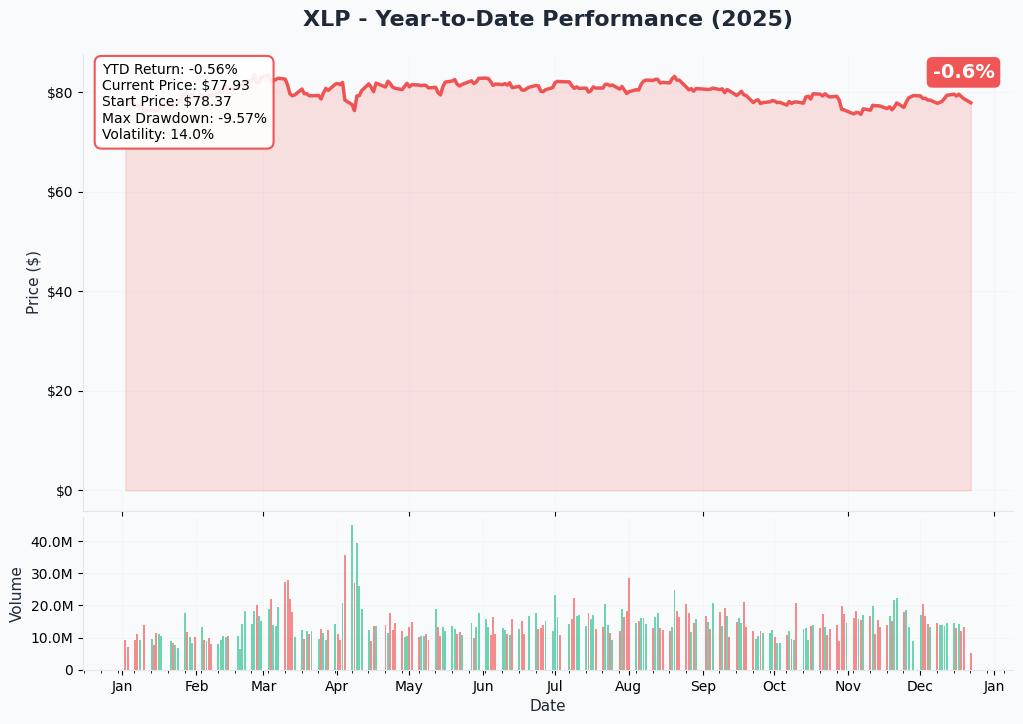
XLP has delivered a modest +2.96% YTD return, significantly underperforming the defensive rotation narrative. The ETF hit a 52-week high of $84.35 back in July before pulling back to current levels around $78.
Key Technical Observations:
- Currently trading in a tight range between $77-79 support/resistance
- Recent pivot top on December 17 triggered a sell signal
- 10-day MA crossed bullishly above 50-day MA on December 2, creating conflicting signals
- MACD flipped bearish in recent sessions
- Trading well below the 52-week high suggests room to fall if defensive rotation reverses
The Setup: XLP is caught between bullish moving average crosses and bearish momentum indicators - a classic indecision zone that often precedes a larger move.
🎯 Gamma-Based Support & Resistance Analysis
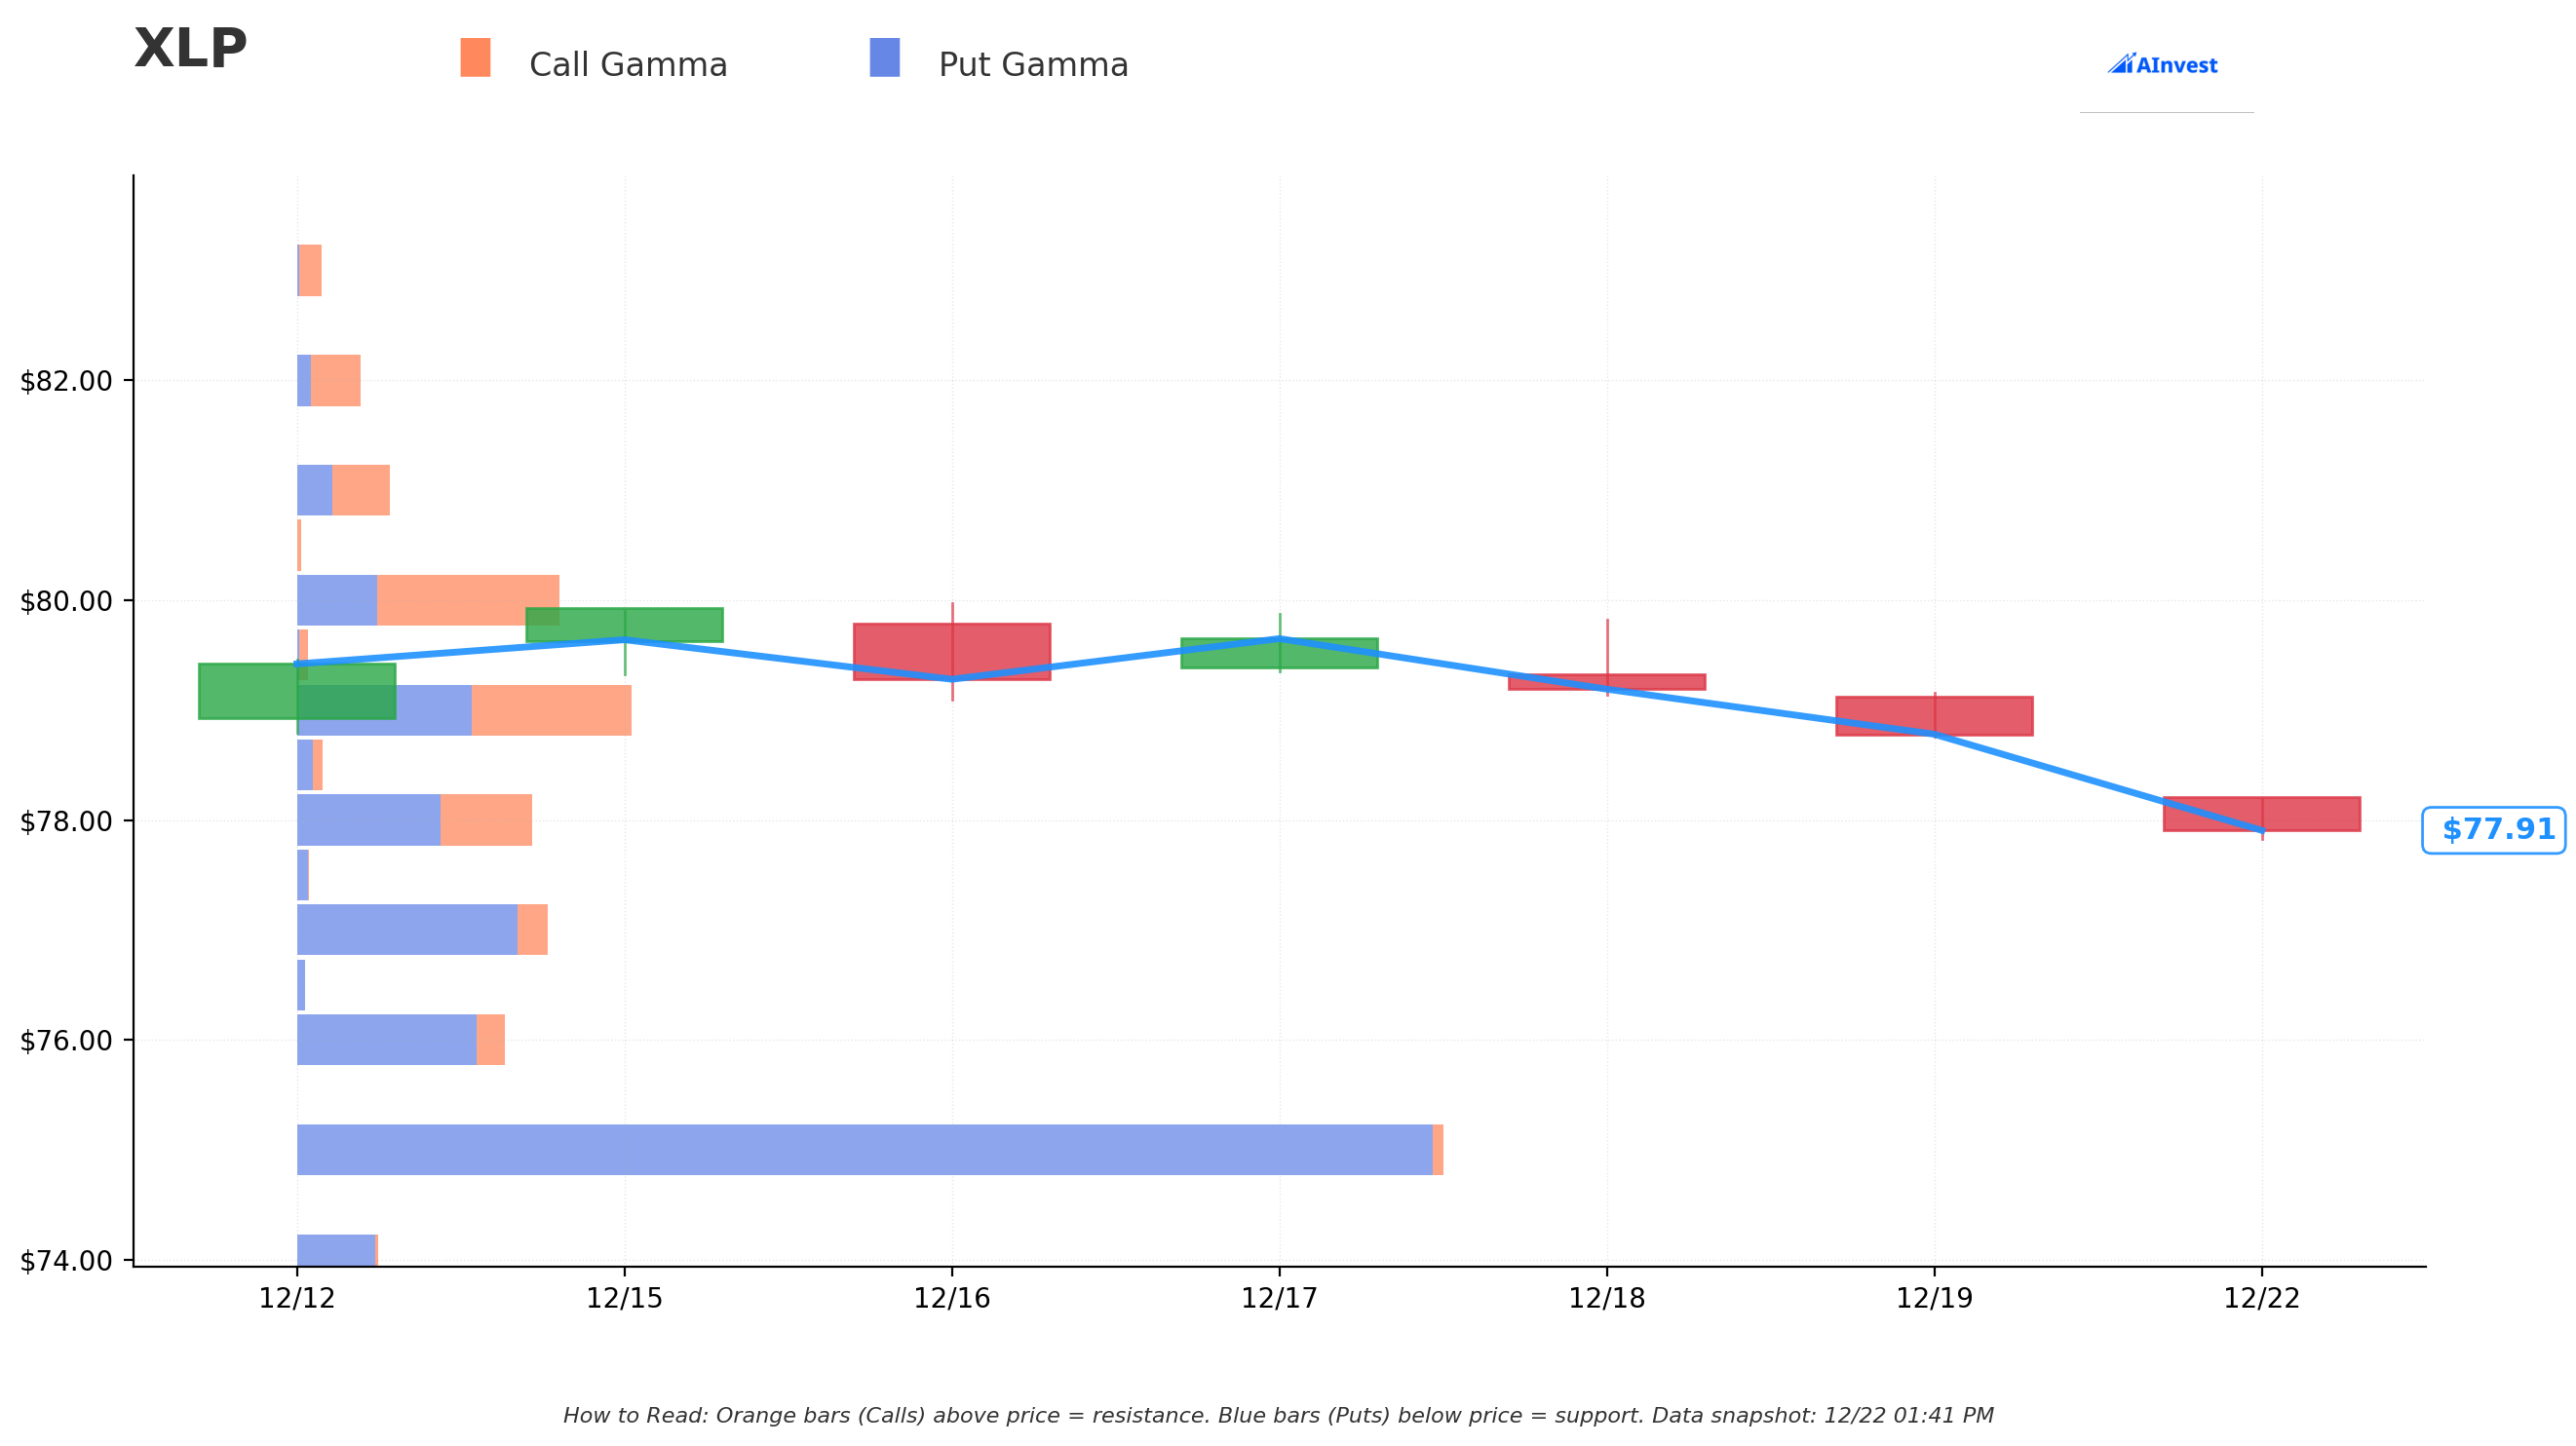
Current Price: $77.92 (as of Dec 22, 2025)
Strong Support Levels Below:
- 🔵 $77 Strike - Massive 12.05M put gamma creates first line of defense (just 1.2% below current)
- 🔵 $75 Strike - THE BIG ONE with 61.94M put gamma - if we break $77, this is where we likely stabilize (3.7% below)
- 🔵 $76 Strike - Secondary support at 9.83M put gamma (2.5% below)
- 🔵 $74 Strike - Where our whale put buyer is positioned with 4.25M gamma (5% below)
Key Resistance Above:
- 🟠 $78 Strike - Immediate resistance with 7.86M put gamma and 5.00M call gamma (just 0.1% above) - current battleground
- 🟠 $79 Strike - Modest resistance at 9.46M put gamma (1.4% above)
- 🟠 $80 Strike - First REAL resistance with 9.90M call gamma overwhelming put gamma (2.7% above)
- 🟠 $81-82 Range - Light resistance at 3.10M and 2.74M call gamma respectively
Net Gamma Bias: BEARISH 💔
- Total Put Gamma: 138.81M
- Total Call Gamma: 39.21M
- Put/Call Gamma Ratio: 3.54x - heavily skewed bearish
What This Tells Us: The gamma profile screams defensive positioning. Market makers are long massive put gamma, meaning they'll need to sell into rallies and buy into dips, creating natural resistance at higher strikes and support at lower strikes. The $75 strike is the gravitational center - if XLP breaks below $77, that's where options dealers will aggressively defend.
Why the $74 put makes sense: Our whale buyer positioned JUST below the major $75 gamma wall. If XLP breaks through that critical support level, the drop to $74 could be swift and profitable.
📊 Implied Move Support & Resistance
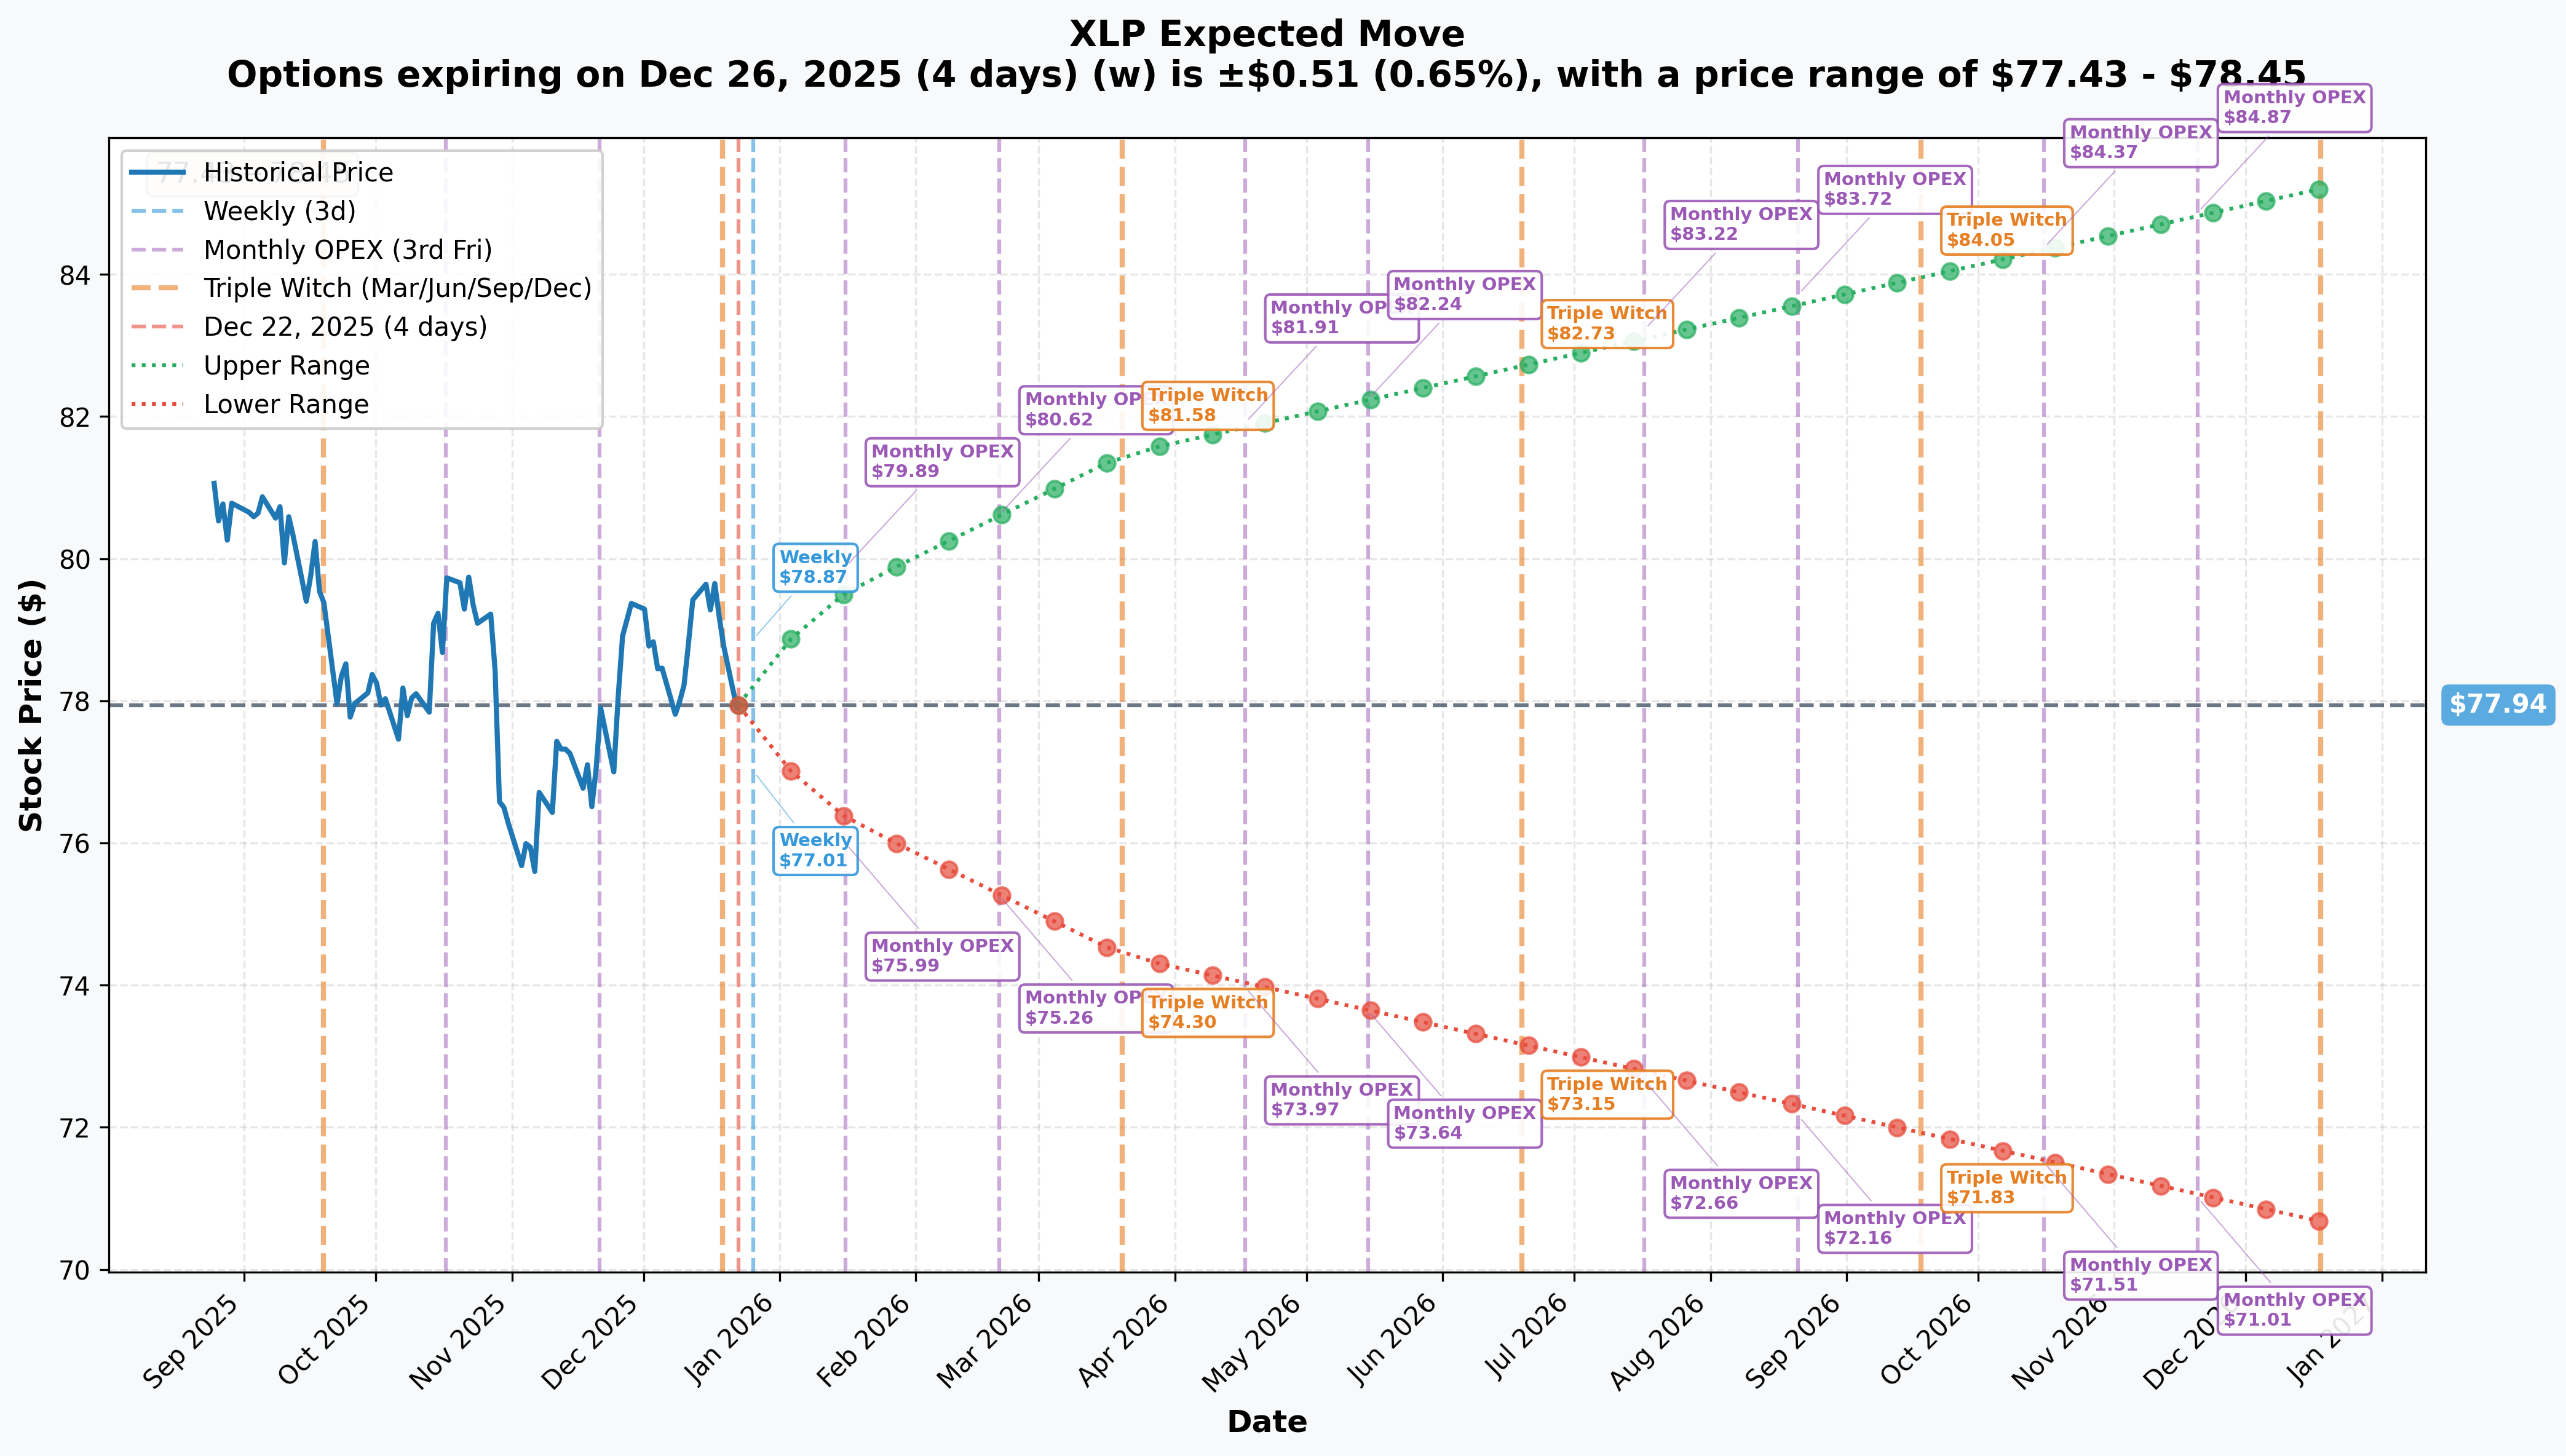
Current Price: $77.94
Key Timeframe Expectations:
Weekly (Dec 26, 2025 - 4 days out):
- Expected Move: ±$0.51 (±0.65%)
- Upper Range: $78.45
- Lower Range: $77.43
- Signal: Market expects XLP to trade FLAT into year-end
Monthly OPEX (Jan 16, 2026 - 25 days out):
- Expected Move: ±$1.61 (±2.07%)
- Upper Range: $79.55
- Lower Range: $76.33
- Signal: This is the critical window for our $74 put buyer
February OPEX (Feb 20, 2026 - exactly when the whale put expires):
- Expected Move: ±$2.68 (±3.44%) (interpolated from chart)
- Upper Range: ~$80.62
- Lower Range: ~$75.26
- Critical Level: The lower end of this range is just $1.26 above the $74 strike
Quarterly Triple Witch (Mar 20, 2026 - 88 days out):
- Expected Move: ±$3.53 (±4.53%)
- Upper Range: $81.47
- Lower Range: $74.41
- Key Insight: The $74 strike sits RIGHT at the bottom of the March expected range
What This Means: The options market is pricing in muted near-term volatility but expanding uncertainty into Q1 2026. Our whale put buyer is positioned for a move that would only materialize if XLP trades toward the lower end of the February expected range - not impossible, but requires a 3%+ selloff from current levels.
Probability Assessment: Based on implied move alone, the $74 strike has roughly a 25-30% probability of being in-the-money by February expiration. The buyer paid $0.52 for puts that would need XLP at $73.48 to breakeven - a 5.7% drop from current levels.
🎪 Catalysts
📅 Upcoming Catalysts (Next 60 Days)
January 22, 2026 - Procter & Gamble (PG) Q1 FY2026 Earnings 🎯
- Weight in XLP: 7.99%
- What to Watch: P&G's earnings call will reveal how the company is absorbing the $1B pre-tax tariff headwind they warned about in fiscal 2026 guidance. Management previously stated consumption trends are "consistently decelerating" for everyday essentials.
- Impact: As a top-3 holding, weak results could drag XLP lower. Prior quarter beat expectations ($1.99 vs $1.90 EPS), but 2026 outlook is clouded by margin pressure.
January 29, 2026 - FOMC Meeting Decision 🏦
- What to Watch: Fed rate decision and economic projections. Market is pricing in 25.5% probability of a cut to 3.25-3.5% range by this meeting.
- Impact on XLP: Rate cuts are bullish for dividend-paying staples, narrowing the current 1.5-point yield disadvantage to Treasuries (XLP yields 2.73% vs 10-year at ~4.2%). However, if Fed holds rates due to sticky inflation, defensive appeal diminishes.
Early February 2026 - Walmart (WMT) Q4 FY2026 Earnings
- Weight in XLP: 11.82% (largest holding)
- What to Watch: Walmart's e-commerce profitability sustainability after hitting milestone in Q1. Prior quarter showed +4.6% comparable sales and +26% e-commerce growth.
- Impact: WMT represents nearly 12% of XLP - any earnings miss would directly pressure the ETF. Trading at 40x earnings (up 25% YTD), expectations are high.
February 20, 2026 - Options Expiration Date
- This is when our $74 put expires. All the action converges here.
Early 2026 - Supreme Court Tariff Ruling ⚖️
- What to Watch: SCOTUS is evaluating the legality of sweeping tariffs under IEEPA. Ruling expected Q1 2026.
- Impact: Favorable ruling could reduce tariff burden for staples companies (PG, PEP, KO all facing margin pressure). Unfavorable ruling locks in high rates and worsens cost structure.
Ongoing - Fed Rate Cut Path for 2026
- What to Watch: Market anticipates two or more cuts in 2026, with Fed's own forecast targeting 3.4% by year-end 2026.
- Impact: XLP saw $1.2B in inflows over the past month as rate cut speculation builds. Dividend growth of 8.68% becomes more attractive as yields compress.
✅ Recent Catalysts (Already Happened)
December 17, 2025 - Technical Sell Signal
- XLP issued a sell signal from pivot top, falling 0.58% since. MACD also flipped bearish.
December 5, 2025 - Stock Split
- State Street executed forward stock split on Select Sector SPDR Funds, increasing shares outstanding and decreasing share price (no impact on total value).
December 2, 2025 - Bullish MA Cross
- 10-day moving average crossed above 50-day MA, creating short-term bullish signal.
October 2025 - Major Holdings Earnings
- PepsiCo (PEP): Beat Q3 with $23.94B revenue but trimmed 2025 guidance to flat core EPS (previously -3%) citing "supply-chain costs driven by tariffs" and "softness in consumer demand."
- Coca-Cola (KO): Beat Q3 with $12.46B revenue, maintaining 5-6% organic growth guidance - relative outperformance vs PepsiCo.
September 2025 - Costco (COST) Record Quarter
- Fiscal Q4 delivered record $86B revenue with +6.4% comparable sales ex-gas/FX. E-commerce grew +13.6%. However, stock is down 6.5% YTD despite strong fundamentals.
July 2025 - Procter & Gamble Fiscal Year Results
- Fiscal 2025 results beat expectations with $1.48 EPS vs $1.42 expected. However, FY2026 outlook included warning of $1B tariff headwind and management noted decelerating consumption trends.
🎲 Price Targets & Probabilities
Bull Case: $80-81 (Defensive Rotation Accelerates) 🚀
Probability: 30%
Scenario: Fed delivers rate cuts in Q1 2026, major holdings (WMT, COST, PG) beat earnings expectations, and Supreme Court limits tariff authority. "Great Rotation of 2025" intensifies as recession fears mount and investors pile into defensive sectors.
Price Target: $80-81 (2.6-3.9% upside from $77.92)
- First resistance at $80 call gamma wall (9.90M)
- Implied move upper range for Feb OPEX: $80.62
- Analyst average target: $89.81 (but that seems overly optimistic given current setup)
What Needs to Happen:
- ✅ Fed cuts rates at January meeting (currently 25% probability)
- ✅ Walmart and P&G report strong earnings with margin expansion
- ✅ Tariff ruling provides relief on cost pressures
- ✅ Consumer spending data stabilizes (no further deterioration)
Gamma Support: Above $80, XLP faces thinner call gamma, potentially allowing momentum toward $82-84 if news flow is extremely positive.
Base Case: $75-77 Range (Consolidation Continues) ⚖️
Probability: 45%
Scenario: Status quo prevails - Fed holds rates but signals cuts ahead, earnings are mixed (some beats, some misses), tariffs remain elevated but don't worsen. XLP continues range-bound trading as defensive rotation stalls out.
Price Target: $75-77 (-1.2% to -0.1% from current)
- $75 is the magnet with massive 61.94M put gamma
- Current price of $77.92 near top of expected range
- Implied move for Feb OPEX: $75.26 - $80.62 (wide range suggests chop)
What Needs to Happen:
- ⚖️ Fed maintains current stance with dovish language
- ⚖️ Earnings are "fine" - no blowouts, no disasters
- ⚖️ Tariff situation remains unchanged
- ⚖️ Market volatility picks up but no directional conviction
Gamma Dynamics: The $75-77 corridor has enormous put gamma (83M+ combined), creating a natural trading range where market makers provide liquidity. Expect mean reversion within this zone.
Bear Case: $72-74 (Defensive Breakdown) 📉
Probability: 25% ⚠️
Scenario: Fed holds rates longer than expected due to sticky inflation, major holdings report disappointing earnings with margin compression from tariffs, and consumer spending data deteriorates further. The "defensive rotation" thesis breaks down as investors realize staples face structural headwinds (GLP-1 drugs, margin pressure, valuation concerns).
Price Target: $72-74 (-5.0% to -7.6% downside from $77.92)
- $74 strike is where our whale put buyer is positioned
- $75 gamma wall MUST break first - this is the critical support
- Below $75, next major support is $72 with 14.73M put gamma
- Implied move lower range for March: $74.41
What Needs to Happen:
- 📉 Fed keeps rates at 4%+ through Q1 citing inflation concerns
- 📉 Procter & Gamble or Walmart report margin compression and cut guidance
- 📉 Consumer spending data shows accelerating trade-down behavior
- 📉 Tariff ruling goes against corporations or new tariffs announced
- 📉 GLP-1 drug adoption data shows faster-than-expected food spending decline
Why the $74 Put Makes Sense Here: If XLP breaks the massive $75 gamma support, there's limited put gamma between $74-75 (just 4.25M at $74). This creates potential for a fast move lower if selling accelerates. The whale buyer is positioned for exactly this scenario.
Catalysts That Could Trigger This:
- PG earnings on Jan 22 disappoint (tariff impact worse than expected)
- WMT reports e-commerce losses or margin pressure
- Fed January meeting is hawkish ("higher for longer" rhetoric)
- Consumer sentiment data deteriorates further (currently down 16 points YoY)
💡 Trading Ideas
🛡️ Conservative: Cash-Secured Put Selling at $75
The Play: Sell Feb 20, 2026 $75 Puts and collect premium while potentially buying XLP 3.7% below current price.
Rationale: The massive 61.94M put gamma at $75 makes this strike a fortress. Market makers have enormous incentive to defend this level, and implied move data suggests $75.26 as the lower bound for February. You're essentially getting paid to potentially buy XLP at a level where options dealers will fight to keep it above.
Execution:
- Sell 1 contract of XLP Feb 20, 2026 $75 Put
- Collect approximately $0.35-0.45 in premium (estimate based on skew)
- Set aside $7,500 in cash as collateral
- Max Profit: Premium collected (~$35-45 per contract)
- Max Risk: Obligated to buy 100 shares at $75 (but you're getting paid to do it)
Who This Works For: Income investors who want XLP exposure anyway and are comfortable buying at $75. You're targeting 4.7-6.0% annualized return on capital (2 months) if XLP stays above $75.
Risk Management:
- If XLP breaks below $76 by early February, consider rolling down to $74 or out to March
- Be prepared to own XLP at $75 - make sure you actually want the position
- Monitor the $77 support level - if it breaks, reassess
⚖️ Balanced: Debit Put Spread (Buy $75 / Sell $72)
The Play: Follow the whale's direction but define your risk with a put spread.
Rationale: The smart money is positioned for downside, but you don't need to pay $3.9M to play. Instead, buy the $75 put (at the major gamma wall) and sell the $72 put (next support level) to reduce cost and define risk.
Execution:
- Buy XLP Feb 20, 2026 $75 Put at ~$1.00
- Sell XLP Feb 20, 2026 $72 Put at ~$0.40
- Net Debit: ~$0.60 ($60 per spread)
- Max Profit: $2.40 per spread if XLP closes below $72 (300% return)
- Max Loss: $0.60 per spread if XLP above $75 at expiration
- Breakeven: $74.40 (roughly where the whale is positioned!)
Position Sizing: Risk 1-2% of portfolio maximum. If you have a $50K account, buy 8-16 spreads (risking $480-960).
Who This Works For: Swing traders who believe the bear case has 25%+ probability and want defined risk. This spread profits if XLP trades toward the bottom of its February implied move.
Exit Strategy:
- Take profits at 50%+ of max gain ($0.30+ profit = close at $0.30 spread)
- Cut losses if XLP rallies above $79 before January earnings (thesis invalidated)
- Consider closing early if PG/WMT earnings are very strong
🚀 Aggressive: Short-Term Put Backspread (Sell 1x $77 / Buy 2x $75)
The Play: Capitalize on the gamma dynamics between $77 and $75 strikes with a directional bet that pays off big if XLP breaks support.
Rationale: The 12.05M gamma at $77 and 61.94M gamma at $75 create a "gamma gap" in between. If XLP breaks through $77, the lack of gamma support means it could fall quickly to $75 or below. This spread is designed to profit from that acceleration.
Execution:
- Sell 1x XLP Jan 16, 2026 $77 Put at ~$0.75
- Buy 2x XLP Jan 16, 2026 $75 Put at ~$0.35 each
- Net Credit: ~$0.05 (nearly free to enter!)
- Max Profit: Unlimited below $74.95 (effectively)
- Max Risk: $1.95 if XLP closes exactly at $75 (unlikely given gamma)
- Breakeven: $75.05 and $76.90**
Position Sizing: Only for traders comfortable with risk. Position size to lose no more than $195 per backspread (1 unit). In a $50K account, maybe 2-4 units max ($390-780 risk).
Who This Works For: Experienced options traders who understand gamma dynamics and can monitor this actively. This is a "smart money copycat" trade with defined risk but requires timing.
Critical Levels:
- ✅ Entry Trigger: Only enter if XLP is trading between $77.50-78.50
- ✅ Profit Zone: XLP breaks below $77 and accelerates to $75 or lower
- ❌ Max Loss Zone: XLP pins exactly at $75 (low probability given gamma)
- ❌ Cut Loss: If XLP rallies above $79 by Dec 31 (early warning)
When to Exit:
- Take full profits if XLP hits $74 or below (you'll be up 150%+)
- Exit early if XLP hasn't broken $77 by Jan 10 (theta decay kicking in)
- Roll or close if Jan earnings from market leaders are surprisingly strong
Why This Works: The gamma profile shows market makers have light defenses between $77-75. Once $77 breaks, their hedging activity (selling into weakness) could accelerate the drop. You're positioned to profit from that dynamic with minimal upfront cost.
Advanced Variation: If you're super aggressive, use the Feb 20 expiration (same as the whale) instead of January, giving more time for the thesis to play out. But that increases risk if you're wrong.
⚠️ Risk Factors
1. ⚠️ The $75 Gamma Wall is MASSIVE (Key Risk)
The 61.94M in put gamma at $75 is not just a support level - it's a fortress. Market makers who are long this gamma have enormous incentive to defend it. If you're betting on downside, understand that breaking through $75 requires sustained selling pressure - not just a one-day flush.
What Could Go Wrong: XLP bounces off $75 repeatedly (which is actually the higher probability base case), making puts expire worthless while theta decay eats your premium.
Mitigation: Use spreads instead of naked puts to reduce cost basis. Take profits early (50% of max gain) rather than holding for homeruns.
2. 📈 Fed Rate Cuts Could Reverse Defensive Rotation
The entire "defensive rotation" thesis depends on economic uncertainty and recession fears. If the Fed cuts rates in January (currently 25% probability) and signals more cuts ahead, risk assets could rally hard while defensive sectors lag.
Market history shows the S&P 500 rises an average 18% one year following the first cut in non-recessionary environments. If we get a "goldilocks" scenario (soft landing + rate cuts), growth stocks rip and defensive staples get sold.
What This Means for XLP: Current yield of 2.73% becomes more attractive vs Treasuries as yields fall, but growth rotation could offset this. XLP tends to UNDERPERFORM in reflationary environments.
Mitigation: Don't over-allocate to bearish plays. Keep some bullish optionality (maybe a small call position at $80 strike as lottery ticket).
3. 💊 GLP-1 Weight Loss Drug Disruption is Underestimated
This is the silent killer for consumer staples that nobody's fully pricing in yet. Current data shows:
- 14% of U.S. adults already using GLP-1 drugs (Ozempic, Wegovy, Mounjaro)
- 30 million users projected by 2030 (J.P. Morgan estimate)
- GLP-1 users reduced food spending by 11% on average
- Sweet/salty snacks and packaged goods hit hardest (11% lower spending)
Impact on XLP Holdings:
- PepsiCo and Coca-Cola = 6-10% of fund, directly exposed to reduced beverage consumption
- PG's snack brands = vulnerable to habitual snacking decline
- General food consumption pressure across portfolio
Management at Flowers Foods admitted: "I don't think anyone fully understands the long-term implications yet." That's corporate speak for "we're worried but can't quantify it."
What Could Go Wrong: GLP-1 adoption accelerates faster than expected, or spending reduction is more severe than current -11%. Food companies report volume declines that can't be offset by pricing, margin compression accelerates.
Mitigation: This is a multi-year secular trend, not a 60-day catalyst. But it adds to the bear case for staples as a long-term hold. Consider taking profits on rallies rather than buying for dividend growth.
4. 🏛️ Tariff Ruling Could Go Either Way
The Supreme Court ruling on tariff authority expected in Q1 2026 is a binary event:
Bullish Outcome: Court limits tariff authority, existing tariffs get rolled back or reduced. P&G's $1B headwind disappears, margins expand, guidance gets raised.
Bearish Outcome: Court upholds broad tariff powers, potentially opening door for MORE tariffs. The $1B headwind at P&G becomes $1.5B, other holdings face similar pressures.
Current State:
- Average effective tariff rate: 11.2% (highest since 1943)
- Businesses absorbing 51% of costs, consumers bearing 37%
- Pharmaceutical tariffs could hit 200% by late 2026
What Could Go Wrong: The whale put buyer might be positioning for WORSE tariff outcomes, not just current levels. If new tariffs announced before Feb 20 expiration, XLP could gap down.
Mitigation: Watch for Supreme Court case timeline. If hearing scheduled before February, volatility will spike - consider reducing position size or taking profits early.
5. 💰 Major Holdings Trading at Extended Valuations
Valuation Risk:
- Walmart: 40x earnings (up 25% YTD) = priced for perfection
- Costco: 49x earnings (though down 6.5% YTD) = still expensive
- XLP overall: 22.18x P/E vs historical averages
Historical Context: In 2024, consumer staples rose only 12% vs S&P 500's 23% despite being "defensive." XLP has lagged the S&P 500 since 1999 on a risk-adjusted basis.
What Could Go Wrong: If WMT or COST report ANY earnings disappointment, high multiples mean outsized downside reactions. A 5% earnings miss could translate to a 10-15% stock drop, dragging XLP materially lower given their 11.82% and 8.92% weightings respectively.
Red Flag: Costco down 6.5% YTD despite record revenue and strong comps. The market is already nervous about valuations.
Mitigation: The January and February earnings from top holdings are critical. If PG misses on Jan 22, strongly consider taking profits on bearish positions before WMT reports. Don't hold through earnings if you're already up 30%+.
6. 📊 Consumer Spending Data is Deteriorating Rapidly
- 75% of consumers trading down in at least one category
- 51% of low-income households trading down on meat/dairy (up from 40% prior quarter)
- Net consumer optimism down 16 points YoY
- P&G CFO: "Consumption trends consistently decelerating" for essentials
The Paradox: This SHOULD be bullish for defensive staples (flight to safety), but margin compression from tariffs + inability to raise prices further creates a profitless prosperity scenario.
What Could Go Wrong: Morgan Stanley forecasts nominal spending growth of only 3.7% in 2025 and 2.9% in 2026, down from 5.7% in 2024. If consumers are trading down to generic brands and clipping coupons, the big CPG brands in XLP LOSE MARKET SHARE to private label.
Real-World Example: Dollar General and Walmart's private label brands are taking share from name brands. XLP holdings (PG, PEP, KO) are the name brands losing volume.
Mitigation: This is already priced into the analyst forecasts (moderate buy rating with tempered targets). But if December retail sales (released mid-January) show worse-than-expected weakness, it could be the catalyst for the $75 break.
7. 🎢 Volatility is VERY LOW Right Now (Hidden Risk)
Implied Volatility Context:
- Weekly expected move: just 0.65% ($0.51)
- Monthly expected move: just 2.07% ($1.61)
What This Means: The options market is pricing in VERY low volatility for an ETF that just saw massive unusual activity. Either:
- The market is WRONG and volatility is about to spike (good for put buyers)
- The market is RIGHT and XLP just grinds sideways (theta decay crushes put buyers)
What Could Go Wrong: If you buy puts into low implied volatility, you need a BIG move to profit. A 3% drop might not be enough to overcome theta decay if it happens slowly over 60 days.
Mitigation: Use spreads to reduce vega exposure. The debit put spread benefits from downside regardless of IV changes. The backspread actually WANTS volatility to spike.
🎯 The Bottom Line
Real talk: This $3.9M put position is institutional-grade hedging, not speculation. Someone with deep pockets and deep research is protecting a massive staples portfolio against Q1 2026 risks.
The Signal vs The Noise:
🐋 What the whale sees (bearish 25% probability):
- $1B tariff headwinds hitting P&G margins in fiscal 2026
- GLP-1 drug adoption accelerating faster than consensus
- Consumer spending data deteriorating (75% trading down, net optimism down 16 points)
- Fed keeping rates higher for longer (current 4.2% Treasury yield vs 2.73% XLP yield)
- Major holdings trading at 40-49x earnings = vulnerable to any disappointment
- Supreme Court tariff ruling could go against corporations
📊 What the technicals show (neutral-to-bearish):
- Massive $75 put gamma wall = strong support but also key break level
- Current price at $77.92 is RIGHT AT resistance with $78 strike holding 12.86M total gamma
- Net gamma bias 3.54x bearish (138M put / 39M call)
- Implied move suggests $75-81 range for Feb OPEX = wide range, no conviction
- Recent MACD sell signal conflicts with bullish MA cross = indecision zone
🎯 What the fundamentals suggest (mixed 45% base case):
- Defensive rotation is REAL but staples are lagging (Healthcare +7.7%, Utilities +3.1%, XLP +4.4% YTD)
- Margin compression from tariffs is confirmed (P&G, PEP both warned)
- Fed rate cuts in 2026 are likely (dovish for staples long-term)
- Analyst consensus: Moderate Buy with $89.81 target (but seems optimistic)
- Sustained outflows (-$1.19B over 1 year) vs recent inflows (+$146M over 5 days) = conflicting signals
🎲 My Take:
The whale is RIGHT to hedge, but the magnitude of the position suggests they're protecting existing longs, not making a directional short bet. The $75 strike is the line in the sand - if XLP breaks below that massive gamma support, the drop to $74 (and possibly $72) could be swift.
For traders, here's your game plan:
If you already own XLP (or staples stocks): ✅ BUY PROTECTION - Follow the smart money and hedge with Feb $75 puts or put spreads. The $0.52 premium on $74 puts is cheap insurance for a position you want to keep long-term.
If you're watching from the sidelines: 👀 WAIT FOR THE BREAK - Don't chase puts here. The trade is either:
- Sell puts at $75 and collect premium (conservative income play)
- Wait for XLP to break $77 support, THEN buy the $75/$72 put spread (momentum trade)
If you're aggressively bearish: 🚀 DEFINED RISK ONLY - The backspread or debit spread are the only ways to play. Buying naked puts into 0.65% weekly IV is theta suicide. You need the break to happen in the next 30 days or time decay wins.
Mark your calendar:
- 📅 January 22 - P&G earnings (first test of tariff impact)
- 📅 January 29 - FOMC meeting (rate decision + forward guidance)
- 📅 Early Feb - Walmart earnings (12% of fund, 40x P/E = high stakes)
- 📅 February 20 - Put expiration and judgment day
The setup is there. The catalyst timeline is clear. The risk/reward is defined. Now we wait to see if the $75 fortress holds or crumbles.
⚠️ Disclaimer: This analysis is for educational purposes only and should not be considered financial advice. Options trading involves substantial risk of loss and is not suitable for all investors. The author may or may not have positions in XLP or related securities. Past performance does not guarantee future results. Always consult with a licensed financial advisor before making investment decisions.
Analysis based on option flow data from December 22, 2025. Gamma levels and implied move data subject to change as market conditions evolve. Catalyst information sourced from company filings, financial news, and market research reports cited throughout.