🐻 XYZ Block Inc — $4.6M Deep ITM Put Signals Bear Conviction on Fintech's AI Pivot!
📅 March 13, 2026 | 🔥 Unusual Activity Detected
🎯 The Quick Take
Someone just dropped $4.6 MILLION on a deep in-the-money put on Block Inc (XYZ) — and this isn't a panicked retail move. With the stock already sitting at $59.88 and the strike at $67.5, this put is already worth real money the moment it was bought. The trader either owns a big XYZ position and is locking in downside protection, or they're making a high-conviction bearish bet that Block's AI-first restructuring story falls apart before January 2027. Either way, $4.6M doesn't lie.
📊 Company Overview
Block Inc (XYZ) is the fintech company formerly known as Square, founded by Jack Dorsey. Block operates two major business segments:
- 💳 Square: Merchant payment processing, POS hardware, business software, and financial services for small businesses
- 📱 Cash App: Consumer-facing super-app with 58 million monthly actives — P2P payments, Bitcoin trading, debit card, and short-term lending (Cash App Borrow)
Block also holds 8,692 BTC (~$584M) on its balance sheet, giving the stock a direct Bitcoin beta that most fintech peers don't carry. In February 2026, Block made headlines by announcing a dramatic restructuring — cutting headcount from 10,000+ to under 6,000 (a 40%+ reduction) and framing it as an "AI-first operating model."
- Market Cap: ~$38 Billion
- Industry: Finance Services (SIC: 6099 — Functions Related to Depository Banking)
- Exchange: NYSE
- Current Price: $59.88 (March 13, 2026)
- 52-Week Range: ~$45 – $95+
💰 The Option Flow Breakdown
📊 The Tape — March 13, 2026
| Field | Detail |
|---|---|
| Date | March 13, 2026 |
| Ticker | XYZ |
| Side | MID |
| Buy/Sell | BUY |
| Type | PUT |
| Expiration | 2027-01-15 |
| Premium | $4.6M |
| Strike | $67.5 |
| Volume | 3,000 |
| Open Interest | 1,400 |
| Size | 3,000 |
| Spot Price | $59.88 |
| Option Price | $15.22 |
| Symbol | XYZ20270115P67.5 |
🤓 What This Actually Means
Real talk: this is a big, bold, bearish statement. Here's why this is unusual:
- 💸 $4.6M in premium for 3,000 contracts — that's $1,522 per contract, not a small-timer playing around
- 📊 Vol/OI ratio = 2.1x — volume is MORE than twice the existing open interest, meaning this isn't just rolling an existing position, it's a fresh aggressive entry
- 🎯 Deep ITM immediately: With spot at $59.88 and strike at $67.5, this put is already $7.62 in the money the moment it was purchased — the buyer is paying for real value, not a lottery ticket
- ⏰ January 2027 expiry gives 10 months of runway for the bearish thesis to play out through multiple earnings reports and catalysts
- 📉 XYZ dropped from $66.33 just one week ago (March 6) to $59.88 today — that's a ~10% decline in a single week — and this buyer may be pressing that momentum
🔍 Understanding Deep ITM Puts — The Mechanics
This is the part most articles skip over, so let's break it down. A deep in-the-money put is fundamentally different from a regular OTM speculation. Here's what matters:
Intrinsic Value Right Now: When you buy the $67.5 put with stock at $59.88, you already have $7.62 of intrinsic value locked in. The option was bought at $15.22, meaning $7.62 is intrinsic (real money) and $7.60 is time premium — the extra you're paying for 10 months of duration.
Two interpretations for this trade:
Interpretation 1 — Portfolio Hedge 🛡️ The buyer might own a large XYZ long position (stock, calls, or both) accumulated when XYZ was trading much higher — perhaps near the $80-$95 range over the past year. Buying the $67.5 put at $15.22 means: if XYZ continues crashing, the put gains dollar-for-dollar below $67.5. The downside protection kicks in right now since the stock is already below the strike. This is a sophisticated way to lock in a "floor" on a position that's already underwater.
Interpretation 2 — Outright Bearish Bet 🐻 The buyer believes XYZ goes significantly lower from here and wants to profit from the drop. By buying a deep ITM put instead of an OTM put, they're getting high delta (close to -1.00) — meaning the position moves almost dollar-for-dollar with the stock. This is more like shorting the stock with defined risk (you can't lose more than the premium paid) and a fixed expiry.
Why deep ITM puts instead of just shorting the stock?
- Defined risk — max loss is the $4.6M premium, not unlimited like a short
- No borrow cost or margin requirement of a short position
- Time premium allows for the thesis to play out without needing to be perfectly timed
- January 2027 expiry captures multiple earnings reports and potential catalysts
The breakeven at expiry: Stock needs to be below $67.5 - $15.22 = $52.28 for the buyer to profit at expiration. That's about a 12.7% further decline from today's price.
📈 Technical Setup / Chart Check-Up
YTD Performance
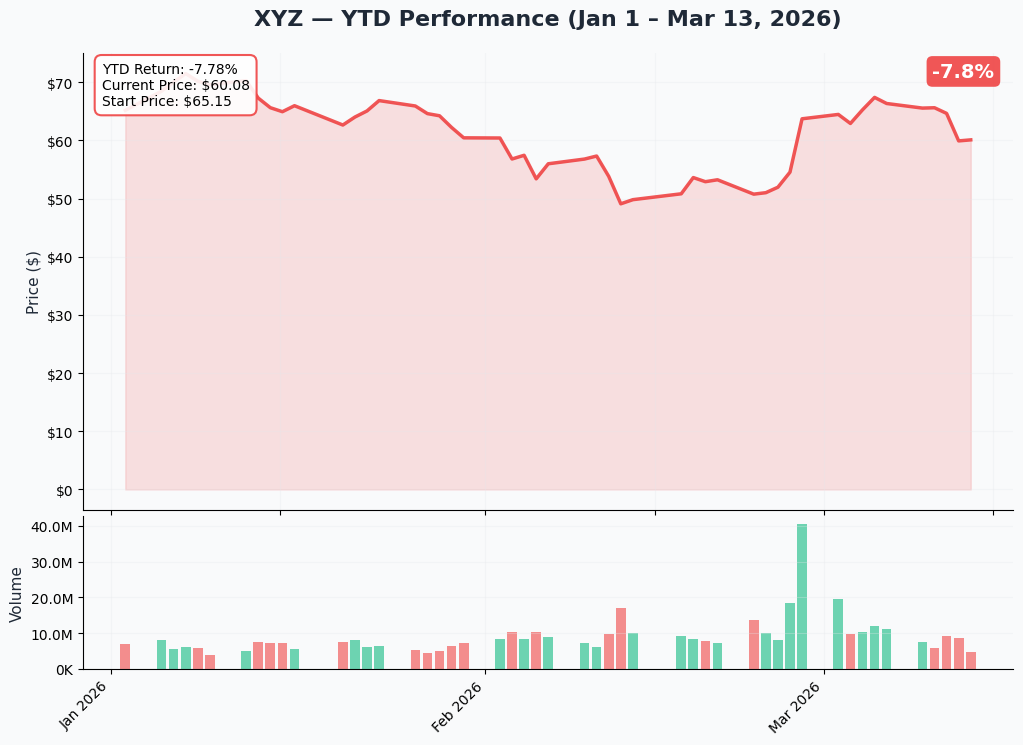
XYZ has been a rough ride in 2026. The stock surged approximately 23% in a single day following the February earnings + restructuring announcement (cutting 4,000+ jobs and projecting AI-powered margin expansion). But that post-announcement spike has completely faded — the stock has given back those gains and then some, now sitting at $59.88 and down roughly 10% in just the past week (from $66.33 on March 6).
Key observations:
- 📉 Post-spike fade: Classic "buy the rumor, sell the news" pattern — restructuring optimism evaporated quickly
- ⚠️ Below recent range: $59.88 is approaching the lower end of the YTD range (~$45-$95 52-week band)
- 🎢 High volatility: Dramatic swings suggest institutional disagreement about Block's execution story
- 👀 Weak relative strength: Underperforming broader fintech sector in early 2026
🔵🟠 Gamma-Based Support & Resistance Analysis
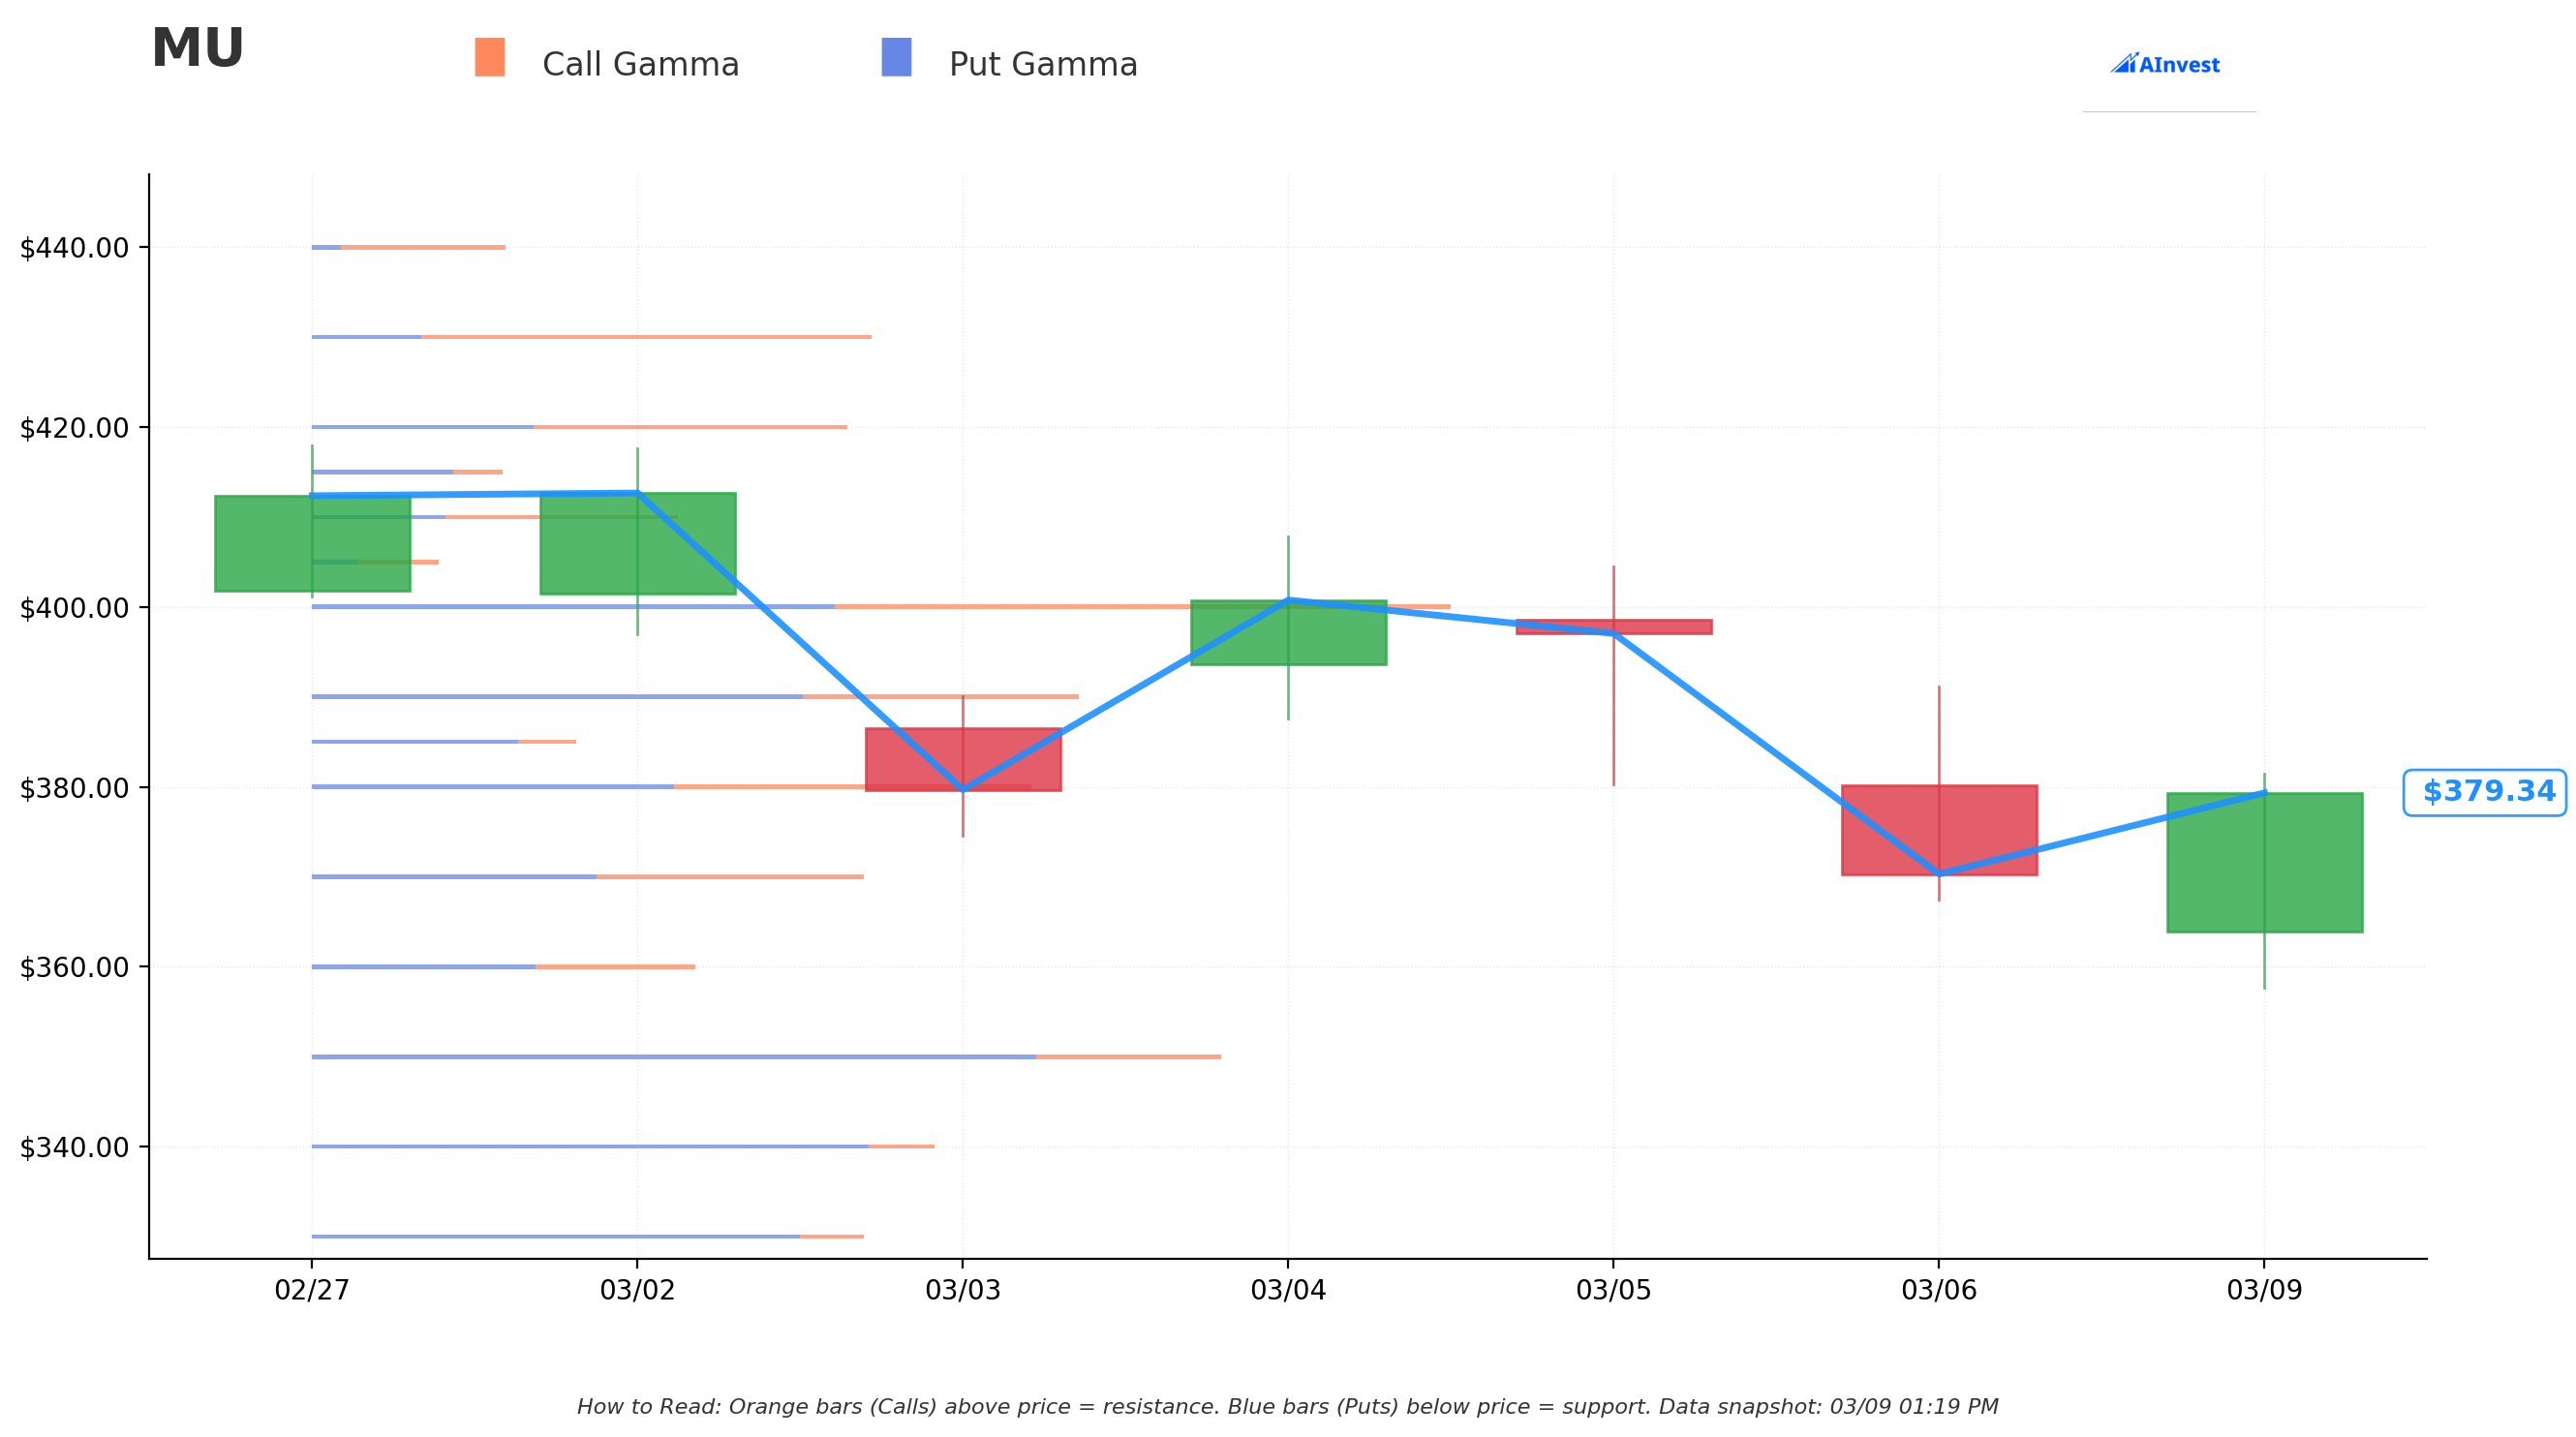
The gamma exposure map tells us where market makers have the largest hedging obligations — and where price tends to get "sticky" or bounce hard.
Current Price: $59.88 | GEX Reference Price: $60.11
Net GEX Bias: Slightly Bullish (total call GEX 42.9 vs put GEX 40.5 — nearly balanced, slight edge to calls)
🔵 Support Levels (Put Gamma = Buying Support Below Price):
| Strike | Total GEX | Distance | What It Means |
|---|---|---|---|
| $60 | 18.2 | 0.2% below | Immediate floor — STRONGEST support level right now |
| $58 | 1.9 | 3.5% below | Secondary support, relatively thin |
| $55 | 10.6 | 8.5% below | Meaningful floor — sizable put gamma here |
| $50 | 1.6 | 16.8% below | Deep support level |
🟠 Resistance Levels (Call Gamma = Selling Pressure Above Price):
| Strike | Total GEX | Distance | What It Means |
|---|---|---|---|
| $61 | 6.9 | 1.5% above | First ceiling — overhead resistance right away |
| $62 | 1.8 | 3.1% above | Light resistance |
| $63 | 2.6 | 4.8% above | Moderate ceiling |
| $65 | 12.2 | 8.1% above | MAJOR resistance — biggest call gamma wall |
| $67 | 1.5 | 11.5% above | Near the put's strike — heavy put open interest here |
| $70 | 5.6 | 16.5% above | Extended ceiling |
What this means for traders: XYZ is sandwiched right at the $60 gamma magnet — the single strongest support level at 18.2 total GEX. The stock literally opened and is trading millimeters above it. Break below $60 convincingly and the next meaningful floor is $55 (8.5% lower). Above, the $65 level is the WALL — 12.2 GEX and the largest call gamma concentration means dealers will sell into any rally back to $65. Notice something? The put was struck at $67.5 — just above the $65 and $67 resistance zones. This buyer clearly doesn't expect XYZ to claw back above $65, let alone $67.5.
Implied Move Analysis
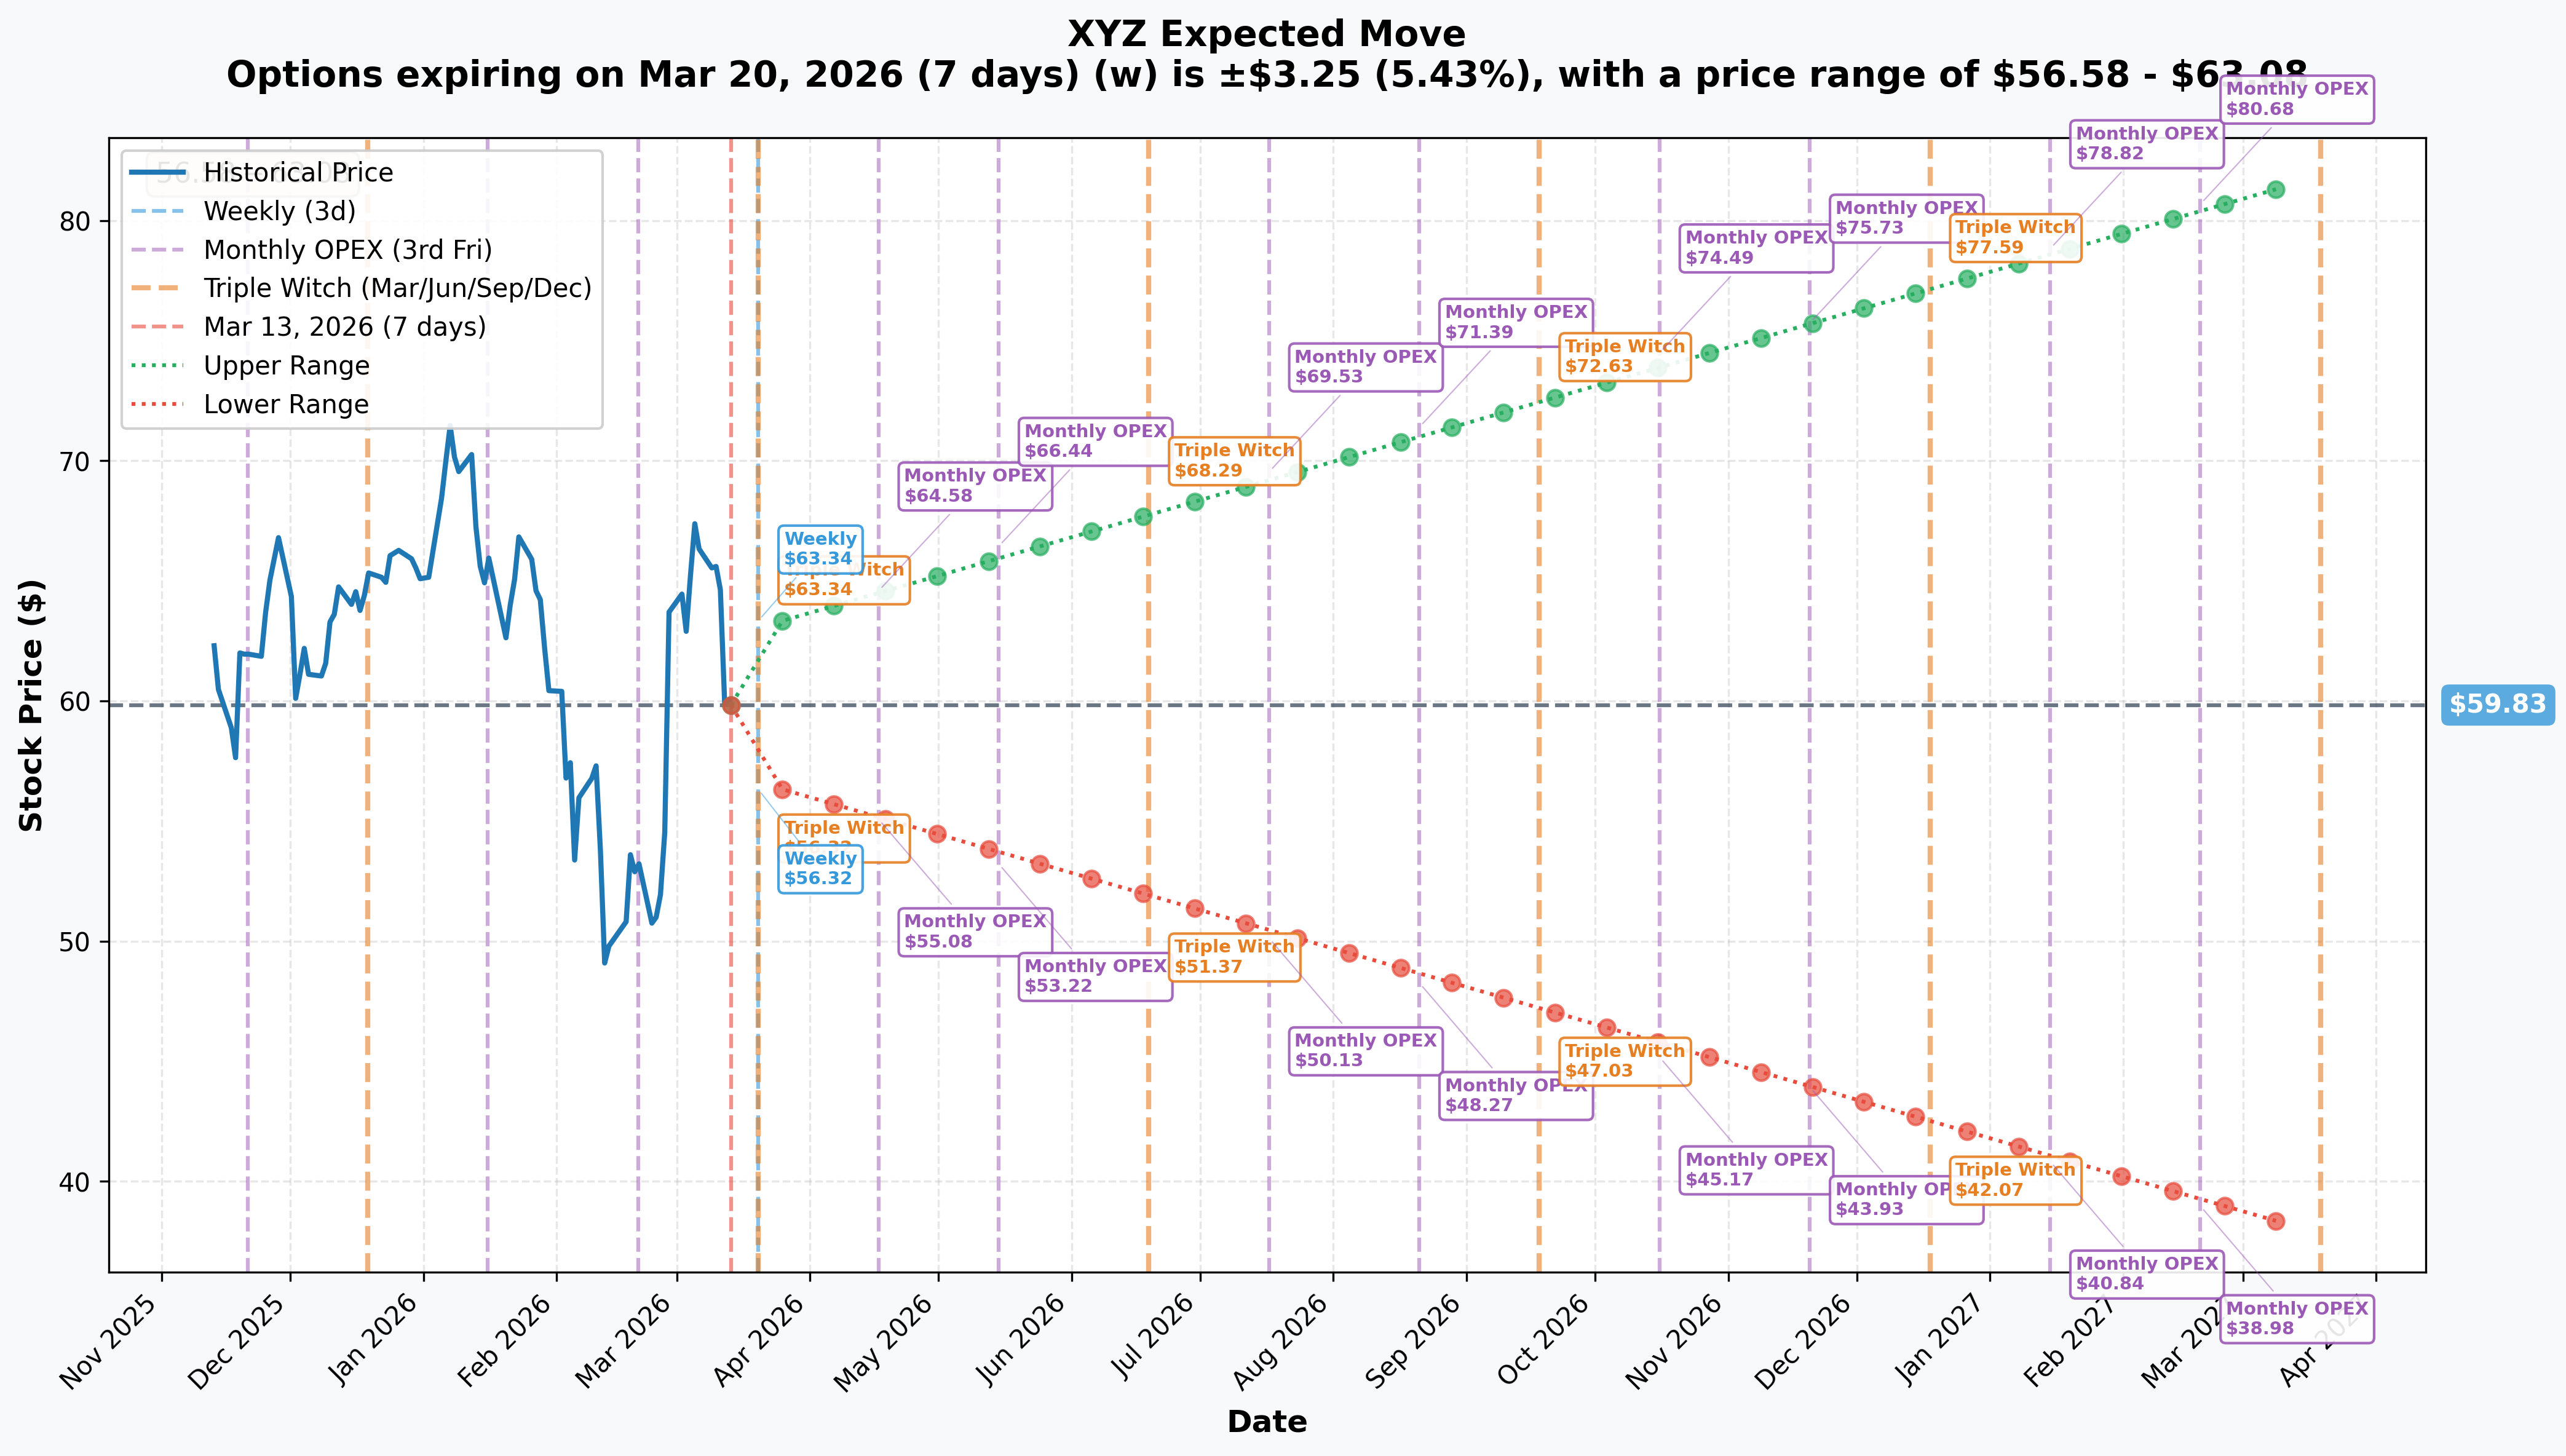
The options market is pricing in these move ranges going forward:
| Timeframe | Expiry | Days | Implied Move | Range |
|---|---|---|---|---|
| Weekly (Mar 20) | 2026-03-20 | 7 days | ±5.4% / ±$3.25 | $56.58 – $63.08 |
| Monthly OPEX | 2026-03-20 | 7 days | ±5.4% / ±$3.25 | $56.58 – $63.08 |
| June Triple Witch | 2026-06-19 | ~98 days | upper $68.29 / lower $51.37 | $51.37 – $68.29 |
| October OPEX | 2026-10-16 | ~217 days | upper $74.49 / lower $45.17 | $45.17 – $74.49 |
| Jan 2027 OPEX (this trade!) | 2027-01-15 | ~307 days | upper $78.82 / lower $40.84 | $40.84 – $78.82 |
| LEAP (Mar 2027) | 2027-03-19 | 371 days | ±36.8% / ±$22.04 | $37.79 – $81.87 |
Translation for regular folks: The market is only pricing a ±5.4% ($3.25) move this week — suggesting near-term calm. But zoom out to the January 2027 expiry of this very trade and the implied range blows out to $40.84 on the downside and $78.82 on the upside. The put's breakeven of $52.28 sits comfortably within the lower half of that range — the options market is saying there's a real probability XYZ visits the low-$40s before January 2027.
The put buyer's key insight: The market-implied lower range for Jan 2027 is $40.84 — well below this put's $67.5 strike. They're positioned for the bear half of what the options market already considers possible.
🎪 Catalysts
🔥 Recent Catalysts (Already Happened)
Q4 2025 Earnings + Massive Restructuring — February 2026 💣
Block dropped a bombshell alongside Q4 earnings: a 40%+ headcount reduction from over 10,000 employees to under 6,000. Jack Dorsey framed this as an "AI-first operating model" — essentially replacing human workers with AI agents.
- 🚀 Stock initially surged 23% on the news (higher profitability targets + cost savings)
- 📉 Then completely faded and reversed — XYZ now below pre-announcement levels
- 📊 2026 guidance delivered: $12.2B gross profit, $3.2B adjusted operating income, $3.66 adjusted EPS (GuruFocus)
- ⚠️ Market reaction suggests investors are skeptical: "great guidance, but can they actually execute while cutting half the workforce?"
Square AI UK Launch — February 2026 🤖 Block launched Square AI in the UK — a free AI assistant for merchants. More of a strategic signpost than a near-term revenue driver. [StockTitan]
Sharp 1-Week Stock Decline — March 6 to March 13 📉 XYZ dropped from $66.33 to $59.88 in just one week — a ~10% plunge with no single announced catalyst. This likely reflects: lingering post-restructuring uncertainty, broader tech/fintech sector rotation, and growing skepticism about execution risk on the aggressive AI headcount swap.
🚀 Upcoming Catalysts (Next 6–10 Months)
Q1 2026 Earnings — Expected Late April/Early May 2026 📊
This is THE crucial next event. It's the first full quarter post-restructuring. Wall Street will be watching:
- 📱 Cash App Monthly Active Users (currently 58M) — are users sticking around or leaving?
- 💳 Square Gross Payment Volume — is merchant business healthy?
- 💰 Adjusted operating income — are cost cuts flowing through to margins yet?
- 🤖 AI tool adoption — is Square AI actually driving engagement?
Any miss against the $12.2B gross profit guidance trajectory would be devastating. [WallStreetZen XYZ Forecast]
Cash App Monetization — Ongoing Catalyst 💳 Cash App has 58 million monthly actives but monetizes them at a fraction of their potential. Premium features (Cash App Borrow, Cash App Card, investing) remain underpenetrated. If growth stalls or monetization disappoints, the bear case accelerates significantly.
Bitcoin Treasury — Wild Card 🟠 Block holds 8,692 BTC (~$584M). Any meaningful Bitcoin bear cycle (BTC below $50K) would hit XYZ's treasury value and crush sentiment around the stock. Conversely, BTC strength above $100K+ would be a meaningful tailwind. This creates a second-order correlation for XYZ that most fintech investors don't fully price in.
AI Restructuring Execution Risk — Next 3–6 Months 🤖 Cutting 4,000+ jobs while maintaining product quality is genuinely hard. If engineering teams shrink too fast:
- Cash App feature development could slow down
- Square merchant support could deteriorate
- Regulatory scrutiny on AI-driven financial services could intensify
Q2–Q3 2026 Earnings — Guidance Reconfirmation 📅 Block management gave ambitious 2026 guidance. Each quarterly beat-or-miss against that $12.2B gross profit target will either validate or destroy the restructuring thesis.
Regulatory Risk — CFPB and Fintech Oversight ⚖️ Cash App has faced scrutiny on P2P payment fraud, money laundering compliance, and financial product disclosures. Any adverse CFPB or state regulatory action would be a significant negative catalyst with immediate stock impact.
Competition — PayPal, Apple Pay, Zelle 🥊 The Cash App moat is real but contested. PayPal's AI reinvention, Apple Pay's growing ecosystem lock, and bank-backed Zelle all compete for the same consumer fintech wallet. Market share data from upcoming quarters will show whether Cash App is holding its 58M user base or leaking to competitors. [MarketBeat XYZ Forecast]
🎲 Price Targets & Probabilities
Using gamma levels, implied move data, catalyst analysis, and analyst consensus, here are the three scenarios through the January 15, 2027 expiration:
Analyst Consensus Context: Average street price target is ~$83–$84 (30 analysts, mostly Buy) with a low target of $51 and high of $100. Current price at $59.88 is 40% below the consensus target — yet the market isn't buying the recovery story, which is itself a bearish signal. [MarketBeat] [Public.com XYZ]
📈 Bull Case (20% probability)
Target: $70–$80
How we get there:
- ✅ Q1 2026 earnings blow past estimates — restructuring delivers margin expansion faster than expected
- 🚀 Cash App monetization inflection — users start adopting premium services at scale
- ₿ Bitcoin rallies to $100K+, creating positive treasury sentiment for XYZ
- 🤖 Square AI adoption gains traction, driving Square GPV growth internationally
- 📊 Sell-side upgrades start flowing as execution concerns ease — price targets move toward $84 consensus
- 🟠 Break above $65 gamma resistance triggers technical rally toward $70 and beyond
For the put buyer: This is the nightmare scenario. Stock climbs back toward $67.5+ and the put bleeds time value. At $70 by expiry, the put is worthless and the full $4.6M is lost. The implied move upper range for Jan 2027 is $78.82 — this outcome is within the options market's probability distribution.
🎯 Base Case (50% probability)
Target: $52–$62 (Rangebound + Slow Bleed)
Most likely scenario:
- ⚖️ Q1 2026 earnings are mixed — cost savings are real but top-line growth disappoints slightly
- 📱 Cash App user growth flatlines around 58–60M, monetization improves slowly but not dramatically
- ₿ Bitcoin stays rangebound ($60K–$85K), neither helping nor hurting XYZ materially
- 🔄 Stock oscillates between the $55 gamma support and $65 gamma resistance for months
- 📊 Gamma magnet at $60 keeps price glued near current levels — the single strongest support level in the gamma map
- ⏰ Multiple quarters of "fine but not great" execution keeps sell-side upgrades on hold
Put buyer's target scenario: Stock slowly drifts from $60 toward $52–$55 over the next several quarters as each earnings report shows the restructuring is harder than advertised. The put builds intrinsic value. At $55, the $67.5 put is worth ~$12.50; at $52, it's worth ~$15.50. The put buyer profits meaningfully without needing a crash.
📉 Bear Case (30% probability)
Target: $42–$52 (Test the Put's Depth)
What could go wrong for Block:
- 😰 Q1 2026 earnings miss materially — restructuring disruption shows up in the numbers
- 🚨 Cash App monthly actives decline below 58M (churn from service degradation)
- ₿ Bitcoin drops to $50K range — treasury loses value, sentiment turns sharply negative on XYZ
- ⚖️ CFPB or state regulatory action against Cash App payments triggers investor exodus
- 📉 Management forced to reduce 2026 guidance — would be catastrophic given premium guidance set
- 💥 Break below $60 gamma floor triggers acceleration toward $55, then $50
- 🔨 Broader fintech sector selloff (rate spike, recession fears) amplifies XYZ weakness
Critical support floors:
- 🛡️ $60 — Strongest GEX support (18.2 total GEX), currently holding
- 🛡️ $55 — Secondary GEX floor (10.6 GEX) — buyers should step in here
- 🛡️ $50 — Deeper support (1.6 GEX, thinner), near analyst low target
- 🛡️ $40.84 — Options-implied extreme lower range for Jan 2027
Put P&L in Bear Case:
- Stock at $52 at expiry: Put worth ~$15.50, profit ~$0.28/share × 300,000 shares = modest gain
- Stock at $45 at expiry: Put worth ~$22.50, profit ~$7.28/share × 300,000 = $2.18M gain (+47%)
- Stock at $40 at expiry: Put worth ~$27.50, profit ~$12.28/share × 300,000 = $3.68M gain (+80%)
- Stock at $35 at expiry: Put worth ~$32.50, profit ~$17.28/share × 300,000 = $5.18M gain (+113%)
💡 Trading Ideas
🛡️ Conservative: Watch the $60 Level and Wait
Play: Stay in cash on XYZ until after Q1 2026 earnings clarity in late April/early May
Why this works:
- 📊 Stock is sitting right on the $60 gamma magnet — the single strongest support level. It could bounce hard from here even if the longer-term story is broken
- 💸 Buying puts right after a 10% weekly decline means you're chasing momentum — rarely the best entry
- ⏰ Q1 2026 earnings (late April) will be the first real data point on whether the AI restructuring is working
- 🎯 If earnings disappoint, you'll get a better put entry at higher IV and lower stock price simultaneously
- 👀 This $4.6M institutional trade is a data point — don't blindly follow it, watch what happens at $60 first
Action plan:
- Monitor for a break below $58 on heavy volume — that signals the $60 floor cracked and next stop is $55
- Watch Q1 2026 earnings closely — any miss vs $12.2B gross profit trajectory validates the bear case
- Only enter bearish positions with conviction after seeing evidence the restructuring is failing
Risk level: Minimal | Skill level: Beginner-friendly
⚖️ Balanced: Put Spread Targeting the $55 Floor
Play: Buy a put spread to profit from further downside while limiting premium cost
Structure: Buy $60 puts, Sell $50 puts — October 2026 expiration
Why this works:
- 🎯 The $65 gamma wall is a confirmed ceiling — stock is unlikely to rally much above $65 in the near term
- 📊 Spread targets the move from $60 (current price) to $50 (deep support) over 7 months
- 💰 Selling the $50 put offsets the cost of the $60 put — defined risk with meaningful upside
- 🔵 The $55 GEX floor (10.6 GEX) is meaningful support — using a $60/$50 spread captures that range
- 📅 October expiry captures Q2 and Q3 2026 earnings reports — two chances for the bear thesis to materialize
Estimated P&L:
- 💰 Net debit: approximately $3–4 per spread (i.e., $300–$400 max risk per spread)
- 📈 Max profit: $6 per spread if XYZ below $50 at October expiry (~150-200% ROI)
- 📉 Max loss: $3–4 if XYZ above $60 at October expiry (full debit lost)
- 🎯 Breakeven: approximately $56–$57
Position sizing: Risk no more than 3-5% of portfolio in a single directional bet like this
Risk level: Moderate (defined risk, bearish directional) | Skill level: Intermediate
🚀 Aggressive: LEAP Put — Mirror the Institutional Trade (Scaled Down)
Play: Buy a Jan 2027 put at or near current levels — same structure as the institutional trade, just smaller
Structure: Buy 1–5 contracts of Jan 2027 $65 put — same expiry as the whale trade
Why this could work:
- 🐋 You're literally copying the institutional structure — same expiry, similar strike — but with a fraction of the capital at risk
- ⏰ January 2027 captures Q1, Q2, and Q3 2026 earnings — three separate chances for the restructuring story to crack
- 📊 High delta put (deep ITM) gives near-linear exposure to further downside — moves like the stock but with defined risk
- 🎯 The implied move lower range for Jan 2027 is $40.84 — puts here have room to run if the bear case materializes
- 🐻 Vol/OI of 2.1x on a $4.6M trade suggests real conviction, not noise — smart money agrees with the direction
Critical risks (MUST READ before entering):
- 💸 Deep ITM puts are expensive — you're paying significant time premium that decays every day
- ⚠️ If XYZ recovers toward $67.5+, you lose the entire $4.6M premium on the institutional trade. For your scaled version, same dynamic applies
- 📊 The breakeven at expiry is $52.28 (for $67.5 strike) — stock needs to fall another 12.7% just to break even
- 🔄 Consider scaling in — buy half now, add if/when $60 support breaks convincingly
ONLY attempt this if you:
- ✅ Fully understand ITM put mechanics and delta/theta dynamics
- ✅ Can afford to lose the entire premium paid (real possibility!)
- ✅ Have a clear thesis on WHY the restructuring fails — not just "the trade looks big"
- ✅ Plan to monitor through Q1 2026 earnings in late April
Risk level: High (directional, time-decaying premium) | Skill level: Advanced
⚠️ Risk Factors
Don't get run over by these potential landmines:
-
📊 $60 gamma support is STRONG: The single largest support level in the gamma map sits at $60 with 18.2 total GEX. Market makers are structurally obligated to buy here. This could create powerful short-term bounces that shake out bearish positions before the thesis plays out.
-
📈 Sell-side is 40% above current price: Average analyst target of $83–$84 from 30 analysts vs a current price of $59.88 creates enormous potential for upgrades and re-rating if Block executes even reasonably well. One strong quarterly print could send the stock 20-30% higher and crush this put. [MarketBeat XYZ]
-
₿ Bitcoin wild card cuts both ways: Block's 8,692 BTC holding means XYZ has hidden positive correlation to Bitcoin. If BTC rallies hard toward $100K+, XYZ could significantly outperform fintech peers and push back above $67.5, making the put worthless. You're not just shorting a fintech company — you're also implicitly short Bitcoin sentiment.
-
🤖 AI restructuring could work: The 40% headcount cut is radical, but if Block successfully automates customer service, software development, and compliance with AI agents, margins could expand dramatically and justify the 2026 guidance of $3.2B adjusted operating income. The February 2026 surge (before the fade) showed the market is willing to believe the story when given evidence.
-
🎢 10% weekly decline already happened: Chasing a trade after a 10% drop in one week is dangerous. The $60 gamma support is RIGHT HERE. Mean reversion to $63-$65 would temporarily hurt this put position significantly before any longer-term thesis plays out.
-
⚖️ Regulatory overhang is uncertain timing: Cash App regulatory risk is real, but regulatory actions rarely happen on a convenient timeline. This risk could take years to crystallize — or could blow over entirely — making it unreliable as a near-term catalyst.
-
💸 Time decay on deep ITM puts: Even though this put is deep ITM, the $7.60 of time premium (out of $15.22 total price) decays every day the stock doesn't move. If XYZ stays rangebound at $58-$62 for months, the put slowly bleeds time value. The buyer needs either further downside OR a volatility spike to see meaningful gains.
-
🔄 Hedge vs speculation ambiguity: We don't know if this is a hedge on an existing long position or an outright bet. If it's a hedge, the put buyer may actually be BULLISH on XYZ and just protecting downside — meaning you shouldn't read this as a pure bear signal.
🎯 The Bottom Line
Here's the deal: Someone with serious capital just paid $4.6 million to bet against Block Inc — or at minimum, to protect against further downside through January 2027. The mechanics here are clear: XYZ is already $7.62 below the strike, the put has immediate intrinsic value, and the 10-month runway captures every significant catalyst between now and the next year-end.
What this trade tells us:
- 🎯 The buyer is NOT afraid of the current price — they're positioning for significantly lower levels ($52 and below at expiry)
- 📊 Vol/OI of 2.1x confirms this is a fresh, aggressive entry — not recycled open interest
- ⏰ January 2027 was chosen deliberately to capture Q1, Q2, and Q3 2026 earnings — a thesis play, not a quick trade
- 🐻 The $65 gamma wall and $67 resistance zone align perfectly with the strike — the buyer doesn't expect a recovery above $65, let alone $67.5
If you own XYZ:
- ⚠️ This $4.6M trade is a serious caution flag — not definitive, but worth respecting
- ✅ Consider trimming if you're sitting on gains, especially near the $63-$65 gamma resistance zone
- 📊 Set a mental line in the sand at $58 — the thin secondary support. Break there with conviction and the path to $55 opens up
- 🎯 The restructuring story needs Q1 execution evidence. Don't hold a large position into late April earnings without a clear plan
If you're watching from the sidelines:
- 👀 Late April/Early May 2026 Q1 earnings is the most important near-term event — wait for that before making any directional commitment
- 🎯 A post-earnings move below $58 and toward $55 would be a cleaner entry for bearish positions
- 📈 Alternatively, if Q1 earnings impress and stock holds above $63-$65 with conviction, the bull case toward $75-$84 analyst targets becomes more credible
- 🎢 The implied move range for Jan 2027 ($40.84–$78.82) is enormous — this is a stock with genuine multi-directional potential
If you're bearish:
- 🎯 Patience at $60 gamma support first — don't chase the 10% weekly drop
- 📊 A clean break below $58 (confirmation of $60 support failure) is the bear trigger
- ⏰ Put spreads post-Q1 earnings offer a cleaner risk/reward than LEAP puts purchased pre-earnings at elevated IV
- 📉 Key levels to watch: $60 (now), $58 (secondary), $55 (major floor), $50 (deep support)
Mark your calendar — Key dates:
- 📅 March 20, 2026 — Weekly/Monthly OPEX (Triple Witch), ±$3.25 implied range $56.58–$63.08
- 📅 Late April / Early May 2026 — Q1 2026 Earnings (first post-restructuring data point)
- 📅 June 19, 2026 — Quarterly Triple Witch (implied range $51.37–$68.29 by then)
- 📅 July–September 2026 — Q2 and Q3 2026 Earnings (restructuring execution tests)
- 📅 January 15, 2027 — Expiration of this $4.6M put trade
Final verdict: XYZ is at a genuine crossroads. The restructuring is either Block's greatest strategic move (margin expansion, AI-native efficiency) or a catastrophic execution risk that costs them key talent, product quality, and ultimately market share. The options market is pricing a 37% range over the next year — nearly half of the current stock price. The $4.6M put buyer has placed their bet. Respect the trade. Wait for Q1 earnings. And don't get caught wrong-footed at the $60 gamma magnet.
Protect your capital. The AI restructuring story needs to prove itself — one quarter at a time. 💪
Disclaimer: Options trading involves substantial risk of loss and is not suitable for all investors. This analysis is for educational and informational purposes only and does not constitute financial advice or a recommendation to buy or sell any security. The unusual options activity described may represent hedging activity rather than a directional bet, and should not be interpreted as predictive of future price movement. Past performance does not guarantee future results. Deep in-the-money options involve complex risk/reward dynamics including time decay, intrinsic value, and delta sensitivity. The Vol/OI ratio of 2.1x reflects relative sizing to existing open interest in this specific contract and does not imply the trade will be profitable. Always conduct your own due diligence and consider consulting a licensed financial advisor before trading options. Block Inc's (XYZ) Bitcoin treasury holdings create additional volatility and correlation risks not typical for fintech peers.
About Block Inc (XYZ): Block Inc (formerly Square) operates digital payment and fintech services including Square merchant platforms and Cash App consumer services, with 58 million monthly active users and approximately 8,692 BTC on its balance sheet. Market cap approximately $38 billion on the NYSE.