💎 TSM Massive $27M Short Call - Premium Collection on Semiconductor Giant! 🏦
📅 December 5, 2025 | 🔥 Unusual Activity Detected
🎯 The Quick Take
Someone just SOLD $27 MILLION worth of TSM calls this morning at 10:10:44! This massive short call position sold 6,000 contracts at the $250 strike expiring February 20th, 2026 - collecting huge premium on the world's largest chipmaker currently trading at $299.28. With TSM up near all-time highs after record earnings and the AI boom, smart money is selling upside and betting on consolidation below $250. Translation: Institutional players are cashing in on the rally, collecting fat premiums while expecting TSM to cool off!
📊 Company Overview
Taiwan Semiconductor Manufacturing Company (TSM) is the undisputed leader of the global semiconductor foundry industry:
- Market Cap: $1.52 Trillion (largest semiconductor company in the world)
- Industry: Semiconductors - Manufacturing/Foundry Services
- Current Price: $299.28 (near 52-week high of $311.37)
- Primary Business: World's largest dedicated chip foundry with mid-60s% market share, manufacturing cutting-edge semiconductors for Apple (24% of revenue), NVIDIA (19-21% projected 2025), AMD, and other tech giants using advanced 3nm and 2nm process technologies
💰 The Option Flow Breakdown
The Tape (December 5, 2025 @ 10:10:44):
| Time | Symbol | Side | Buy/Sell | Type | Expiration | Premium | Strike | Volume | OI | Size | Spot | Option Price |
|---|---|---|---|---|---|---|---|---|---|---|---|---|
| 10:10:44 | TSM | BID | SELL | CALL $250 | 2026-02-20 | $27M | $250 | 6K | 40K | 6,000 | $299.28 | $54.90 |
🤓 What This Actually Means
This is a premium collection strategy on a semiconductor giant! Here's the breakdown:
- 💸 Massive premium collected: $27M ($54.90 per contract × 6,000 contracts)
- 🎯 Strike selection: $250 is 16.5% BELOW current price of $299.28 - deeply out-of-the-money
- ⏰ Time to expiration: 77 days provides substantial time decay (theta) working in seller's favor
- 📊 Size matters: 6,000 contracts represents 600,000 shares worth ~$179M at current price
- 🏦 Premium strategy: Collecting $54.90/share on $250 calls when stock trades at $299 = 22% premium capture if held to expiration
What's really happening here: This trader executed a "Sell to Open" (STO) strategy - opening a short call position to collect premium. The classification shows this as a Short Call with MEDIUM confidence, meaning the seller is betting TSM stays below $250 through February 20th. With the stock currently at $299.28, the seller has a massive $49.28 cushion before the calls go in-the-money!
Two likely scenarios:
- Covered Call: Seller owns 600,000 shares of TSM (worth $179M) and is collecting $54.90/share in premium as income, willing to cap upside at $250 (still 16.5% downside protection from current level)
- Naked Short Call: Sophisticated institution selling volatility, betting TSM won't surge above $250 despite the AI boom (riskier but common for large funds)
Unusual Score: 🔥 ABOVE AVERAGE (Z-score: 1.44) - While not extreme, this 6,000-contract trade is notably larger than typical TSM options activity. The Vol/OI ratio of 0.15 shows LOW ACTIVITY relative to existing positions, suggesting this is a strategic new position rather than closing existing trades.
Strategic intent: By selling deep OTM calls at $250 when stock trades $299, the seller is essentially saying: "I don't believe TSM can sustain levels above $250 over the next 77 days. I'll take $27M in cash NOW rather than hope for a 16.5% drop in the stock." This is classic premium harvesting at peak valuations.
📈 Technical Setup / Chart Check-Up
YTD Performance Chart
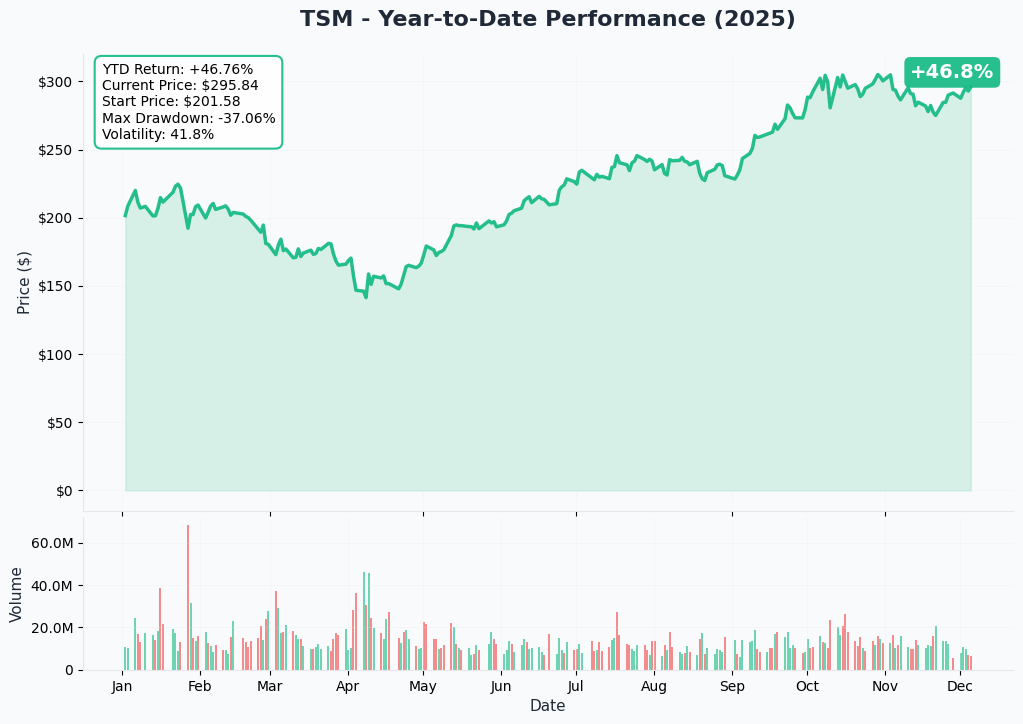
TSM has delivered spectacular returns - currently trading at $292.95 in the 52-week range of $134.25 - $311.37. The stock is up approximately 80% YTD through November 2024, riding the AI infrastructure wave as the critical supplier to both Apple and NVIDIA.
Key observations:
- 🚀 Explosive rally: From $134 lows to $311 highs - one of the strongest runs in mega-cap semiconductors
- 📈 Momentum confirmed: Stock pushed through previous resistance zones, hitting all-time highs above $300
- 💰 Earnings catalyst: Q4 2024 results (reported January 16, 2025) showed 37% YoY revenue growth to $26.88B with 59% gross margins
- 🤖 AI infrastructure play: Advanced node demand (3nm/5nm) representing 74% of wafer revenue, driven by AI accelerators
- ⚠️ Near highs: Currently trading just 5.9% below 52-week high - vulnerable to profit-taking
Gamma-Based Support & Resistance Analysis
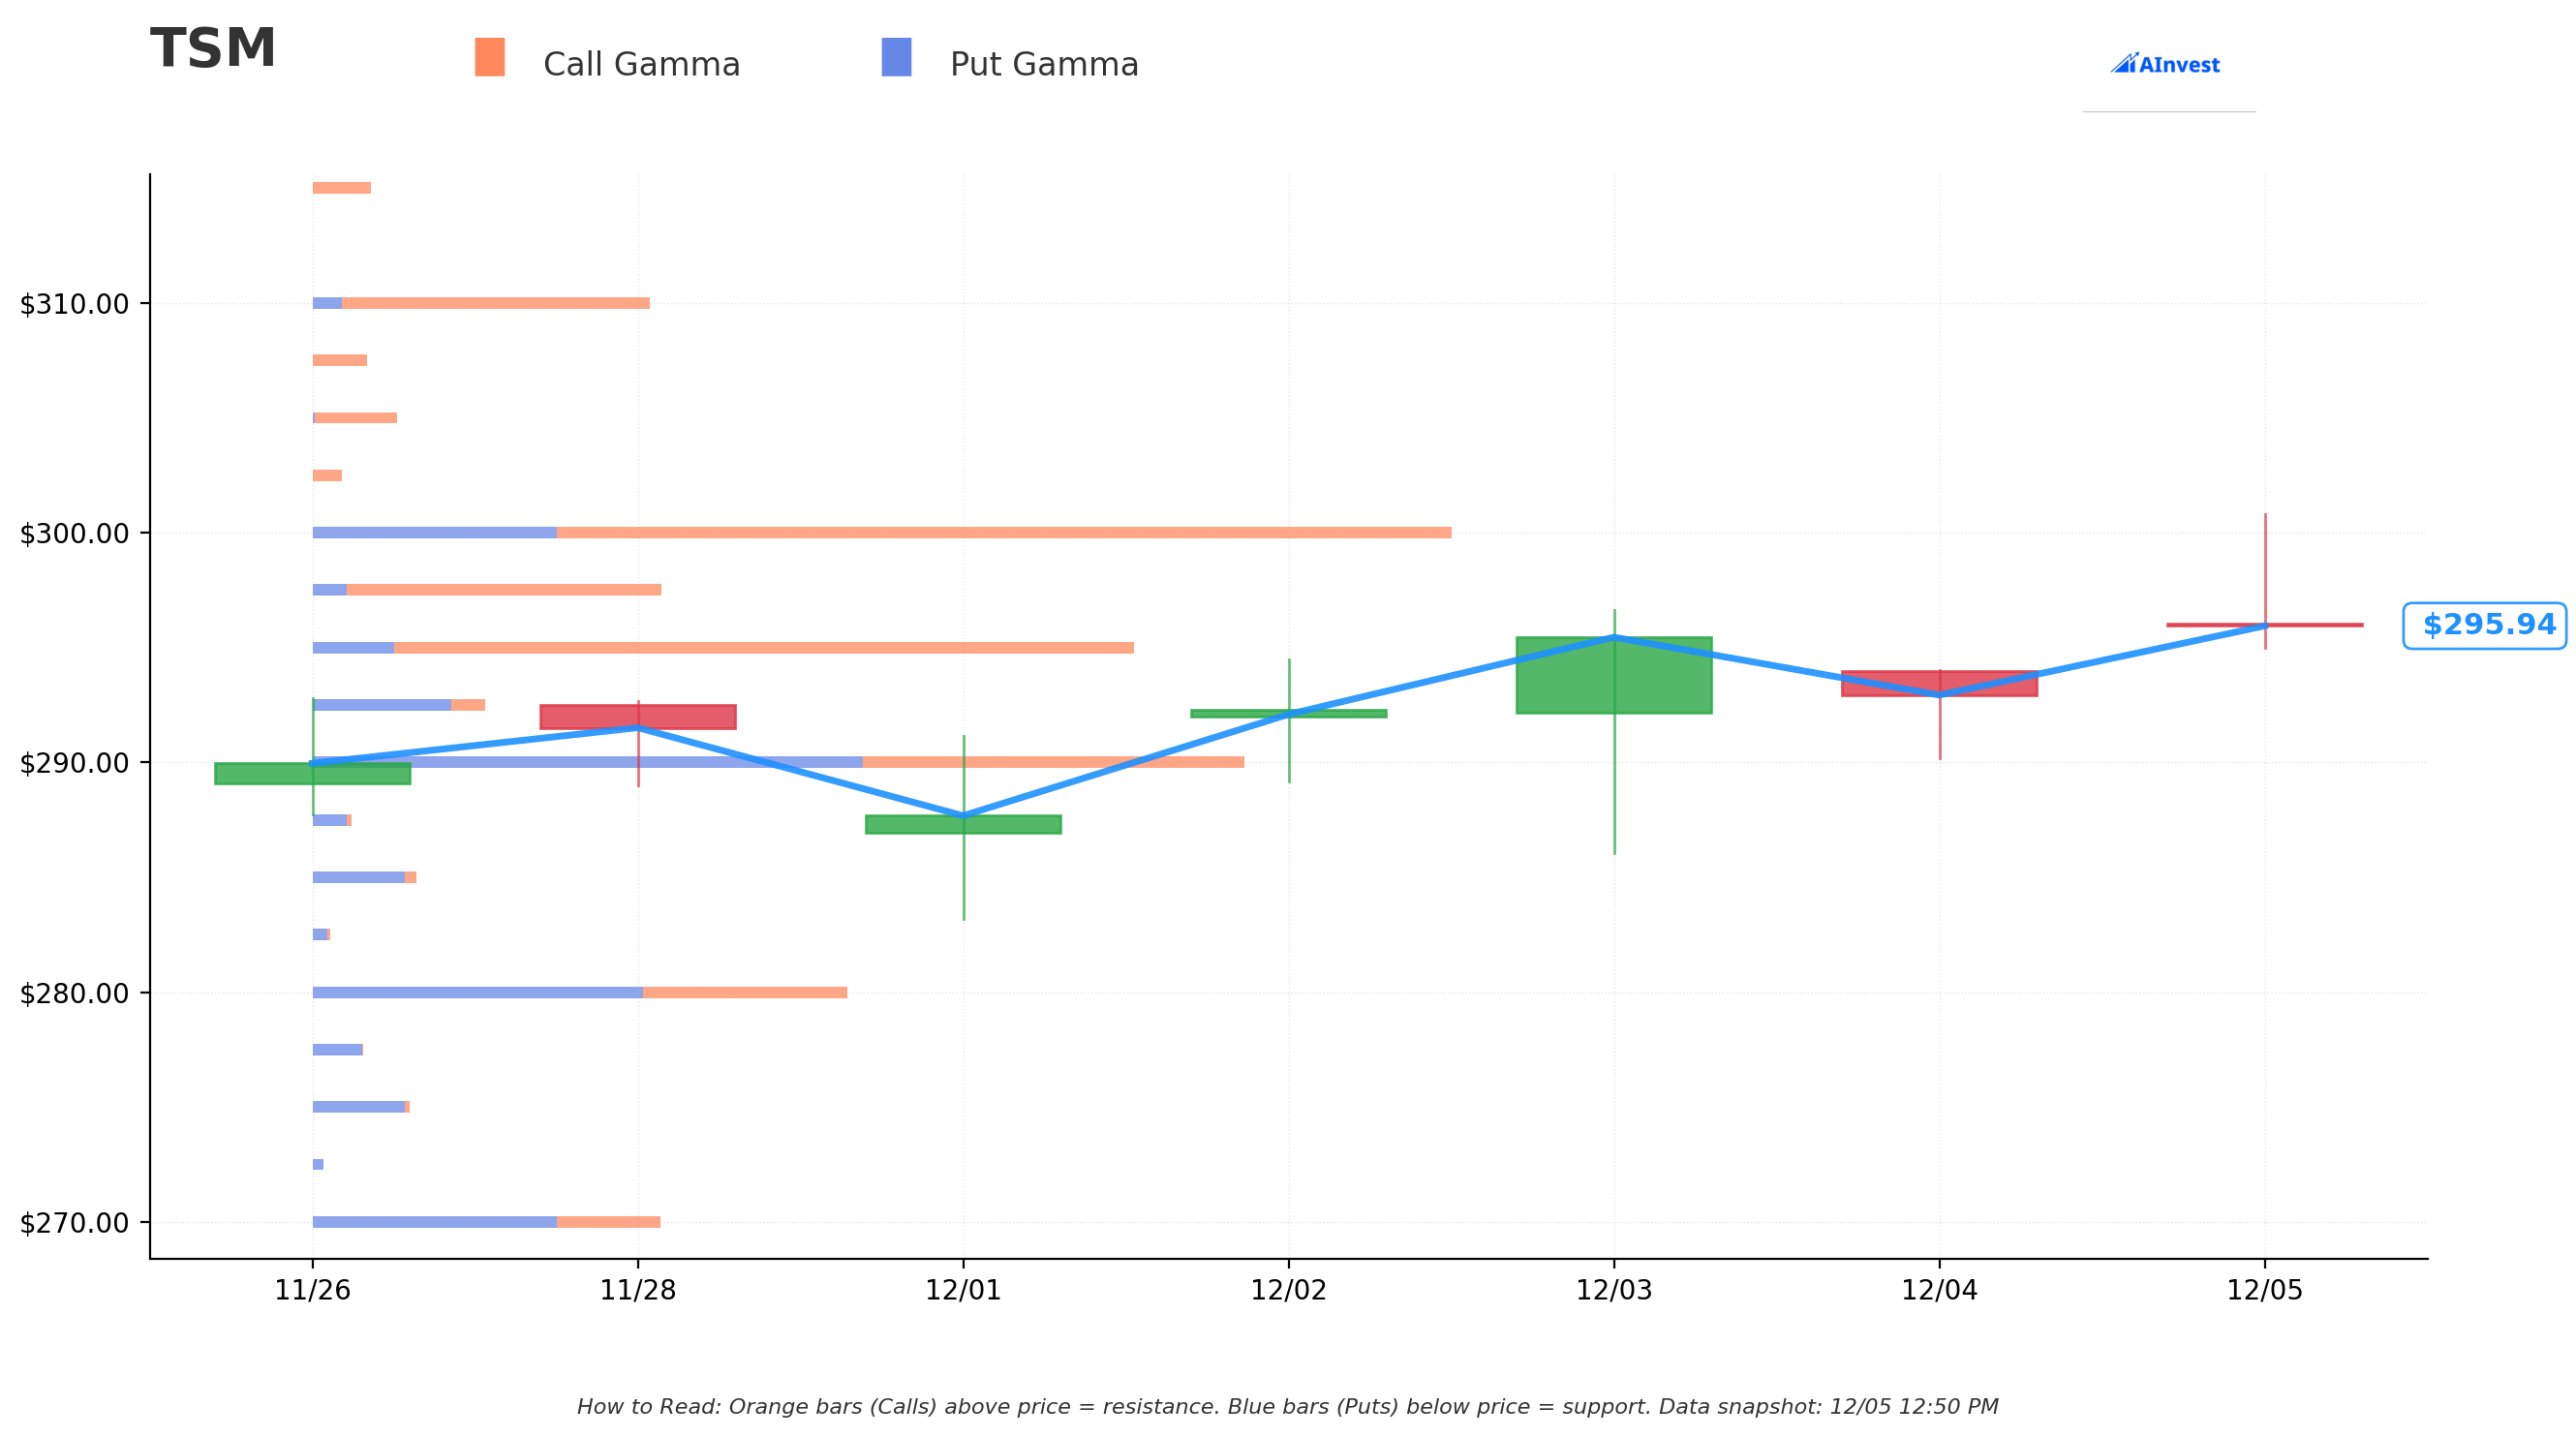
Current Price: $296.04
The gamma exposure map reveals critical price magnets and walls that will govern near-term trading:
🔵 Support Levels (Put Gamma Below Price):
- $295 - IMMEDIATE support with 28.1B total gamma exposure (strongest nearby floor!)
- $290 - Secondary support at 32.0B gamma (2% below current - major accumulation zone)
- $280 - Structural floor with 18.3B gamma (5.4% below - key level if correction deepens)
- $270 - Major support at 11.9B gamma (8.8% below)
- $260 - Deep support at 7.5B gamma (12.2% below)
- $250 - Extended floor at 10.8B gamma (15.6% below - EXACTLY where this call is struck!)
🟠 Resistance Levels (Call Gamma Above Price):
- $297.50 - Immediate ceiling with 12.3B gamma (0.5% overhead - minor resistance)
- $300 - Major psychological and technical barrier with 40.6B gamma (STRONGEST RESISTANCE!)
- $310 - Secondary resistance at 11.6B gamma (4.7% above)
- $320 - Extended upside ceiling at 8.2B gamma (8.1% above)
What this means for traders: TSM is trading in a tight range just below the massive $300 resistance level (40.6B gamma - by far the largest single level). This creates a natural ceiling where market makers will sell into rallies to hedge their positions. The $295 support (28.1B gamma) provides a floor 0.4% below current price, suggesting the stock is in a consolidation zone.
Notice the setup: The call seller struck at $250 where there's 10.8B gamma support and sits 15.6% below current price. This isn't random - they're positioning well below all major support levels, betting the stock won't crash through $290 → $280 → $270 → $260 to reach their strike. That's four major gamma support zones providing cushion!
Net GEX Bias: Bullish (147.7B call gamma vs 93.3B put gamma) - Overall positioning remains bullish with dealers long gamma, suggesting the market expects stability rather than explosive moves. This is PERFECT for premium sellers who want the stock to stay range-bound.
Strategic insight: The $300 resistance at 40.6B gamma creates a natural cap. If TSM can't break above $300-310 over the next 77 days, these $250 calls expire worthless and the seller keeps the full $27M premium. The gamma profile supports a range-bound thesis ($290-310 trading range).
Implied Move Analysis
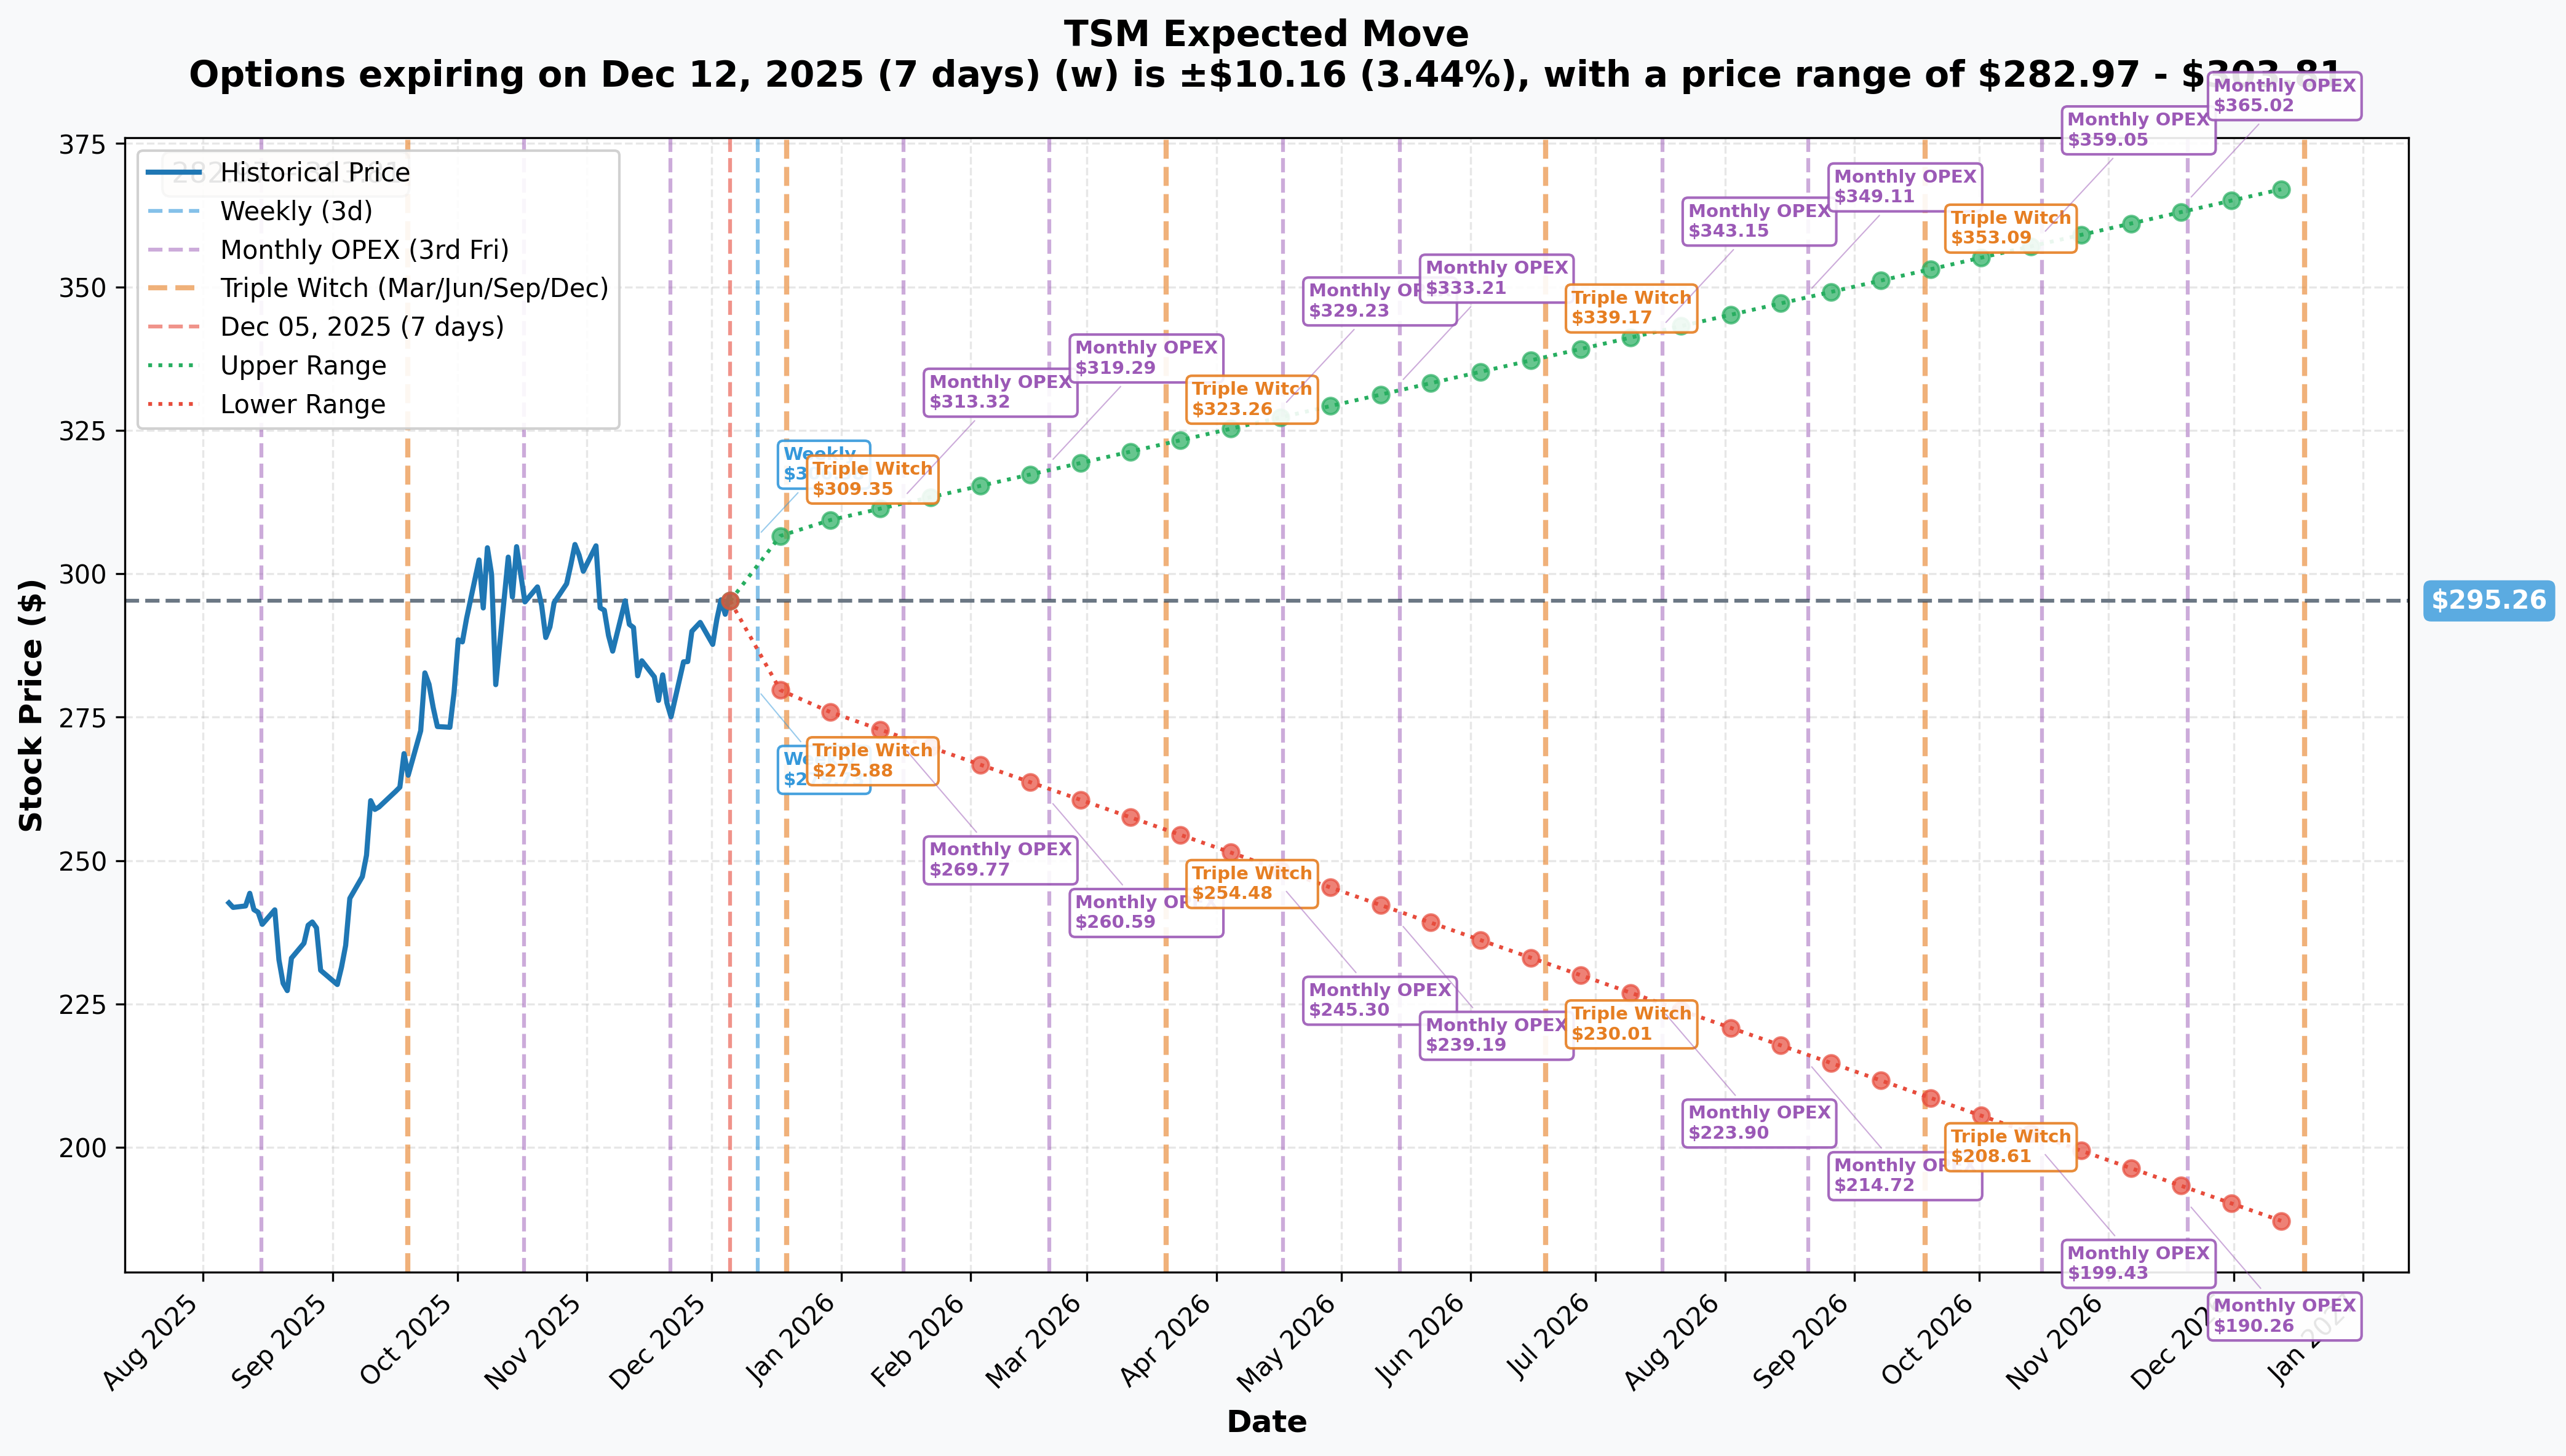
Options market pricing for upcoming expirations:
- 📅 Weekly (Dec 12 - 7 days): ±$10.16 (±3.44%) → Range: $282.97 - $303.81
- 📅 Monthly OPEX (Dec 19 - 14 days): ±$13.90 (±4.71%) → Range: $278.43 - $307.69
- 📅 Quarterly Triple Witch (Dec 19 - same as monthly): ±$13.90 (±4.71%) → Range: $278.43 - $307.69
- 📅 Yearly LEAPS (Dec 18, 2026 - 378 days): ±$80.30 (±27.2%) → Range: $185.67 - $368.00
Translation for regular folks: Options traders are pricing in a 3.4% move ($10) by next weekly expiration, expanding to 4.7% ($14) through December monthly OPEX. The market expects modest volatility - not the explosive moves seen in smaller-cap semis. This relatively tight implied move range FAVORS premium sellers!
For the February 20th expiration (this trade): Looking at the progression pattern, the implied move through February would be approximately ±6-7% from current levels, suggesting a range of roughly $275-315. The $250 strike sits well below even the pessimistic scenarios, giving the seller massive probability of success.
Key insight: The modest 3-5% implied moves reflect TSM's status as a mega-cap ($1.52T) bellwether stock with institutional ownership that dampens volatility. Compare this to smaller chipmakers seeing 8-12% weekly implied moves. Low volatility = great environment for premium collection strategies!
Probability analysis: With the stock at $299 and the call struck at $250, TSM would need to DECLINE 16.5% for these calls to even approach at-the-money status. The implied volatility suggests this has very low probability - likely less than 5% chance based on the options market's assessment.
🎪 Catalysts
🔥 Recent Catalysts (Last 3 Months - Already Happened)
Q4 2024 Earnings Blowout - January 16, 2025 📊
TSMC delivered record-breaking Q4 2024 results that crushed expectations and validated the AI infrastructure thesis:
- 📊 Revenue: NT$868.46B ($26.88B USD), up 37.0% YoY and 14.4% QoQ
- 💰 Net Income: NT$374.68B ($11.6B USD)
- 💵 EPS: NT$14.45 ($2.24 per ADR)
- 📈 Gross Margin: 59.0% (up from 57.8% in Q3) - exceptional pricing power
- 🏭 Operating Margin: 49.0%
- 💎 Net Profit Margin: 43.1%
Technology Mix (Q4 2024):
- 3nm: 26% of wafer revenue (up from 23% in Q3)
- 5nm: 34% of wafer revenue
- 7nm: 14% of wafer revenue
- Advanced nodes (7nm and below): 74% of total wafer revenue - unprecedented concentration in cutting-edge technology
Full Year 2024 Performance:
Why this matters: The stellar earnings created the rally that brought TSM to $299, justifying the premium seller's decision to harvest theta at elevated levels. With results already delivered and stock having rallied into the report, upside surprises are now harder to achieve.
November 2024 Monthly Revenue 💪
TSMC reported November 2024 revenue of NT$276.058B ($8.504B), up 34% YoY, though down 12.2% MoM from October's record. January-November cumulative revenue reached NT$2,616.15B (~$80.36B), up 31.8% YoY - demonstrating sustained momentum despite smartphone seasonality.
Arizona Fab Milestone - Q4 2024 🇺🇸
TSMC's first Arizona fab (Fab 21) began high-volume production on N4 (4nm) process technology in Q4 2024, marking a historic milestone:
- 🏗️ $165B total investment (largest foreign greenfield investment in U.S. history)
- 💰 $6.6B in CHIPS Act direct funding secured via preliminary memorandum (April 2024)
- 👷 Creating 6,000+ direct high-tech jobs and 20,000+ construction jobs
- 🎯 Second fab targeting 3nm production by 2028, third fab announced April 2024
Why this matters: Geopolitical diversification reduces "Taiwan risk" discount, but also creates a natural ceiling on stock appreciation as investors price in execution challenges and higher U.S. operating costs versus Taiwan fabs.
Analyst Upgrades - Recent Activity 📈
Consensus rating: Strong Buy (8 buy, 1 hold, 0 sell) with price targets averaging $348.25 (range: $290-$400):
- Susquehanna: Raised PT to $400 from $300
- Huatai Financial: Raised PT to $320 from $300, maintained Buy
- Zacks: Upgraded to Rank #1 (Strong Buy) on December 5, 2024
- Average upside: 19.23% to 25.80% from current levels
Call seller perspective: Even with bullish analyst targets, most price targets ($320-350) sit well below the $250 short call strike when considering TSM's current $299 price. The seller is betting TSM doesn't sustain levels materially above $300, not that it crashes - a more conservative thesis than outright bearishness.
🚀 Upcoming Catalysts (Next 6 Months)
Q1 2025 Earnings - April 10, 2025 (CRITICAL DATE!) 📊
TSMC will report Q1 FY2025 results on Thursday, April 10, 2025, with Q1 guidance already provided:
- 📉 Revenue guidance: $25.0-$25.8B (5.5% sequential decline due to smartphone seasonality)
- 📊 Gross margin: 57-59% (slight moderation from Q4's 59%)
- 💼 Operating margin: 46.5-48.5%
Key metrics to watch:
- 🤖 3nm revenue contribution: Progression toward 2nm transition - need to see continued ramp
- 🚀 AI accelerator revenue: Growth trajectory from mid-teens % of 2024 revenue
- 📦 CoWoS capacity utilization: Advanced packaging bottleneck resolution
- 🏭 Arizona fab yield rates: U.S. production ramp progress and cost structure
- 🇨🇳 China revenue trends: Impact of export restrictions and competitive dynamics
Full Year 2025 Guidance (Already Announced):
- Revenue growth: Close to mid-20s percent in USD terms
- 🤖 AI accelerator revenue: Expected to DOUBLE from mid-teens % of 2024
- 💰 CapEx: $38-42B (up from ~$30B in 2024)
- 🎯 70-80% of CapEx allocated to advanced nodes (3nm/2nm) and advanced packaging
Call seller perspective: With guidance already provided for Q1 showing sequential decline (normal seasonality), there's limited upside surprise potential. The February 20th expiration comes BEFORE April 10th earnings, meaning the call seller avoids the binary event risk entirely. Smart timing!
2nm (N2) Mass Production Launch - H2 2025 (GAME CHANGER!) 🔬
TSMC's 2nm production commencing second half 2025 represents the next frontier in semiconductor technology:
Technology Advantages:
- 🧬 First-generation Gate-All-Around (GAA) nanosheet transistors
- ⚡ 10-15% performance improvement vs N3E
- 🔋 25-30% power reduction vs N3E
- 📏 15% transistor density increase vs N3E
Customer Commitments:
- 🏢 15+ major customers committed, ~10 focused on AI applications
- 🍎 Apple pre-booked 50%+ of initial 2nm capacity
- 💚 NVIDIA first customer for A16 technology (2nm variant)
- 💻 Intel adopting 2nm for Nova Lake platform
- 📅 Two Taiwan fabs completely sold out for 2nm through entirety of 2026
Revenue Impact: Expected to drive significant ASP increases and margin expansion given supply constraints roughly 3x short of customer demand
Call seller perspective: While 2nm is a major catalyst, the H2 2025 timeline means initial production ramps AFTER the February 20th expiration. The seller avoids the uncertainty of launch timing/yields while collecting premium in the anticipation phase. If 2nm drives a rally, it likely happens in late 2025, not before February.
CoWoS Advanced Packaging Capacity Doubling - 2025 📦
TSMC's CoWoS capacity expanding from 330,000 wafers in 2024 to 660,000-750,000 wafers in 2025 (100% increase):
- 💚 NVIDIA secured over 70% of CoWoS-L capacity for 2025 for Blackwell GPU production
- 🏭 Eight new CoWoS facilities under construction, including Innolux plant (AP8) with 96,000 sqm area
- 🤝 Collaboration with ASE Technology and Amkor to reach capacity targets
- 📅 CoWoS-L (5.5x reticle size) launching 2026; 9.5x reticle size with 12+ HBM stacks planned 2027
Why this matters: Advanced packaging is a critical bottleneck for AI accelerators. Doubling capacity addresses the constraint but also reveals how tight supply remains (demand still exceeds capacity through 2025-2026). This supports pricing power and sustained demand, but capacity limits may cap revenue upside.
Customer Revenue Dynamics - 2025 🏢
NVIDIA projected to reach 19-21% of 2025 revenue (up from 11% in 2023), potentially overtaking Apple's 24% share:
- 📱 Apple: 24% of 2024 revenue (down from 25% in 2023), pre-purchased 50%+ of initial 2nm supply
- 💚 NVIDIA: Explosive growth from AI accelerator demand
- Combined Apple + NVIDIA: Over 40% of revenue in 2025
- 🖥️ HPC segment: Now 57% of Q3 2025 revenue (up from 51% in 2024)
Risk consideration: High customer concentration (40%+ from two customers) creates vulnerability to any slowdown in iPhone demand or AI capex cycle. Diversification would be healthier long-term.
⚠️ Risk Catalysts (Negative)
Geopolitical Risk - The Elephant in the Room 🇹🇼
Taiwan-China tensions represent an unhedgeable tail risk:
- 🚨 Taiwan Strait tensions at multi-decade highs with escalating military activity
- 💥 IEP estimates full-scale Taiwan conflict could cause $10 trillion global economic loss
- ⚖️ Taiwan vulnerable to selective quarantine cutting off raw materials, chemicals, natural gas
- 🛡️ "Silicon Shield" protection weakening as TSMC diversifies to Arizona/Japan/Germany
- 🇨🇳 China-traceable propaganda up 60% in 2024, targeting TSMC's U.S. investments
Why this matters for the call seller: Geopolitical events create downside risk, not upside. The short call position benefits from stability or decline - any Taiwan crisis would send TSM sharply lower, making the $250 calls worthless and allowing the seller to keep the full $27M premium.
Valuation at Peak Levels After 80% Rally 📊
At current levels near $300 after an 80% YTD gain:
- 💰 Stock already reflecting AI infrastructure boom and record earnings
- 📈 Analyst price targets ($320-400) imply only 7-34% additional upside
- ⚠️ Market cap briefly exceeded $1 trillion benchmark in mid-2025 - shows how far the stock has come
- 🎢 After such a massive run, consolidation or pullback is statistically more likely than another 20-30% surge
Call seller thesis: The stock has had its run. Even bulls expect $320-350 tops. Why risk chasing the last 10-15% when you can collect $27M in guaranteed premium betting it doesn't collapse below $250?
Capital Intensity - $38-42B CapEx in 2025 💸
Record CapEx spending of $38-42B in 2025 (highest in company history):
- 🏗️ Significant cash burn risk if AI demand cycle falters
- 🇺🇸 Returns on Arizona/Europe fabs uncertain given higher operating costs vs Taiwan
- ⚖️ Competing for TSMC 3nm capacity with Apple, NVIDIA - internal allocation challenges
- 💰 Margin pressure if utilization rates decline or pricing weakens
Competitive Threats - Samsung & Intel Catching Up 🏁
- Samsung: Investing heavily in GAA technology and U.S. fabs, potential to close process technology gap by 2026-2027
- Intel Foundry: 18A node targeting 2025 production, $8.5B CHIPS Act support, EMIB/Foveros packaging as CoWoS alternative
- Market share risk: TSMC's 64% dominance could face pressure if competitors execute
Call seller perspective: Even if competition intensifies, it's unlikely to happen in the next 77 days before February expiration. This is a structural, multi-year risk - not a near-term catalyst.
🎲 Price Targets & Probabilities
Based on gamma levels, implied move data, and catalysts through February 20, 2026 expiration:
📈 Bull Case (20% probability)
Target: $310-$330
How we get there:
- 💪 Sustained AI infrastructure spending drives advanced node demand beyond expectations
- 🤖 CoWoS capacity doubling removes bottleneck, allowing revenue acceleration
- 📈 2nm customer wins announced ahead of H2 ramp (Apple, NVIDIA, major hyperscalers)
- 🇺🇸 Arizona fab exceeds expectations, removes geopolitical discount
- 🇨🇳 China tensions ease, removing tail risk premium
- 📊 January monthly revenues surprise to upside, validating full-year guidance
- 💰 Margin expansion beyond 59% as pricing power continues (demand 3x capacity)
Key drivers needed:
- NVIDIA Blackwell ramp accelerates, pulling CoWoS demand higher
- Apple iPhone AI features drive 3nm/2nm orders beyond expectations
- No major geopolitical incidents
- Broader market rallies (semis typically beta >1)
Probability assessment: Only 20% because:
- Stock already up 80% YTD - most good news priced in
- $300 resistance (40.6B gamma) creates mechanical ceiling
- February timeline is SHORT (77 days) - not enough time for new catalysts to materialize
- Seasonal weakness typical in Q1 for tech
Call seller impact: If TSM rallies to $310-330, the $250 calls remain deeply out-of-the-money and expire worthless. Seller keeps full $27M premium. This is actually a GOOD scenario for the premium seller!
🎯 Base Case (55% probability)
Target: $280-$310 Range (CONSOLIDATION)
Most likely scenario:
- ✅ Stock digests 80% YTD gains, trades sideways in tight range
- 📊 Q1 guidance for sequential decline (already announced) plays out as expected
- 🏭 CoWoS capacity ramps on schedule, neither ahead nor behind
- 🇹🇼 Geopolitical tensions simmer but no major escalation
- 💰 Margins stable in 57-59% range as guided
- 📈 Trading within gamma bands: $295 support / $300 resistance
- 🔄 Volatility remains modest (3-5% weekly ranges)
- 💤 Investors wait for 2nm launch (H2 2025) and April earnings for next catalyst
This is the call seller's IDEAL scenario:
- Stock stays range-bound $285-305
- Time decay erodes option value daily
- $250 calls expire worthless on February 20th
- Seller keeps entire $27M premium ($54.90 per contract)
- ROI for seller: 100% of premium collected (assuming covered call strategy)
Why 55% probability:
- Consolidation after big runs is statistically normal
- No major catalysts between now and February expiration
- Gamma profile supports range ($295-300 tight zone)
- Seasonality favors sideways action in Q1
- Options market pricing modest 3-5% moves
Call seller P&L in Base Case:
- Stock at $280-310 on Feb 20: Calls worth $0, profit = $27M (100% gain)
- Break-even for seller: TSM would need to trade ABOVE $304.90 ($250 strike + $54.90 premium collected)
📉 Bear Case (25% probability)
Target: $250-$280 (TEST THE STRIKE!)
What could go wrong:
- 😰 Broader market correction drags semis lower (TSM beta >1)
- 🇨🇳 Taiwan-China tensions escalate (military drills, blockade threats, export restrictions)
- 📉 AI capex cycle shows signs of slowdown (hyperscaler guidance cuts)
- 🇺🇸 Arizona fab yield issues or cost overruns revealed
- 💸 Margin compression from competitive pressure (Samsung, Intel gains share)
- 🤖 NVIDIA or Apple order cuts signal demand weakness
- 📊 January monthly revenue misses, raising concerns about Q1 guidance
- 🔨 Break below $295 gamma support triggers cascade to $290, then $280
- 💔 "Risk-off" rotation out of high-valuation tech hits semis hard
Critical support levels:
- 🛡️ $295: Immediate floor (28.1B gamma) - MUST HOLD
- 🛡️ $290: Major support (32.0B gamma) - critical test
- 🛡️ $280: Structural floor (18.3B gamma) - bear case target
- 🛡️ $270: Deep support (11.9B gamma)
- 🛡️ $250: Extended floor (10.8B gamma) + SHORT CALL STRIKE!
Probability assessment: 25% because:
- Geopolitical risks are real and binary
- Valuation offers limited cushion after 80% rally
- Semiconductor cycles are notoriously volatile
- Q1 seasonality typically weak for hardware
- Gamma support provides floors but not guarantees
Call seller P&L in Bear Case:
- Stock at $280 on Feb 20: Calls worth $0, profit = $27M (100% gain)
- Stock at $270 on Feb 20: Calls worth $0, profit = $27M (100% gain)
- Stock at $260 on Feb 20: Calls worth $0, profit = $27M (100% gain)
- Stock at $250 on Feb 20: Calls worth $0, profit = $27M (100% gain)
- Stock at $240 on Feb 20: Calls worth $0 (strike at $250, stock below), profit = $27M (100% gain)
The beautiful part of this trade: Even in the bear case with TSM dropping 10-15%, the call seller STILL wins! The stock would need to RISE above $304.90 (strike + premium) for the seller to lose money. This is an asymmetric bet - the seller makes money if TSM goes up modestly, stays flat, or goes down!
💡 Trading Ideas
🛡️ Conservative: Follow the Smart Money - Collect Premium
Play: Sell covered calls on TSM shares if you own them, or sell cash-secured puts if you want to get long
Covered Call Structure (if you own TSM):
- 📊 Own 100 shares of TSM per call sold
- 💰 Sell March 2026 $310 calls (collect ~$30-35 premium per contract)
- 🎯 Strike is 3.6% above current price - comfortable upside cap
- ⏰ 105 days to expiration (March 20, 2026) maximizes theta decay
- 🛡️ Generates 10-12% annualized income while maintaining stock ownership
Why this works:
- 💸 Collect premium income on stock you already own
- 📈 Defined risk: You're already long the stock, just capping upside at $310
- ⚖️ If called away at $310, you made 3.6% capital gain PLUS the premium
- 🤝 Mimics institutional strategy (likely what the $27M trader is doing!)
- ☮️ Sleep-well strategy: You WANT to own TSM long-term, just collecting rent
Cash-Secured Put Alternative (if you want to get long):
- 💰 Sell February $280 puts (collect ~$12-15 premium)
- 🎯 Strike is 6.4% below current price - good entry point
- 💵 Set aside $28,000 cash per put to secure the trade
- 📊 If assigned at $280, your cost basis is $265-268 (strike minus premium) = 11-13% below current
- ✅ If TSM stays above $280, keep premium and repeat
Risk level: Low (you want to own TSM anyway) | Skill level: Intermediate
Expected outcome: Collect 8-12% annualized income, potentially get assigned shares at discounted prices
⚖️ Balanced: Iron Condor - Bet on the Range
Play: Sell iron condor betting TSM stays $275-315 through February 20th
Structure:
- 📉 Sell $315 calls (collect premium)
- 📈 Buy $320 calls (protection)
- 📉 Sell $275 puts (collect premium)
- 📈 Buy $270 puts (protection)
Why this works:
- 💰 Collect premium from both call and put spreads
- 🎯 Profits if TSM stays within $275-315 range (±5% from current $295)
- 📊 Defined risk: $5 wide spreads = $500 max loss per condor
- ⏰ 77 days of theta decay working in your favor
- 🤝 Aligns with gamma profile showing $295-300 consolidation zone
Estimated P&L:
- 💰 Net credit collected: ~$2.00-2.50 per condor
- 📈 Max profit: $200-250 if TSM expires between $275-315
- 📉 Max loss: $250-300 if TSM outside $270-320 range
- 🎯 Breakevens: ~$272.50 (lower) and ~$317.50 (upper)
- 📊 Probability of profit: ~60-65% (based on ±5% range)
Position sizing: Risk only 3-5% of portfolio (directional bet on low volatility)
Management:
- 🎯 Close at 50% of max profit (lock in $100-125 per condor)
- 🚨 Set mental stop if TSM breaks $280 or $310 (exit for small loss)
- ⏰ Don't hold to expiration - take profits at 60-70% max gain
Risk level: Moderate (defined risk, range-bound bet) | Skill level: Advanced
🚀 Aggressive: SHORT TSM Calls - Copy the $27M Trade (EXPERT ONLY!)
Play: Sell naked calls or deep OTM call spreads mimicking the institutional positioning
Structure (Credit Spread Version for Retail):
- 📉 Sell February $310 calls (collect premium)
- 📈 Buy February $320 calls (protection)
Why this could work:
- 💰 Collect $8-12 per spread (assuming ~$40 for $310 call, ~$30 for $320 call)
- 🎯 Profits if TSM stays below $310 through February 20th
- 📊 $310 strike is 4.9% above current price - reasonable probability
- ⏰ 77 days of time decay accelerating in final month
- 🤝 Directly mimics institutional strategy (they sold $250 calls, you sell $310)
Why this could blow up (SERIOUS RISKS):
- 🚨 NAKED UPSIDE EXPOSURE (if selling naked): Losses theoretically unlimited if TSM rockets higher
- ⚠️ MARGIN REQUIREMENTS: Broker may require $30K-50K margin per naked call sold
- 💥 2nm CATALYST RISK: If 2nm news breaks early or major customer win announced, stock could gap to $320+
- 📈 GAMMA RISK: As stock approaches $310-320, dealer hedging could accelerate move
- 🇹🇼 GEOPOLITICAL WILDCARD: Arizona fab success or Taiwan tension resolution could spike stock
Estimated P&L (Credit Spread Version):
- 💰 Credit collected: $8-12 per spread
- 📈 Max profit: $800-1,200 if TSM below $310 at expiration
- 📉 Max loss: $200-400 if TSM above $320 (defined risk with spread)
- 🎯 Breakeven: ~$318-322 (strike + premium collected)
- 📊 Probability of profit: ~55-60% (TSM needs to stay range-bound)
CRITICAL WARNING - DO NOT attempt unless you:
- ✅ Have experience selling options and understand assignment risk
- ✅ Accept that you could lose 30-50% if TSM rallies to $320+
- ✅ Understand the $27M trader likely has MILLIONS in shares (covered calls)
- ✅ Have adequate margin/capital to weather mark-to-market moves
- ✅ Can monitor position daily and adjust if TSM breaks $305-310
- ⏰ Plan to close at 50-60% max profit, not hold to expiration
For naked call sellers (institutions only):
- 💀 Requires $100K+ account and portfolio margin approval
- 🚨 Unlimited risk if wrong - DO NOT do this without hedges
- 📊 Should only be done as part of covered call strategy (own stock)
Risk level: EXTREME (can lose multiples of premium) | Skill level: Expert only
Probability of profit: ~55-60% (lower than base case due to limited margin for error)
⚠️ Risk Factors
Don't get blindsided by these potential landmines:
-
🇹🇼 Geopolitical tail risk is REAL: Taiwan-China military tensions at multi-decade highs with $10T global economic impact potential. Any blockade, invasion threat, or export restrictions would crater TSM 30-50% overnight. This is an unhedgeable black swan risk that keeps institutional investors awake. China-traceable propaganda targeting TSMC up 60% in 2024 shows psychological warfare intensifying. The "Silicon Shield" may be weakening as TSMC diversifies globally.
-
💸 Valuation stretched after 80% YTD rally: Stock near all-time high of $311.37 after explosive run from $134. Even bullish analysts only targeting $320-400 - that's just 7-34% additional upside. Compare this to 80% already captured - risk/reward asymmetric to downside. Trees don't grow to the sky. Market cap briefly hit $1 trillion milestone - shows how far we've come, how little room for multiple expansion.
-
🏭 $38-42B CapEx burn rate creates execution risk: Record capital spending in 2025 to build Arizona/Japan/Germany fabs and expand CoWoS capacity. If AI demand cycle reverses, TSMC stuck with massive overcapacity and falling margins. Arizona fab operating costs 50-60% higher than Taiwan - could pressure profitability as U.S. revenue mix grows. Returns on international expansion uncertain.
-
🤖 AI capex cycle vulnerability: TSMC revenue increasingly concentrated in AI/HPC (57% of Q3 revenue, up from 51%). If hyperscalers (Microsoft, Google, Meta) slow AI infrastructure spending, demand evaporates quickly. We've seen this movie before in crypto (2018) and cloud (2022) - speculative buildouts followed by brutal hangovers. TSMC CEO saying capacity "not enough, not enough, still not enough" could flip to "too much" if sentiment shifts.
-
🏢 Customer concentration risk extreme: Apple + NVIDIA = 40%+ of 2025 revenue. Any iPhone demand weakness or NVIDIA Blackwell delays cascades directly to TSMC results. Apple's 24% share declining as iPhone growth matures - diversification needed but takes years. If either customer guides down, TSMC stock gets obliterated.
-
📦 CoWoS bottleneck persists despite doubling capacity: Even with 100% capacity increase to 660K-750K wafers in 2025, supply remains tight through 2026. NVIDIA securing 70% of CoWoS-L capacity leaves limited allocation for AMD, Broadcom, others - could push customers to seek alternatives (Intel's EMIB/Foveros). Dependency on ASE and Amkor adds supply chain complexity and single points of failure.
-
🔬 2nm execution risk with accelerated timeline: Mass production commencing H2 2025 is FAST. First-generation GAA (Gate-All-Around) nanosheet transistors are significantly more complex than FinFET - yield challenges likely in early production. 15+ customers committed but only ~10 focused on AI - if AI-focused customers delay, revenue impact magnified. Any qualification delays push revenue into 2026, disappointing Street expectations.
-
⚔️ Samsung and Intel closing the gap: Samsung investing aggressively in GAA and U.S. fabs - potential to close process technology lead by 2026-2027. Intel's 18A targeting 2025 with $8.5B CHIPS Act support creates subsidized competition. Intel's EMIB/Foveros packaging emerging as viable CoWoS alternative. TSMC's 64% foundry market share won't last forever - competition erodes margins and pricing power over time.
-
📊 Q1 2025 sequential decline already guided: Q1 revenue guidance $25.0-$25.8B represents 5.5% sequential decline due to smartphone seasonality. Gross margins moderating to 57-59% from Q4's 59%. Market knows this, but if decline exceeds guidance or margins compress further, stock vulnerable. February expiration captures this weak seasonal period.
-
🇨🇳 China export restrictions wildcard: U.S. expanding semiconductor export controls unpredictably. Could limit TSMC's ability to serve Chinese customers (historically 15-20% of revenue, though declining). Retaliatory actions from China possible - restricting raw materials, targeting Taiwan operations, or supporting domestic competitors (SMIC, Huawei). Binary political risk impossible to hedge.
-
💹 Gamma ceiling at $300 creates mechanical resistance: Massive 40.6B call gamma at $300 (by FAR the largest level) means market makers will systematically SELL as price approaches to hedge dealer exposure. This creates automatic selling pressure making sustained breakouts difficult. Stock needs overwhelming fundamental catalyst to overcome this technical barrier. Current price $296 sitting right under this ceiling - like hitting your head on a concrete roof.
-
📉 Macro recession risk not priced in: At current valuations, TSM has ZERO recession protection. Enterprise IT budgets and data center spending are first to get cut in economic downturn. If 2026 brings recession, even perfect execution won't save stock from 25-35% correction back to $200-220 range. Semis are cyclical - don't let AI hype make you forget that.
🎯 The Bottom Line
Real talk: Someone just pocketed $27 MILLION in premium by selling deeply out-of-the-money TSM calls with the stock trading near all-time highs. This isn't a bearish bet against TSMC's incredible business - it's sophisticated risk management and premium harvesting by institutions who understand the stock has limited upside in the near term after an 80% run.
What this trade tells us:
- 🎯 Smart money prefers COLLECTING premium over chasing further gains at $299
- 💰 They're comfortable capping upside at $250 (16.5% below current) because they don't expect the stock there
- ⚖️ The timing (77 days to February expiration) captures the weak Q1 seasonal period while avoiding April earnings
- 📊 Strike selection at $250 sits well below all major gamma support levels ($295, $290, $280, $270, $260) - extremely high probability trade
- ⏰ Expiration before 2nm launch (H2 2025) means they avoid the major catalyst uncertainty
This is a "take profits and generate income" signal, not a "crash is coming" warning.
If you own TSM:
- ✅ Consider selling covered calls at $310-320 strikes (collect 10-12% annualized income)
- 📊 If holding long-term, use any dips toward $280-285 to add shares (strong gamma support)
- ⏰ You've already won big with 80% YTD gains - lock in some profits or reduce position size
- 🎯 Stock likely ranges $285-310 through February - perfect for income generation strategies
- 🛡️ Set mental stop at $275 (below major support) to protect profits if thesis breaks
If you're watching from sidelines:
- ⏰ Don't chase at $295-300 - wait for better entry points
- 🎯 Pullback to $280-285 would be EXCELLENT entry (strong gamma support + 5-7% off highs)
- 📈 Looking for confirmation: Q1 revenue in-line with $25-26B guidance, CoWoS capacity ramp on track, no geopolitical escalation
- 🚀 Longer-term (H2 2025), 2nm production launch is legitimate catalyst for $320-350 if execution delivers
- ⚠️ Current setup favors SELLERS over BUYERS - be patient
If you're options-focused:
- 🎯 Sell puts at $280 to get paid waiting for better entry (cash-secured strategy)
- 📊 Iron condors $275-315 range align with base case consolidation thesis
- ⚠️ Selling calls at $310-320 mimics institutional strategy (credit spreads for defined risk)
- ⏰ Time decay accelerates in final 30 days - premium sellers have structural edge
Mark your calendar - Key dates:
- 📅 December 12 - Weekly OPEX (±3.44% implied move window)
- 📅 December 19 - Monthly/Quarterly Triple Witch OPEX
- 📅 January 15-20, 2026 - January monthly revenues reported (validation of Q1 guidance)
- 📅 February 20, 2026 - EXPIRATION DATE for this $27M call trade
- 📅 April 10, 2025 - Q1 FY2025 earnings report (major catalyst AFTER this trade expires)
- 📅 H2 2025 (July-September) - 2nm mass production launch expected
Final verdict: TSMC's long-term story remains EXCEPTIONAL - undisputed foundry leader with 64% market share, demand exceeding capacity by 3x, 2nm technology sold out through 2026, and AI revenue doubling in 2025. But at $299 after an 80% rally with Q1 sequential decline guided and no major catalysts until H2 2025, the risk/reward favors PREMIUM SELLERS over buyers.
The $27M institutional call sale is a CLEAR signal: The easy money has been made. Now it's time to harvest premium in the consolidation phase.
Be smart. Collect premium. Wait for better entries. The semiconductor cycle will reward patient capital allocators. 💪
Disclaimer: Options trading involves substantial risk of loss and is not suitable for all investors. This analysis is for educational purposes only and not financial advice. Past performance doesn't guarantee future results. Selling options, especially naked calls, carries potentially unlimited risk and margin requirements. The unusual score reflects this trade's size relative to normal TSM activity - it does not imply you should follow the trade. Geopolitical events create binary risk that could result in rapid 30-50% stock declines. Always do your own research and consider consulting a licensed financial advisor before trading. Premium collection strategies work best in range-bound markets but can result in assignment obligations and losses if stock moves against your position.
About Taiwan Semiconductor Manufacturing Company: Taiwan Semiconductor Manufacturing Co. is the world's largest dedicated chip foundry with mid-60s% market share in 2024, manufacturing advanced semiconductors for Apple, NVIDIA, AMD, and other leading technology companies using cutting-edge 3nm and 2nm process nodes, with a market cap of $1.52 trillion.