🤝 AMD $26M "BUY PUT" Headline Is a Trap — This Is a Delta-Neutral Long-Vol Package, Not a Bear Bet
📅 June 15, 2026 | 🔍 Unusual Activity Detected
✅ Updated 2026-06-16: Next-day OPRA OI confirms the open — the Jan-2028 $600 put rose 62 → 1,297 (Δ +1,235 ≈ the 1,300 traded). A fresh package was established. This confirms a NEW position, not its direction: the put is delta-hedged by the paired long-stock block, so it stays NON-DIRECTIONAL (long-vol / synthetic call / financing), not a bearish bet.
🎯 The Quick Take
Someone just crossed $26M worth of AMD (Advanced Micro Devices) LEAP put options — 2.5-year contracts expiring January 2028 — and on the surface that reads like a massive bearish bet on one of 2026's best-performing stocks. But here's the real story: at the very same timestamp, the exact same desk bought 43,750 shares of AMD stock on the equity tape as a Qualified Contingent Trade (QCT) — a stock block that by regulatory definition is the hedge leg of a contingent cross. That long-stock block nearly perfectly offsets the downside delta of those puts, leaving the combined position with almost zero net directional exposure. This is not a $26M bet that AMD goes down. It is a delta-neutral, long-volatility package — most likely a synthetic long call, a protective-put financing structure, or a convexity / volatility play. The headline dollar amount is real. The bearish conviction is not.
📊 Company Overview
Advanced Micro Devices (AMD) designs high-performance CPUs, GPUs, and AI accelerators for data centers, gaming, and embedded applications:
- Market Cap: ≈$834B (mid-June 2026)
- Sector / Industry: Information Technology — Semiconductors / Electronic Computers
- What they do: AMD makes EPYC server CPUs (top hyperscaler choice for data-center scale-out), Ryzen client CPUs, Radeon graphics, and the Instinct MI-series GPU accelerators (the #2 AI-training platform behind NVIDIA). In 2026 the company converted AI-GPU momentum into binding multi-gigawatt supply deals: OpenAI's 6 GW MI450 partnership (with up to 160M AMD warrants), Meta's ≈$100B multi-year commitment, and Oracle's 50,000-GPU MI450 supercluster launching Q3 2026.
- Recent performance: AMD is +130% year-to-date in 2026, trading around $549, near its all-time-high close of $542.52 reached June 3, 2026. The stock has roughly doubled on AI data-center demand alone. That kind of move, combined with a still-elevated growth trajectory, makes the implied volatility on AMD LEAPs extremely rich — which is exactly the environment a long-volatility structure exploits.
💰 The Option Flow Breakdown
The Tape — June 15, 2026 @ 14:00:14: 🤝 single-leg block cross (negotiated, known counterparty)
| Field | Detail |
|---|---|
| Time | 14:00:14 |
| Buy/Sell | BUY |
| Call/Put | PUT |
| Expiration | 2028-01-21 |
| Strike | $600 |
| Volume | 1,300 |
| Open Interest (prior) | 62 |
| Size | 1,250 |
| Spot at Print | $549.23 |
| Option Price | $209.85 |
| Premium | $26M |
| Option Symbol | AMD20280121P600 |
| Flow Type | 🤝 Single-Leg Block Cross |
The equity hedge (confirmed on tape, same timestamp):
| Field | Detail |
|---|---|
| Time | ≈14:00:14 (same timestamp) |
| Transaction | Long Stock Block |
| Shares | 43,750 |
| Price | $547.84 |
| Tape Type | Qualified Contingent Trade (QCT) |
| Function | Delta hedge for the put cross |
Flow type: 🤝 Single-Leg Block Cross — this was a pre-arranged, negotiated block printed off the displayed order book. A broker matched a buyer and a seller with a known counterparty. Not a lit sweep, not urgent selling.
The delta hedge math (independently verified): At a spot of ≈$549 and implied volatility of ≈75%, the AMD Jan-2028 $600 put carries an estimated delta of ≈−0.33. That means each contract behaves like being short 33 shares. Across 1,250 contracts × 100 shares × 0.33 delta = ≈41,250 share-equivalents of short delta. The simultaneous purchase of 43,750 long shares offsets that almost exactly. Net directional exposure: ≈zero.
✅ RESOLVED — Next-Day OI Confirms the Open (2026-06-16)
| Leg | Pre-print baseline (EOD 2026-06-12) | Resolving (EOD 2026-06-15) | Δ | Verdict |
|---|---|---|---|---|
| Jan-2028 $600P | 62 | 1,297 | +1,235 | OPEN — fresh package confirmed (NON-DIRECTIONAL) |
The next-morning OPRA snapshot confirms a clean open: open interest jumped from 62 to 1,297, a +1,235 rise that matches the 1,300 contracts traded. A brand-new position was established. Critically, that does not make this bearish — the put printed with a simultaneous 43,750-share long-stock block (a Qualified Contingent Trade) that neutralizes the delta. Long put + long stock = a synthetic-call / long-volatility / financing package. The OI confirms a fresh package went on; the direction is still ≈delta-neutral.
🤓 What This Actually Means — Plain English
Let's break this down like a friend at the whiteboard.
The headline trap: When you see "$26M BUY PUT" in an options scanner, and the strike is $600 on a stock trading at $549 — slightly above the current price — your brain says "someone just bet $26 million AMD is going to tank." That's the trap. The put alone is only half the story.
How the math works: A Jan-2028 $600 put with a delta of ≈−0.33 behaves like being short 33 shares for every contract. Buying 1,250 of them creates a position that acts like being short ≈41,250 shares of AMD. The desk immediately bought ≈43,750 real shares of AMD stock on the equity tape at the same moment. Long ≈43,750 real shares + the equivalent of short ≈41,250 synthetic shares = delta of ≈zero. The position barely moves when AMD goes up or down a few dollars.
So what IS this? There are three classic reasons a sophisticated desk runs a long-put + long-stock structure:
-
Synthetic long call / convexity position: By put-call parity, a long put + long stock creates a position economically identical to a long call. The desk owns the upside convexity of AMD — if the stock rips higher, the long stock gains and the put expires worthless (cheap insurance cost). If AMD collapses, the long put gains and protects the stock downside. Either way, the position profits from a big move — specifically on the upside convexity. This is not a bet AMD goes down. It's a bet AMD does something dramatic.
-
Protective-put / insurance structure: The desk may already own AMD stock (or a large AMD position via other instruments) and is simply buying insurance against a drawdown. The new stock block sets the cost basis; the LEAP put is the floor. This is the most basic risk-management structure in institutional finance.
-
Long volatility / financing: With ≈75% implied volatility on a Jan-2028 expiry, the ≈$209.85 option price contains enormous time premium. A desk may be buying this vol because they believe AMD's realized volatility through 2026–2027 will be even higher than 75% implies — a rational bet given the MI450/Helios ramp, the August 4 earnings catalyst, and the OpenAI/Meta deal go-lives all converging in the next 12 months.
The key number is the time premium paid: The $600 put is slightly in the money (AMD at $549, strike $600 = $51 intrinsic). The remaining ≈$159 of the $209.85 option price is time/volatility premium. Across 1,250 contracts, the desk paid ≈$19.9M purely for volatility exposure and optionality over 2.5 years. That is the real bet — not on the direction of AMD stock, but on how much AMD will move between now and January 2028.
Order type: BTO — Buy to Open the put leg, with a simultaneous long-stock hedge. The overall package is HEDGED / VOLATILITY LONG, not directional bearish. A real bear buys ATM or OTM puts for leverage at low cost — not 0.33-delta puts immediately paired with 43,750 long shares.
Confidence: HIGH on structure (size 1,250 ≫ OI 62, equity hedge confirmed as a QCT block on tape at the same timestamp, delta math is clean). The open/close call is confident. The directional read is hedged by design — and the QCT print means the stock leg is a regulatory contingent trade, not a separate view.
What the tape cannot prove: We see the mechanism (block cross), put size (1,250 contracts), price ($209.85), and the QCT stock block (43,750 shares at $547.84). We cannot identify the buyer's full portfolio, their prior AMD exposure, or whether the stock block is a full hedge or a partial one. A QCT print carries no buy/sell side flag — meaning we can't prove the exact sub-structure (protective-put vs. synthetic call vs. conversion). But the delta neutrality at execution is solid, and that rules out a clean directional bearish read.
📈 Technical Setup / Chart Check-Up
YTD Performance
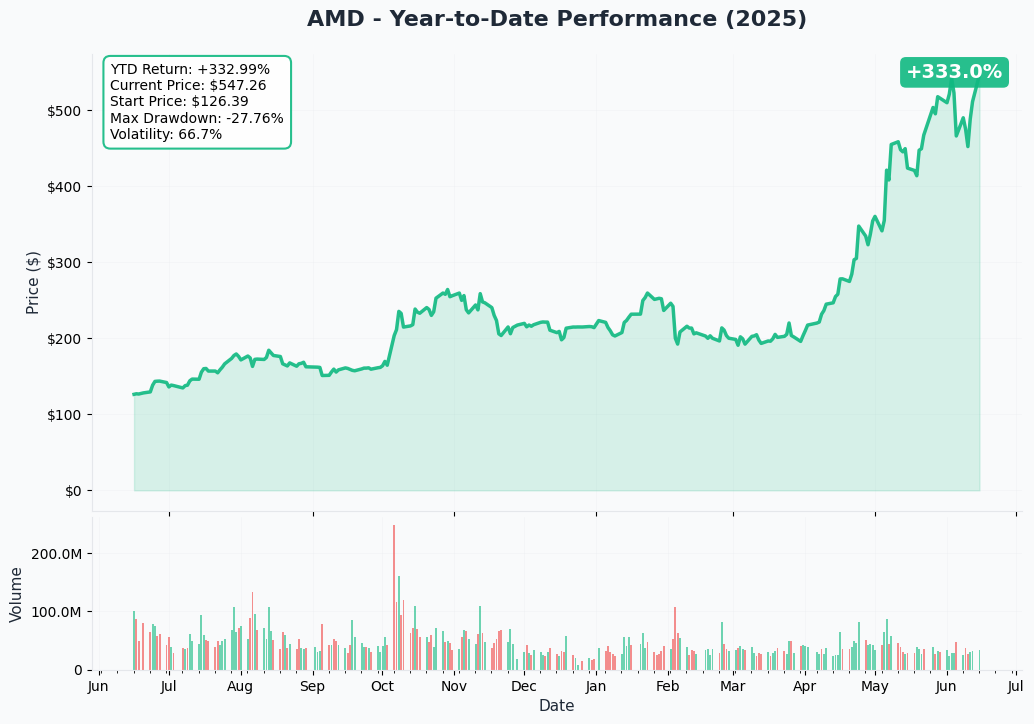
AMD has been one of the defining megacap stories of 2026. The stock has climbed ≈130% year-to-date from its January 2026 lows to ≈$549, near the all-time high close of $542.52 reached June 3.
Key observations:
- 📈 The run has been driven almost entirely by AI-GPU demand: Q1 FY2026 data-center revenue of $5.8B (+57% YoY), three multi-gigawatt hyperscaler supply agreements, and Barclays' Street-high $665 price target
- 📊 AMD is now trading well above the legacy consensus target of ≈$430, with premium shops clustering at $560–$665 post-Q1
- 🎯 For today's delta-neutral structure, the direction of the stock matters less than the level of volatility — the desk profits from a large move in either direction through 2028, not specifically from a decline
Gamma-Based Support & Resistance
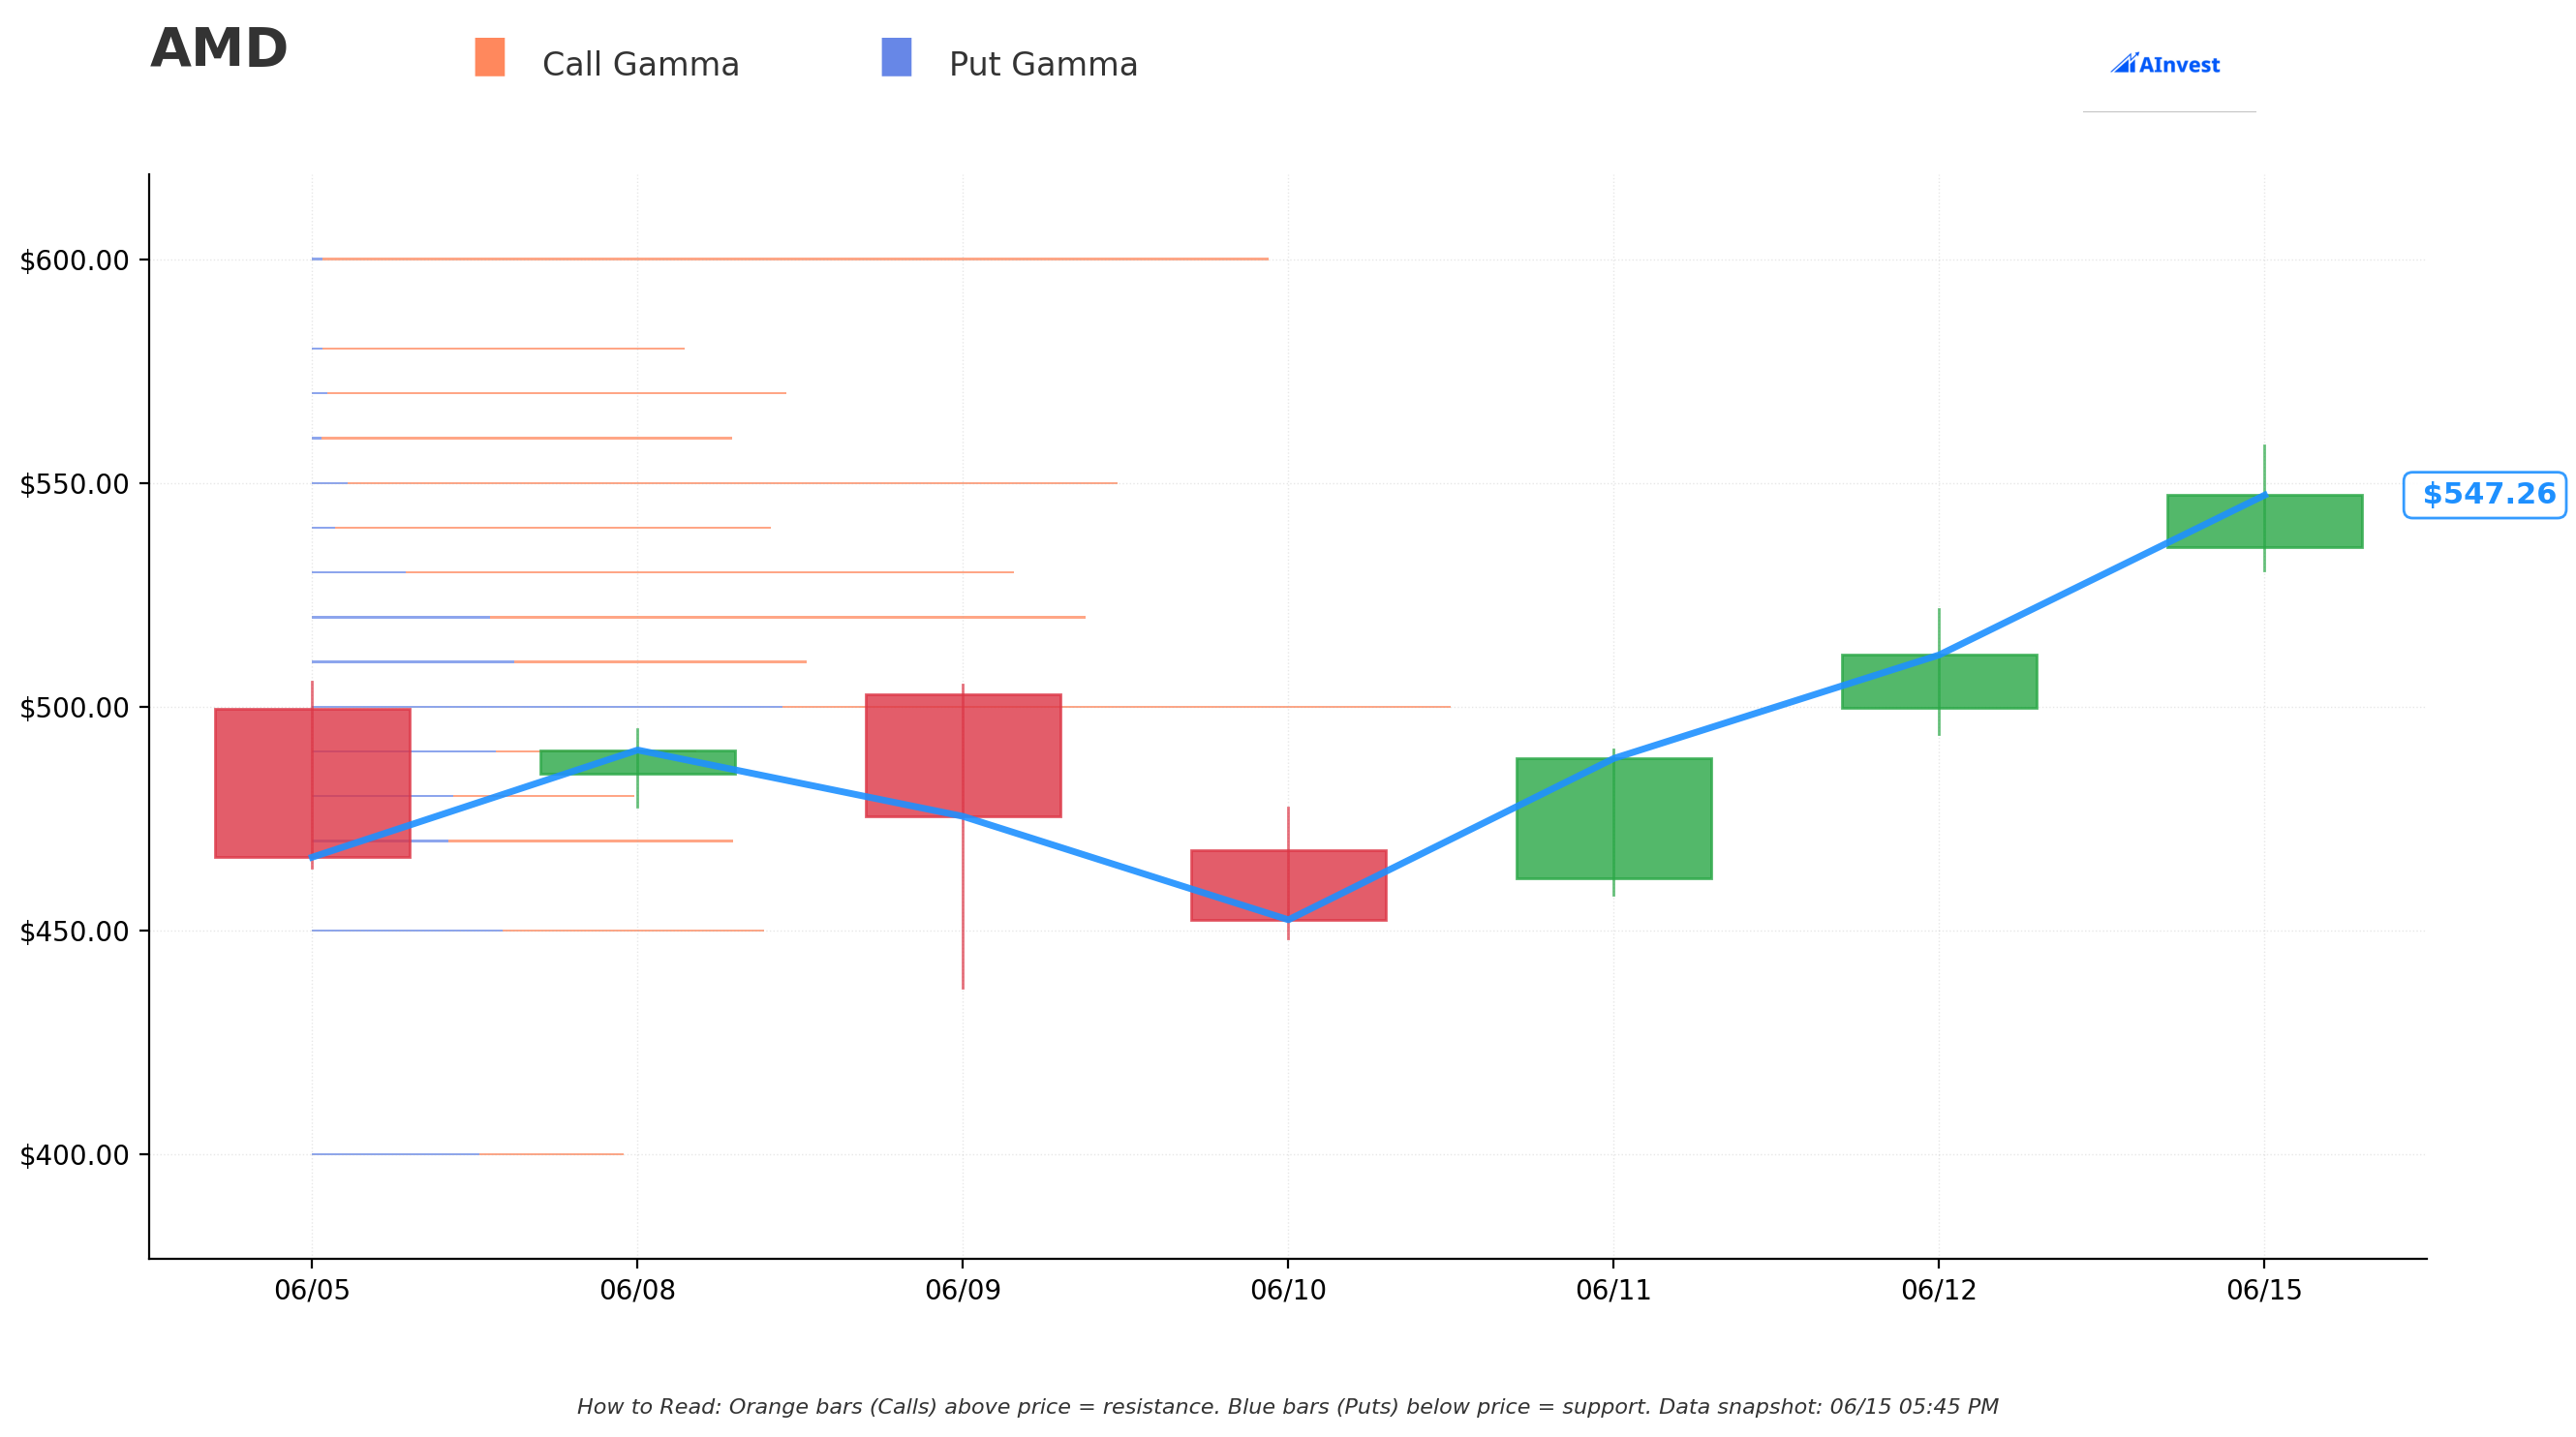
Current Price: ≈$547
The gamma exposure map shows the key mechanical levels the options market is organized around right now:
🔵 Support Levels (Put Gamma Below Price):
- $530 — Strong Support. The first meaningful put-gamma wall below spot. Market makers have significant hedging activity anchored here; dips toward $530 will attract mechanical buying pressure.
- $520 — Secondary Support. A deeper cushion ≈5% below current levels. A break of $530 on volume would likely find the next meaningful bid at $520.
- $510 — Tertiary Support. The lower boundary of the near-term gamma support zone. Below $510 the gamma support thins out considerably.
🟠 Resistance Levels (Call Gamma Above Price):
- $550 — Immediate Resistance. Just above the current price of $547, this is the first gamma wall AMD must clear. The density of call gamma here creates mechanical selling from market makers on any test of $550.
- $560 — Key Resistance. A more significant cluster. Citi's $575 target and BofA's $560 target sit right in this zone — the gamma and analyst consensus converge here.
- $570 — Stronger Resistance Wall. The outer boundary of the near-term resistance cluster. A confirmed close above $570 would suggest a genuine breakout and remove this gamma lid.
Translation for traders: AMD is currently testing the $550 gamma resistance from just below. Near-term direction likely oscillates between the $530 support and the $550/$560 resistance ceilings ahead of the August 4 earnings catalyst. For today's delta-neutral structure, these short-term levels don't change the long-vol thesis — but they matter a great deal for anyone trading AMD directionally in the coming weeks.
Implied Move Analysis
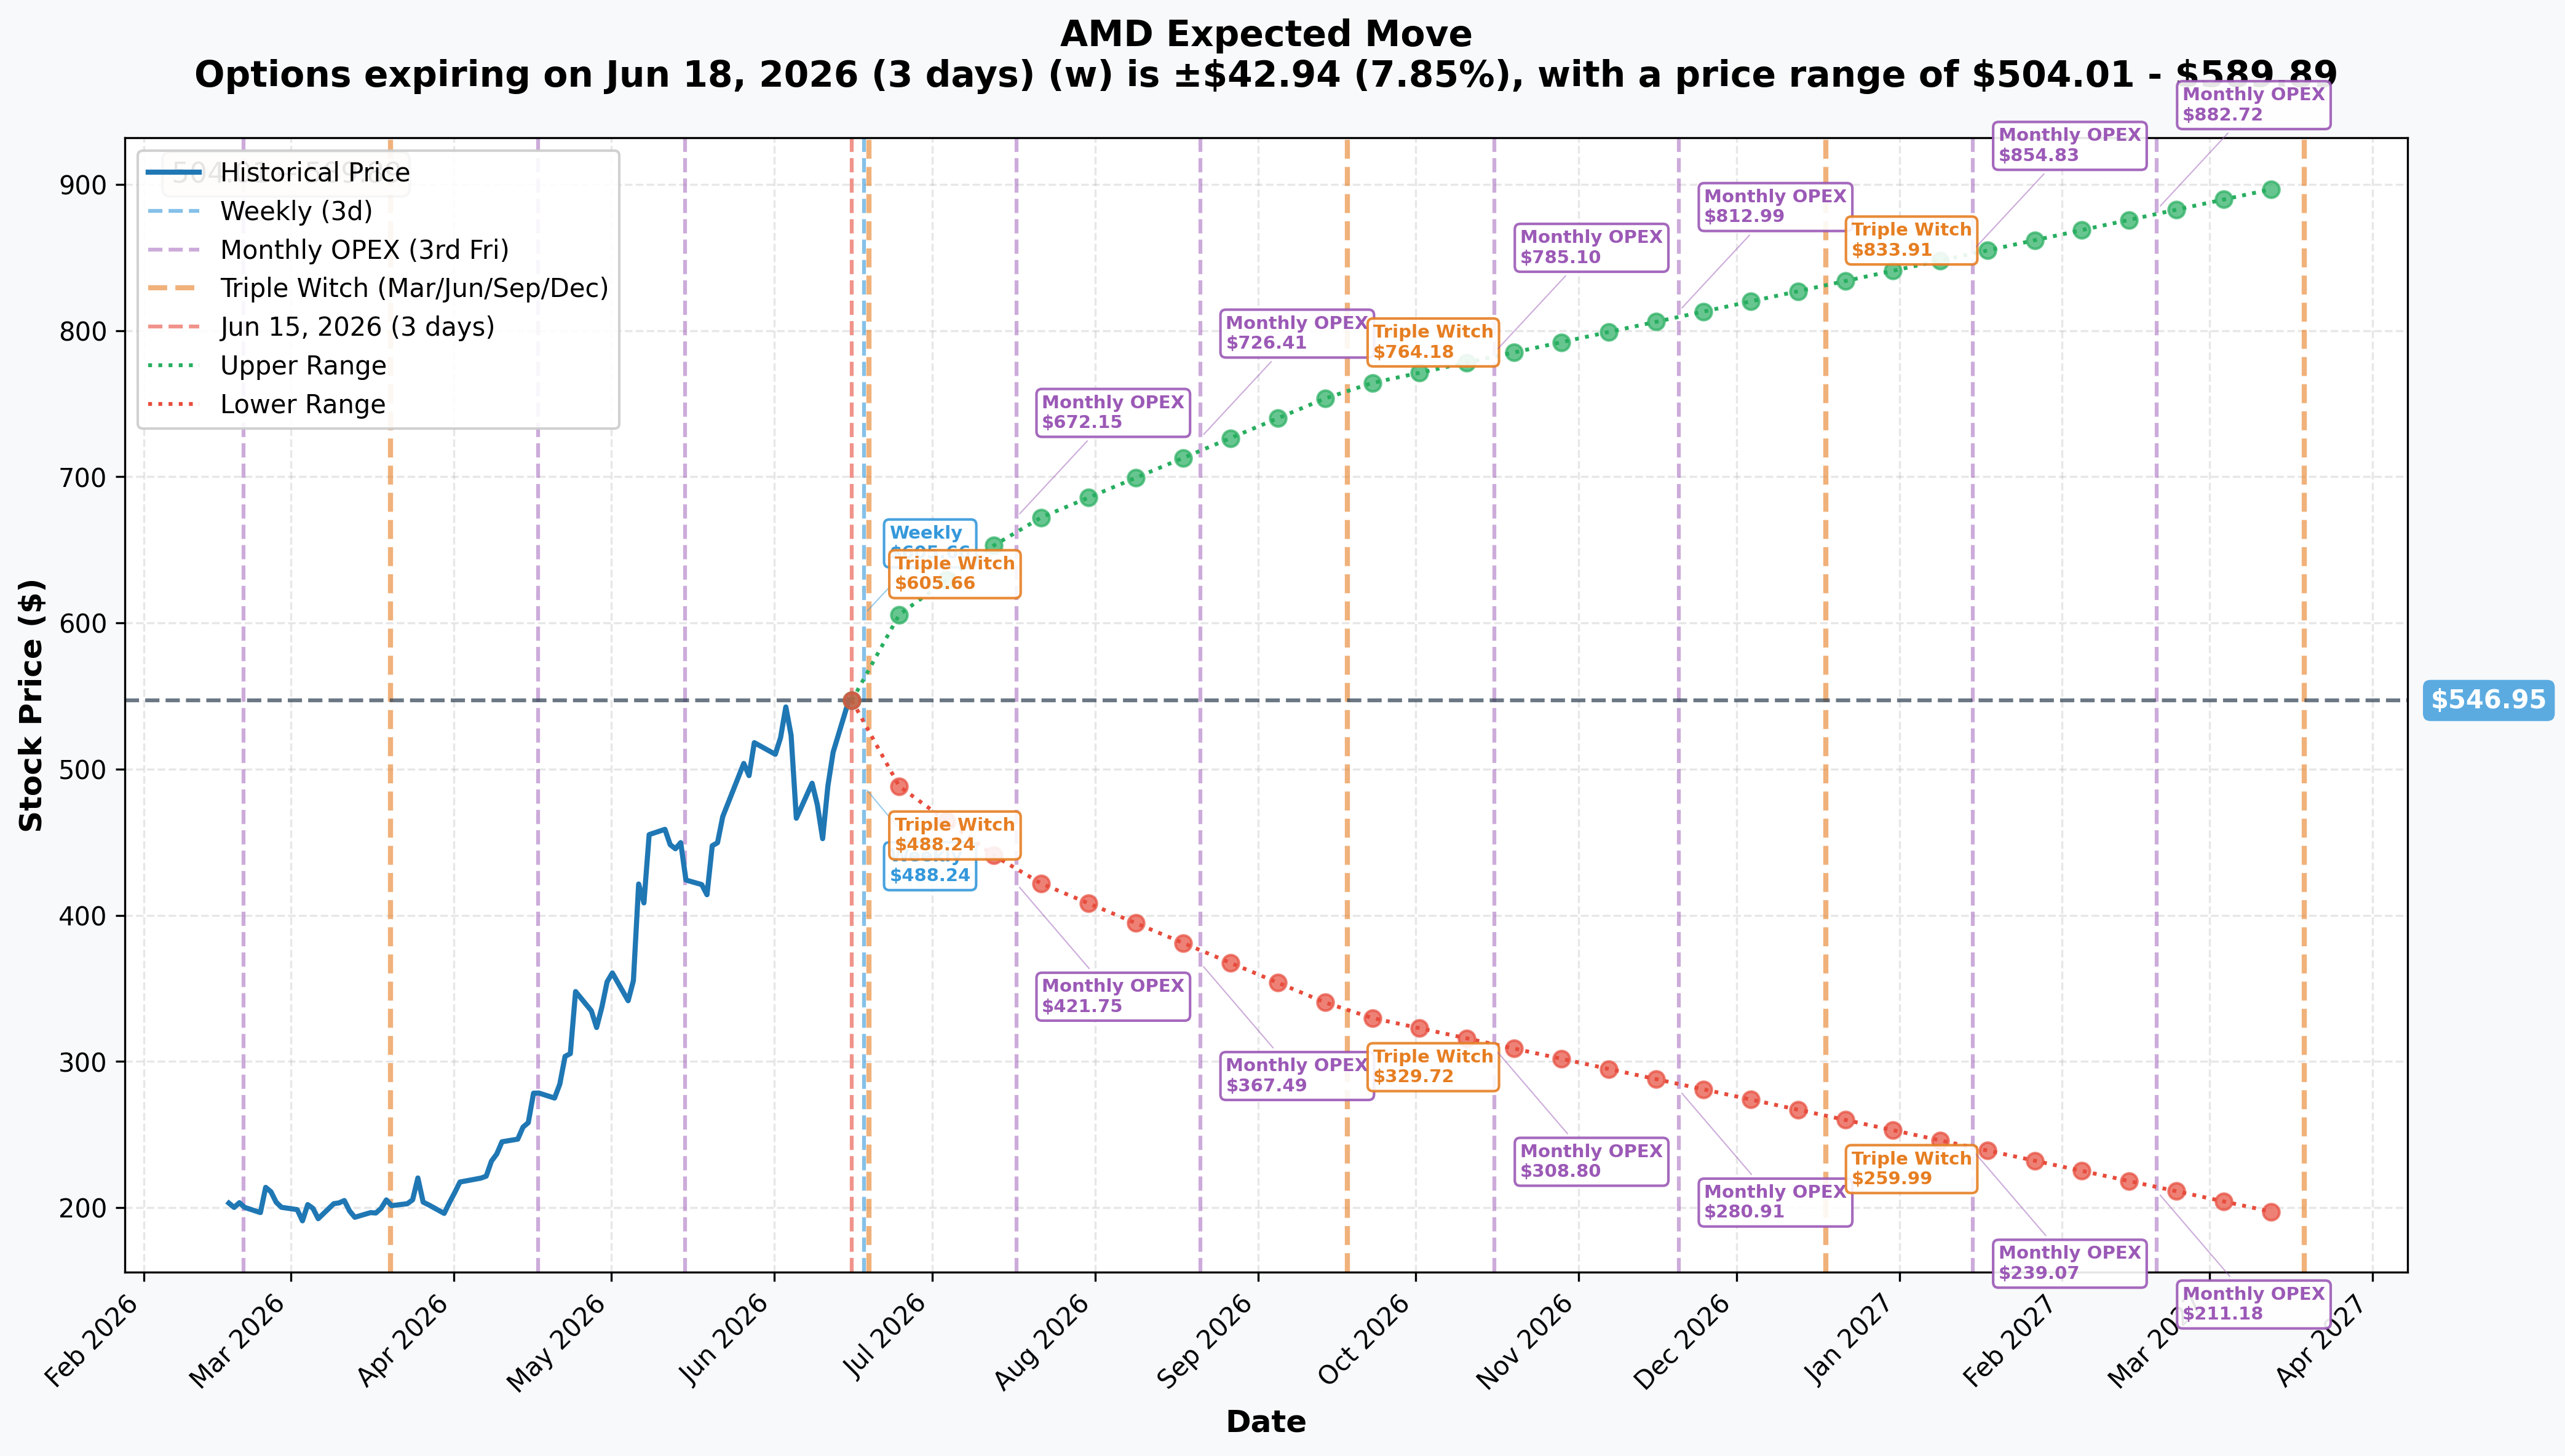
The options market is pricing enormous uncertainty across time horizons on AMD — which is precisely why a long-volatility structure spanning 2.5 years is rational:
- 📅 Monthly OPEX (2026-07-17, ≈32 days): ±$119.38 (±21.79%) → Range $427.78 – $666.12
- 📅 Quarterly (2026-09-18, ≈95 days): ±$215.30 (±39.15%) → Range $332.82 – $761.08
- 📅 LEAP (2027-03-19, ≈277 days): ±$357.21 (±64.93%) → Range $191.81 – $902.09
That LEAP cone — $191 on the low end, $902 on the high end — reflects the staggering uncertainty baked into a stock that has already nearly doubled in 2026 and carries a ≈75% implied volatility. The options market is essentially saying: "AMD could be anywhere between $192 and $902 by early 2027, and we're not sure which." That is a textbook long-volatility environment.
For the Jan-2028 $600 put specifically, the implied move cone by its expiry is even wider. The $600 strike sits ≈9% above the current spot — so the put is slightly in the money (ITM). Its value comes from AMD either (a) staying in this general range and the desk collecting convexity from a delta-hedged position, or (b) the stock making a large move in either direction that the long-vol structure monetizes.
🎪 Catalysts
Already Happened (Recent Context)
Q1 FY2026 Earnings Blowout — May 5, 2026 (Reported) AMD reported $10.3B revenue (+38% YoY) with data-center revenue of $5.8B (+57% YoY). Non-GAAP EPS hit $1.37, GAAP EPS $0.84 (+91% YoY). Record free cash flow of $2.6B (3× YoY). The company guided Q2 FY2026 to ≈$11.2B revenue, ≈56% non-GAAP gross margin — another step-up. AMD Investor Relations press release here.
OpenAI — 6 GW MI450 Strategic Partnership (October 2025) OpenAI committed to deploy up to 6 gigawatts of AMD Instinct GPUs over multiple years, with the first 1 GW deploying on MI450 in 2H 2026. AMD issued OpenAI a warrant for up to 160M shares at $0.01 vesting against deployment milestones — a potential ≈10% ownership stake, running through ≈October 2030. This locked in multi-year demand visibility that rivals have not matched.
Meta — ≈$100B / 6 GW Multi-Year Commitment AMD and Meta struck a ≈$100B multi-year AI supply agreement structured around a 1 GW opening MI450 deployment, with Meta co-engineering a custom MI450 variant. Similar warrant structure to the OpenAI deal.
Oracle — 50,000 MI450 GPU Supercluster (Announced October 2025) Oracle and AMD expanded their partnership to deploy 50,000 MI450 GPUs in OCI starting Q3 2026 — the first publicly available AI supercluster on MI450 hardware. Powered by AMD's Helios rack architecture.
AMD Financial Analyst Day — November 11, 2025 AMD unveiled a strategy targeting the $1T compute market, guiding data-center revenue to surpass $100B with >60% CAGR over 3–5 years. Long-term gross margin target of 55%–58%. This strategic framing — alongside the 2026 deal pipeline — is what drove the YTD re-rating.
Analyst Upgrades — June 2026 After the Q1 print, Barclays set a Street-high $665 target; BofA (Vivek Arya) raised to $560 naming AMD a top CPU pick (June 12); Citi raised to $575 (June 12). The premium-shop consensus has re-clustered at $560–$665, well above the ≈$430 legacy site-wide target.
Upcoming Catalysts (The Key Events Through Jan 2028)
Q2 FY2026 Earnings — August 4, 2026 (after close, CONFIRMED) 📅 — THE NEAR-TERM EVENT Confirmed per Catacal earnings calendar. Guidance midpoint: $11.2B revenue, ≈56% non-GAAP gross margin. This is the single largest near-term volatility event embedded in the Jan-2028 LEAP structure. Watch: MI350→MI400 GPU transition commentary, any update on MI450/Helios low-volume start timing, China MI308 license revenue, and Gaming 2H margin impact from the expected ≈20% gaming revenue decline on higher memory costs.
MI400 / MI450 Series + "Helios" Rack — 2H 2026 (On Track) MI400-series GPUs and Helios rack-scale systems confirmed for 2H 2026 — the next GPU generation targeting up to 3 AI exaflops per rack. AMD's full MI400 lineup has been unveiled, and claims the MI500 series (2027) delivers ≈1,000× cumulative AI-performance gains generationally. The Helios ramp is the biggest swing factor into the Jan-2028 LEAP window.
OpenAI First 1 GW Go-Live — 2H 2026 Initial OpenAI MI450 deployment begins in 2H 2026, triggering the first warrant-tranche vesting milestone. A stumble here would be an immediate re-rating event in either direction.
Oracle 50,000-GPU MI450 Supercluster — Starting Q3 2026 First publicly available MI450 cloud capacity comes online, a key proof point for AMD's Helios rack execution.
China / MI308 Export Licenses — Ongoing AMD is positioned to resume MI308 shipments to China pending BIS case-by-case license approvals. A win = incremental tailwind; an adverse policy reversal = another write-down risk. Legislative risk via the proposed SAFE Chips Act could cap China sales at MI308-class through ≈2028.
MI500 Series — 2027 The next architectural generation relevant for the tail of the Jan-2028 LEAP. AMD claims MI500 delivers ≈1,000× cumulative performance gains vs earlier generations — an aggressive competitive claim that will either validate or deflate AMD's 2027 thesis.
🎲 4-Reader Interpretation
🚀 YOLO Trader
Don't read this as a $26M bet AMD crashes. That's the trap. The desk bought 43,750 shares of AMD stock at the same time they bought the puts — the two legs cancel each other's direction out. What they're really doing is betting on AMD moving a lot over the next 2.5 years. If you want to piggyback on the volatility theme with a YOLO tilt, consider an AMD straddle (buy both a call and a put at the same strike) ahead of the August 4 earnings — a big move in either direction pays off. The implied monthly move is ±21.79% right now, which is expensive, but the catalyst density supports buying both sides. Max loss = the combined straddle premium. Set a position limit you can afford to lose entirely.
📊 Swing Trader
Don't read this as a signal to short AMD. The delta-neutral structure says the desk has no directional conviction. For your own swing setup, the gamma map is the roadmap: AMD is testing the $550 resistance just above current spot, with $530/$520 as the support stack below. A clean breakout above $560 (confirmed close, ideally on volume after a catalyst) targets the $560–$665 analyst cluster. A break below $530 would suggest the run is cooling and $510 is the next test. Watch the August 4 earnings as the key binary trigger — be cautious about holding large directional positions through the report without a defined stop.
🛡️ Premium Collector
With ≈75% implied volatility on AMD LEAPs, the premium is enormous — and today's trade confirms an institution just paid for it. If you believe AMD's realized volatility will be lower than 75% over the next 2.5 years (i.e., the stock drifts without huge moves), selling covered calls against existing AMD stock positions at the $570–$600 range could be attractive. A cash-secured put at the $510–$520 gamma support zone offers defined-risk income if you're willing to own AMD at lower prices. Caveat: the August 4 earnings print will spike IV — if you're short premium, close or hedge before August 4 to avoid a vol crush working against your timing or (worse) a gap move overwhelming your position.
🌱 Entry-Level / Beginner
Here's the plain-English version. Someone bought $26 million worth of AMD put options. Put options make money if the stock goes down. You'd normally say "bearish bet." But — at the exact same moment — they also bought ≈43,750 shares of AMD stock. Stock makes money when the stock goes up. When you buy a put (profits if AMD goes down) AND buy stock (profits if AMD goes up), those two positions partially cancel each other out. The fancy term is "delta neutral." Your combined position barely moves if AMD goes up or down a little. The desk is instead betting on AMD making a big move — they just don't know (or don't care) which direction. They paid ≈$20M of the $26M total as "time value" — basically the cost of owning that optionality for 2.5 years. Think of it as buying insurance AND the stock at the same time, structured so the desk profits whether AMD surges past $700 or drops toward $400 — as long as the move is big enough.
⚠️ Risk Factors
Options trading involves substantial risk of loss and is not suitable for all investors.
The $26M structure is a volatility/hedging trade — the tape confirms direction is neutral We have high confidence the delta-neutral read is correct: the put cross and the QCT stock block arrive at the same timestamp, and the delta math (1,250 × 100 × ≈0.33 = ≈41,250 shares vs. 43,750 actual) closes tightly. But we cannot access the buyer's full portfolio. If they already hold a large pre-existing AMD short or a complex multi-leg book, the equity tape print could be a partial hedge or a re-balance, not a clean one-to-one offset. The tape confirms mechanism and size; it does not confirm the buyer's net exposure across all positions.
AI-capex sustainability risk — the structural bear case for AMD's multiple Hyperscalers guided to a combined $635–$690B of 2026 capex (+67–74% YoY) while their revenue grows only mid-teens. Morgan Stanley estimates >$400B in hyperscaler debt issuance to fund it. A capex air-pocket or bubble repricing would hit AMD's AI-GPU thesis directly — and that is exactly the kind of downside tail that the Jan-2028 $600 put (slightly ITM) is positioned to capture if the structure turns out to be more protective-put than synthetic-call.
Memory / DRAM cost crunch pressuring margins AMD itself guided Gaming revenue to fall ≈20% in 2H 2026 on higher memory/component costs and flagged some MI450 gross-margin dilution from elevated HBM4 costs. AI is absorbing ≈20% of global DRAM wafer output in 2026 — a cost pressure that doesn't go away quickly.
MI450 / Helios execution risk The 2H 2026 ramp begins at low volume with mass production following. Any slip pushes OpenAI/Oracle/Meta revenue recognition to the right, and a richly priced stock (well above consensus) has little tolerance for timing misses.
Valuation / expectations after +130% YTD AMD is trading well above its ≈$430 legacy consensus target, at a premium multiple that already prices in significant AI-GPU success. An earnings stumble, a Helios delay, or a China policy reversal from elevated levels could trigger a sharp drawdown — the ±21.79% monthly implied move prices exactly this risk.
China / export policy — fluid AMD is pending BIS license approvals for MI308 China shipments. An adverse policy change (or the SAFE Chips Act becoming law) reintroduces the $800M-type write-down risk from 2025 as a template.
What the OPRA tape cannot prove: We see the mechanism (block cross on the put), size (1,250 contracts), price ($209.85), and the QCT stock hedge (43,750 shares at $547.84). We cannot identify the buyer, their full portfolio book, their stop-out level, or their P&L targets. We cannot prove the exact sub-structure — protective-put vs. synthetic call vs. conversion financing — because a QCT print carries no buy/sell side flag. The delta-neutral read is the most probable interpretation given the math; it is not a certainty.
🎯 The Bottom Line
Here's the deal: the $26M number is real, but the directional story it implies — "someone just made a massive bet AMD is going to tank" — is not.
Real talk: a sophisticated desk structured a delta-neutral package. They bought 1,250 Jan-2028 $600 AMD puts (a 2.5-year LEAP, slightly in the money) via a block cross, and simultaneously bought ≈43,750 shares of AMD stock as a Qualified Contingent Trade at the same timestamp. Long put + long stock = delta of ≈zero. The direction is hedged away. What's left is the ≈$20M of time/volatility premium — the real bet on AMD doing something dramatic between now and January 2028.
For directional traders, the key fact is this: do not read this trade as a $26M conviction short on AMD. A real bear buys ATM or OTM puts for cheap directional leverage — not slightly-ITM LEAPs immediately hedged with 43,750 long shares. If you want a directional view, form it independently based on AMD's fundamentals.
The macro setup is genuinely two-sided. AMD has extraordinary demand visibility (OpenAI 6 GW, Meta ≈$100B, Oracle 50K GPUs, Q1 data-center revenue +57% YoY), but also real risks (AI-capex sustainability debate, memory cost crunch, rich valuation after +130% YTD, execution risk on the MI450/Helios ramp). That two-sided uncertainty — and the ≈75% IV it generates — is exactly the environment a delta-neutral, long-volatility LEAP structure is designed to exploit.
What to watch:
- 📅 June 16, ≈06:30 ET: OPRA OI snapshot — expected to show the AMD Jan-2028 $600P OI rising to ≈1,312 (from 62), confirming the put leg opened. Remember: open ≠ bearish here.
- 📅 August 4, 2026: Q2 FY2026 earnings after close — the biggest near-term volatility trigger. Watch data-center GPU run-rate, MI450/Helios shipment timing, gaming margin hit, and China MI308 license revenue.
- 📅 Q3 2026: Oracle 50,000-GPU MI450 supercluster go-live and OpenAI first 1 GW deployment — the first real-world validation of the Helios ramp.
- 📅 2H 2026: MI400/MI450 mass ramp and Helios rack availability — the single biggest swing factor for AMD into 2027.
- 📅 2027: MI500 launch and OpenAI/Meta warrant-vesting milestones — the LEAP tail catalysts.
Key gamma levels to watch if you're trading directionally: $530/$520/$510 as support stack. $550/$560/$570 as resistance stack. $550 is the immediate test; a confirmed close above $560 opens the path to the analyst target zone ($560–$665).
Disclaimer: Options trading involves substantial risk of loss and is not suitable for all investors. This analysis is for educational and informational purposes only and does not constitute financial advice or a recommendation to buy or sell any security. The trade described is interpreted as a delta-neutral hedged structure based on available OPRA tape evidence and the confirmed presence of a Qualified Contingent Trade (QCT) stock block at the same timestamp; this interpretation may not reflect the full intent of the parties involved. Past unusual options activity does not guarantee future returns. The AMD January 2028 $600 put described herein was traded as part of a simultaneously hedged package; standalone analysis of the put position without considering the equity hedge would be materially misleading. Always conduct your own due diligence and consider consulting a licensed financial advisor before making any trading decisions. Open/close classification is based on size-vs-prior-OI inference and will be confirmed by next-day OPRA open interest data (≈06:30 ET).
Last updated: 2026-06-16 — next-day OPRA OI confirmed the open (+1,235); structure remains non-directional / delta-hedged.