⚙️ AMD $21.28M: The September $470 Short Opened in Full — but the August $500 "Tail Cover" Retired Old Contracts Instead of Buying New Ones
📅 2026-08-11 | 🔥 Unusual Activity Detected
🔄 Updated 2026-08-12 pre-market — the next-day OPRA open interest resolved both legs, and the August leg inverted. The September $470 short opened as predicted (1,262 → 9,479, +8,217 against an 8,075-lot sale, inside our published 8,000–9,600 window). The August $500 leg did not open: open interest fell 13,291 → 11,417 (−1,874), where a fresh long would have pushed it toward ≈21,300. That leg bought back existing contracts rather than creating new ones, so the provisional BTO label is retired and the "cheap August tail cover" framing has been withdrawn. What survives is a short-call roll down and out — August $500 exposure reduced, September $470 exposure created. See the ✅ RESOLVED box.
🎯 The Quick Take
At 10:27:33 ET, one package traded on AMD: 8,075 September 18 $470 calls SOLD for ≈$27.50M, paired with 8,075 August 21 $500 calls BOUGHT for ≈$6.22M — a ≈$21.28M net credit. The shape is backwards from a normal calendar trade: the desk sold the longer-dated, at-the-money option and bought the shorter-dated, out-of-the-money one, which is what makes this a reverse diagonal, not a garden-variety spread. The core of the trade is collecting a huge slug of at-the-money time value in a September window that — per the calendar facts below — has no scheduled AMD earnings report in it at all.
🏢 Company Overview
Advanced Micro Devices, Inc. (NASDAQ: AMD) designs and sells x86 CPUs, Instinct AI GPUs/accelerators, FPGAs and adaptive SoCs across three reporting segments — Data Center, Client and Gaming, and Embedded. GICS classification: Information Technology sector, Semiconductors & Semiconductor Equipment industry.
- Market cap: ≈$765B at a $469.26 spot
- 52-week range: $149.22 – $584.73 (spot is ≈19.8% below the high)
- Beta: 2.49 — a genuinely high-volatility mega-cap
- Valuation: 120x trailing / 42x forward earnings
- Q2 2026 (reported August 4): revenue $11.536B, +50% YoY; Data Center revenue $6.718B, +107% YoY, now 58% of total revenue; non-GAAP EPS $1.66, +246% YoY. Q3 guide ≈$13.0B, above the Street's ≈$12.4B.
This is a stock that has had an enormous run and a genuinely strong quarter behind it — both of which matter for reading a trade that sells rich premium into that strength rather than chasing it.
💰 The Trade, Plain English
Someone sold a large block of September at-the-money calls and used a slice of the proceeds to buy a small block of August calls that are well out of the money and expire ten days sooner. Selling the bigger, closer-to-the-money, longer-dated option and buying the smaller, further-out-of-the-money, shorter-dated one is the opposite of how most people build a diagonal (normally you buy the long-dated leg and sell the short-dated one against it) — hence "reverse diagonal."
Mechanism: this printed as a multi-leg auction (a facilitated exchange price-improvement match) — a worked complex order, not a negotiated block cross and not a lit sweep. Full details:
| Time | Buy/Sell | Call/Put | Expiration | Premium | Strike | Volume | OI | Size | Spot | Option Price | Option Symbol | Order Type | Strategy |
|---|---|---|---|---|---|---|---|---|---|---|---|---|---|
| 10:27:33 ET | SELL | CALL | 2026-09-18 | ≈$27.50M | $470 | 8,200 | 1,262 | 8,075 | $469.26 | $34.05 | AMD20260918C470 | STO | Reverse Diagonal (sell Sep $470 / buy Aug $500) |
| 10:27:33 ET | BUY | CALL | 2026-08-21 | ≈$6.22M | $500 | 8,800 | 13,291 | 8,075 | $469.26 | $7.70 | AMD20260821C500 | 🔄 Not an open (resolved — OI fell; was BTO ⏳) | Short-Call Roll Down & Out (buy back Aug $500 / sell Sep $470) |
Net credit collected: ≈$21.28M ($27,495,375 − $6,217,750), or ≈$26.35 per contract across 8,075 contracts.
At $469.26 spot, the sold $470 strike is essentially exactly at the money (+0.16%) — that $34.05 premium is almost entirely time value, not intrinsic value. The bought $500 strike is ≈6.5% out of the money with only ≈10 calendar days of life. One more tape detail worth flagging honestly: the sold leg printed at the bid (0% across) and the bought leg printed at the ask (100% across) — both sides technically look liquidity-taking. But a multi-leg auction allocates prices across the whole package rather than pricing each leg independently against its own book, so treat that as a weak hint about aggression, not proof of it.
✅ RESOLVED — The September Short Opened Exactly; the August "Cover" Was Not a New Long
Updated 2026-08-12 pre-market. Resolving OPRA snapshot timestamped August 12 (reflects the August 11 close, after this print); baseline is the August 11 snapshot (reflects the August 10 close, before this print).
| Leg | Baseline (Aug-11) | Resolving (Aug-12) | Δ | Print size | What we published | Verdict |
|---|---|---|---|---|---|---|
| Sep-18 $470 call (sold) | 1,262 | 9,479 | +8,217 | 8,075 | "jump toward roughly 8,000–9,600" | ✅ OPEN (STO) — inside the window |
| Aug-21 $500 call (bought) | 13,291 | 11,417 | −1,874 | 8,075 | "OI rising toward ≈13,300–21,300 supports a fresh open; OI falling supports a close" | 🔄 NOT AN OPEN — was BTO ⏳ |
The September short leg is confirmed and is the dominant risk in this package. Open interest rose 8,217 against an 8,075-lot sale — slightly more than the block, so essentially all of it is net-new short-call obligation, not a transfer.
The August $500 leg went the other way, and that changes what this trade is. We named both branches in advance and said falling open interest would mean a close. It fell. Against 8,075 contracts bought, net open interest at the strike dropped 1,874 — so this print created no new long calls. The most it can have done is retire 1,874 contracts of existing August $500 open interest, with the remaining ≈6,200 changing hands between holders who were already there.
What that means for the structure. The article below describes a reverse diagonal in which cheap August $500 calls sit above a rich September $470 short as tail cover. Measured by surviving open interest, that cover was not purchased on August 11 — net August $500 interest shrank. The economics that remain are a short-call roll down and out: an existing August $500 short-call obligation was bought back, and a bigger, closer-to-the-money September $470 short was sold in its place. That is a more premium-hungry and less hedged posture than the diagonal described below, not a more protected one. Readers should not carry the "capped tail risk" reading forward.
The honest caveat. Open interest is a market-wide total, not this desk's book. We can prove that August $500 open interest fell while September $470 interest was created; we cannot prove the buyer in this specific package is the one holding less August exposure tonight. The structural point holds either way — no new August $500 cover exists in the market.
🤓 What This Actually Means — Plain English
Strip away the two-leg structure and ask what each side is really doing:
The short September $470 call is the real position. Selling an at-the-money call with 38 days to run collects the fattest time-value premium available on the board — $34.05 a contract, almost none of it intrinsic since the strike sits basically on top of spot. That's a bet that AMD does not rally meaningfully above $470 by September 18. It profits from time decay and from the stock going sideways or down; it starts losing money, without a hard ceiling once the other leg is gone, once AMD pushes materially above ≈$496–504 (see math below).
The long August $500 call is small, cheap tail insurance — not a separate bullish bet. At $7.70 for a strike ≈6.5% away with only 10 days left, this leg is priced almost entirely as a low-delta, low-probability "just in case" hedge against a sudden near-term melt-up (an unscheduled partnership headline, a sector-wide AI squeeze off NVIDIA). It is not sized or structured to make this trade "bullish" — it used up less than a quarter of the credit collected on the short leg.
Why call it "reverse"? A standard diagonal buys the long-dated option (slow time decay) and sells the short-dated one (fast time decay) against it, so the position earns the decay differential over time while staying long optionality. This trade does the opposite — it is short the slow-decaying, big-premium leg and long the fast-decaying, small-premium leg. That inversion is exactly why it generates such a large net credit: selling 38 days of at-the-money extrinsic value is worth roughly 4.4x as much as buying 10 days of 6.5%-out-of-the-money extrinsic value.
The risk-control point that matters most: because the two legs expire on different dates, this is not a defined-risk vertical spread within one expiration. Once the August $500 call expires on August 21, whatever protection it offered against a rip higher is gone — the short September $470 call then stands alone, uncovered, for the remaining ≈4 weeks until September 18. Rough breakeven math, assuming the August leg expires worthless (the likely outcome at 6.5% out of the money with 10 days left): ≈$496.35 ($470 strike + $26.35 net credit per contract). Above that level at expiration, the position is losing money with no cap from this structure alone. This is functionally a large short at-the-money call on a stock that is up big over the past year — treat the loss potential as open-ended, not "spread-defined," for the four weeks after August 21.
Bid/ask note again for completeness: because the sold leg hit the bid and the bought leg hit the ask, it is tempting to read "aggressive two-way conviction" into this — but per-leg pricing inside a multi-leg auction is allocated across the whole package, so this is a weak hint at best, not proof either side took real liquidity.
📈 Technical Setup
YTD Chart
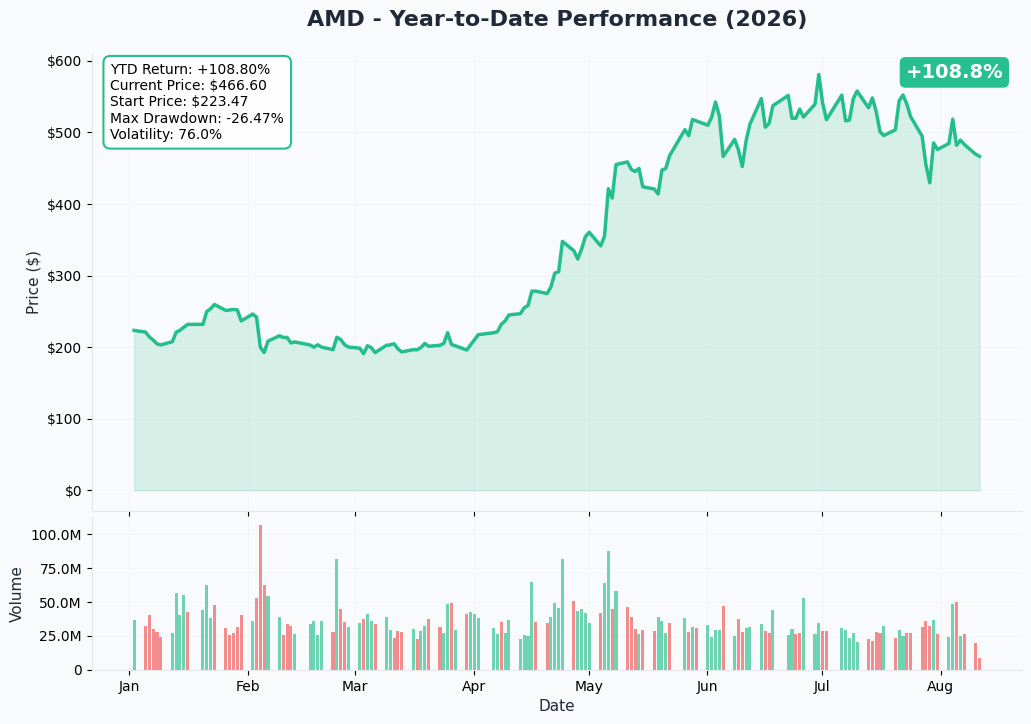
AMD has had an enormous run over the past year — up ≈116% year-to-date and ≈171% over 52 weeks, per StockAnalysis — before pulling back ≈19.8% from its $584.73 high. That combination (big run, still-elevated valuation, high beta) is exactly the setup where selling rich at-the-money call premium becomes an attractive trade for a seller, and exactly the setup where being short calls carries real risk if the run resumes.
Gamma-Based Support & Resistance
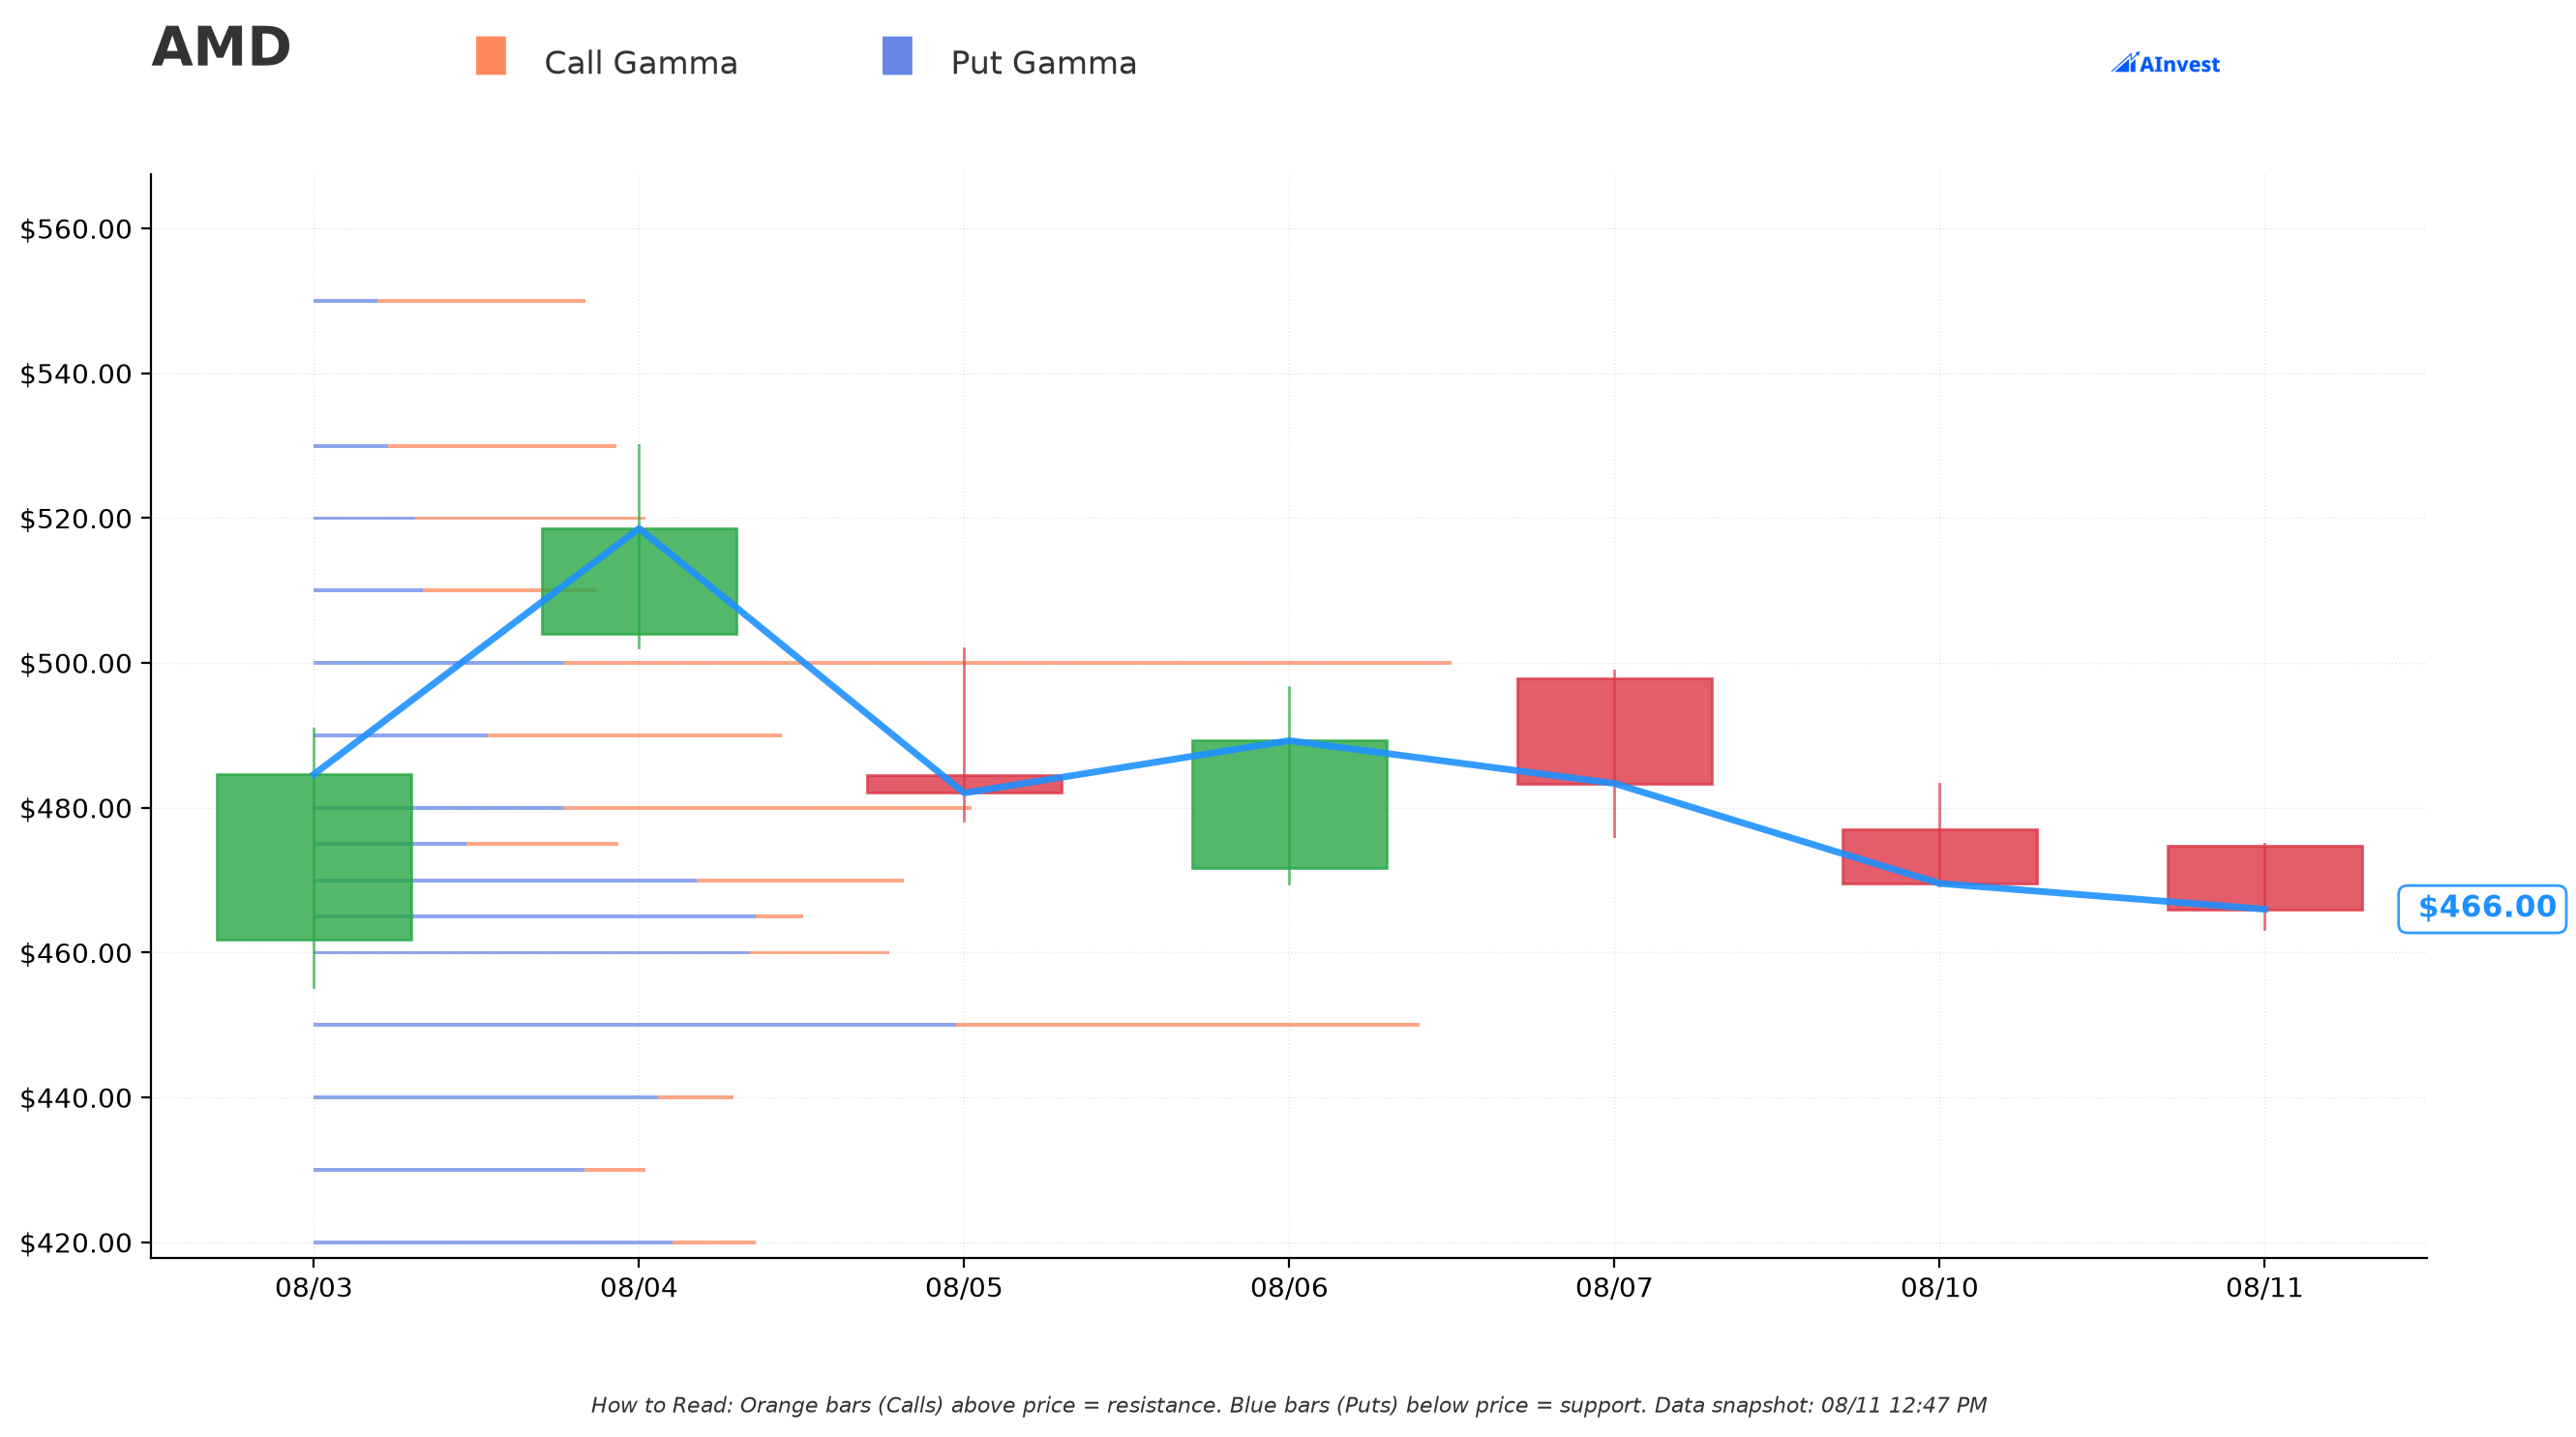
Reading gex.json as of this snapshot (spot ≈$465.89):
- 🟠 $470 is itself a "Resistance Wall" (total gamma exposure ≈$7.08B, "Strong," just ≈0.9% above spot) — the exact strike that was sold sits right where dealer positioning already creates resistance/pinning pressure. That reinforces the short call's core thesis: the market's own gamma structure is fighting a big move through $470.
- 🟠 $500 is the single largest gamma wall on the board — "Very Strong," ≈$13.67B total exposure, ≈7.3% above spot. That's exactly the strike the desk bought as tail cover, which means it doubles as a real technical resistance level in its own right — a level AMD would need real force to punch through inside 10 days.
- 🔵 Support sits at $465 (Strong, essentially at-the-money) and $460 (Strong), with $450 as a "Very Strong" support wall ≈3.4% below spot and $400 as a deeper support wall further down.
Implied Move
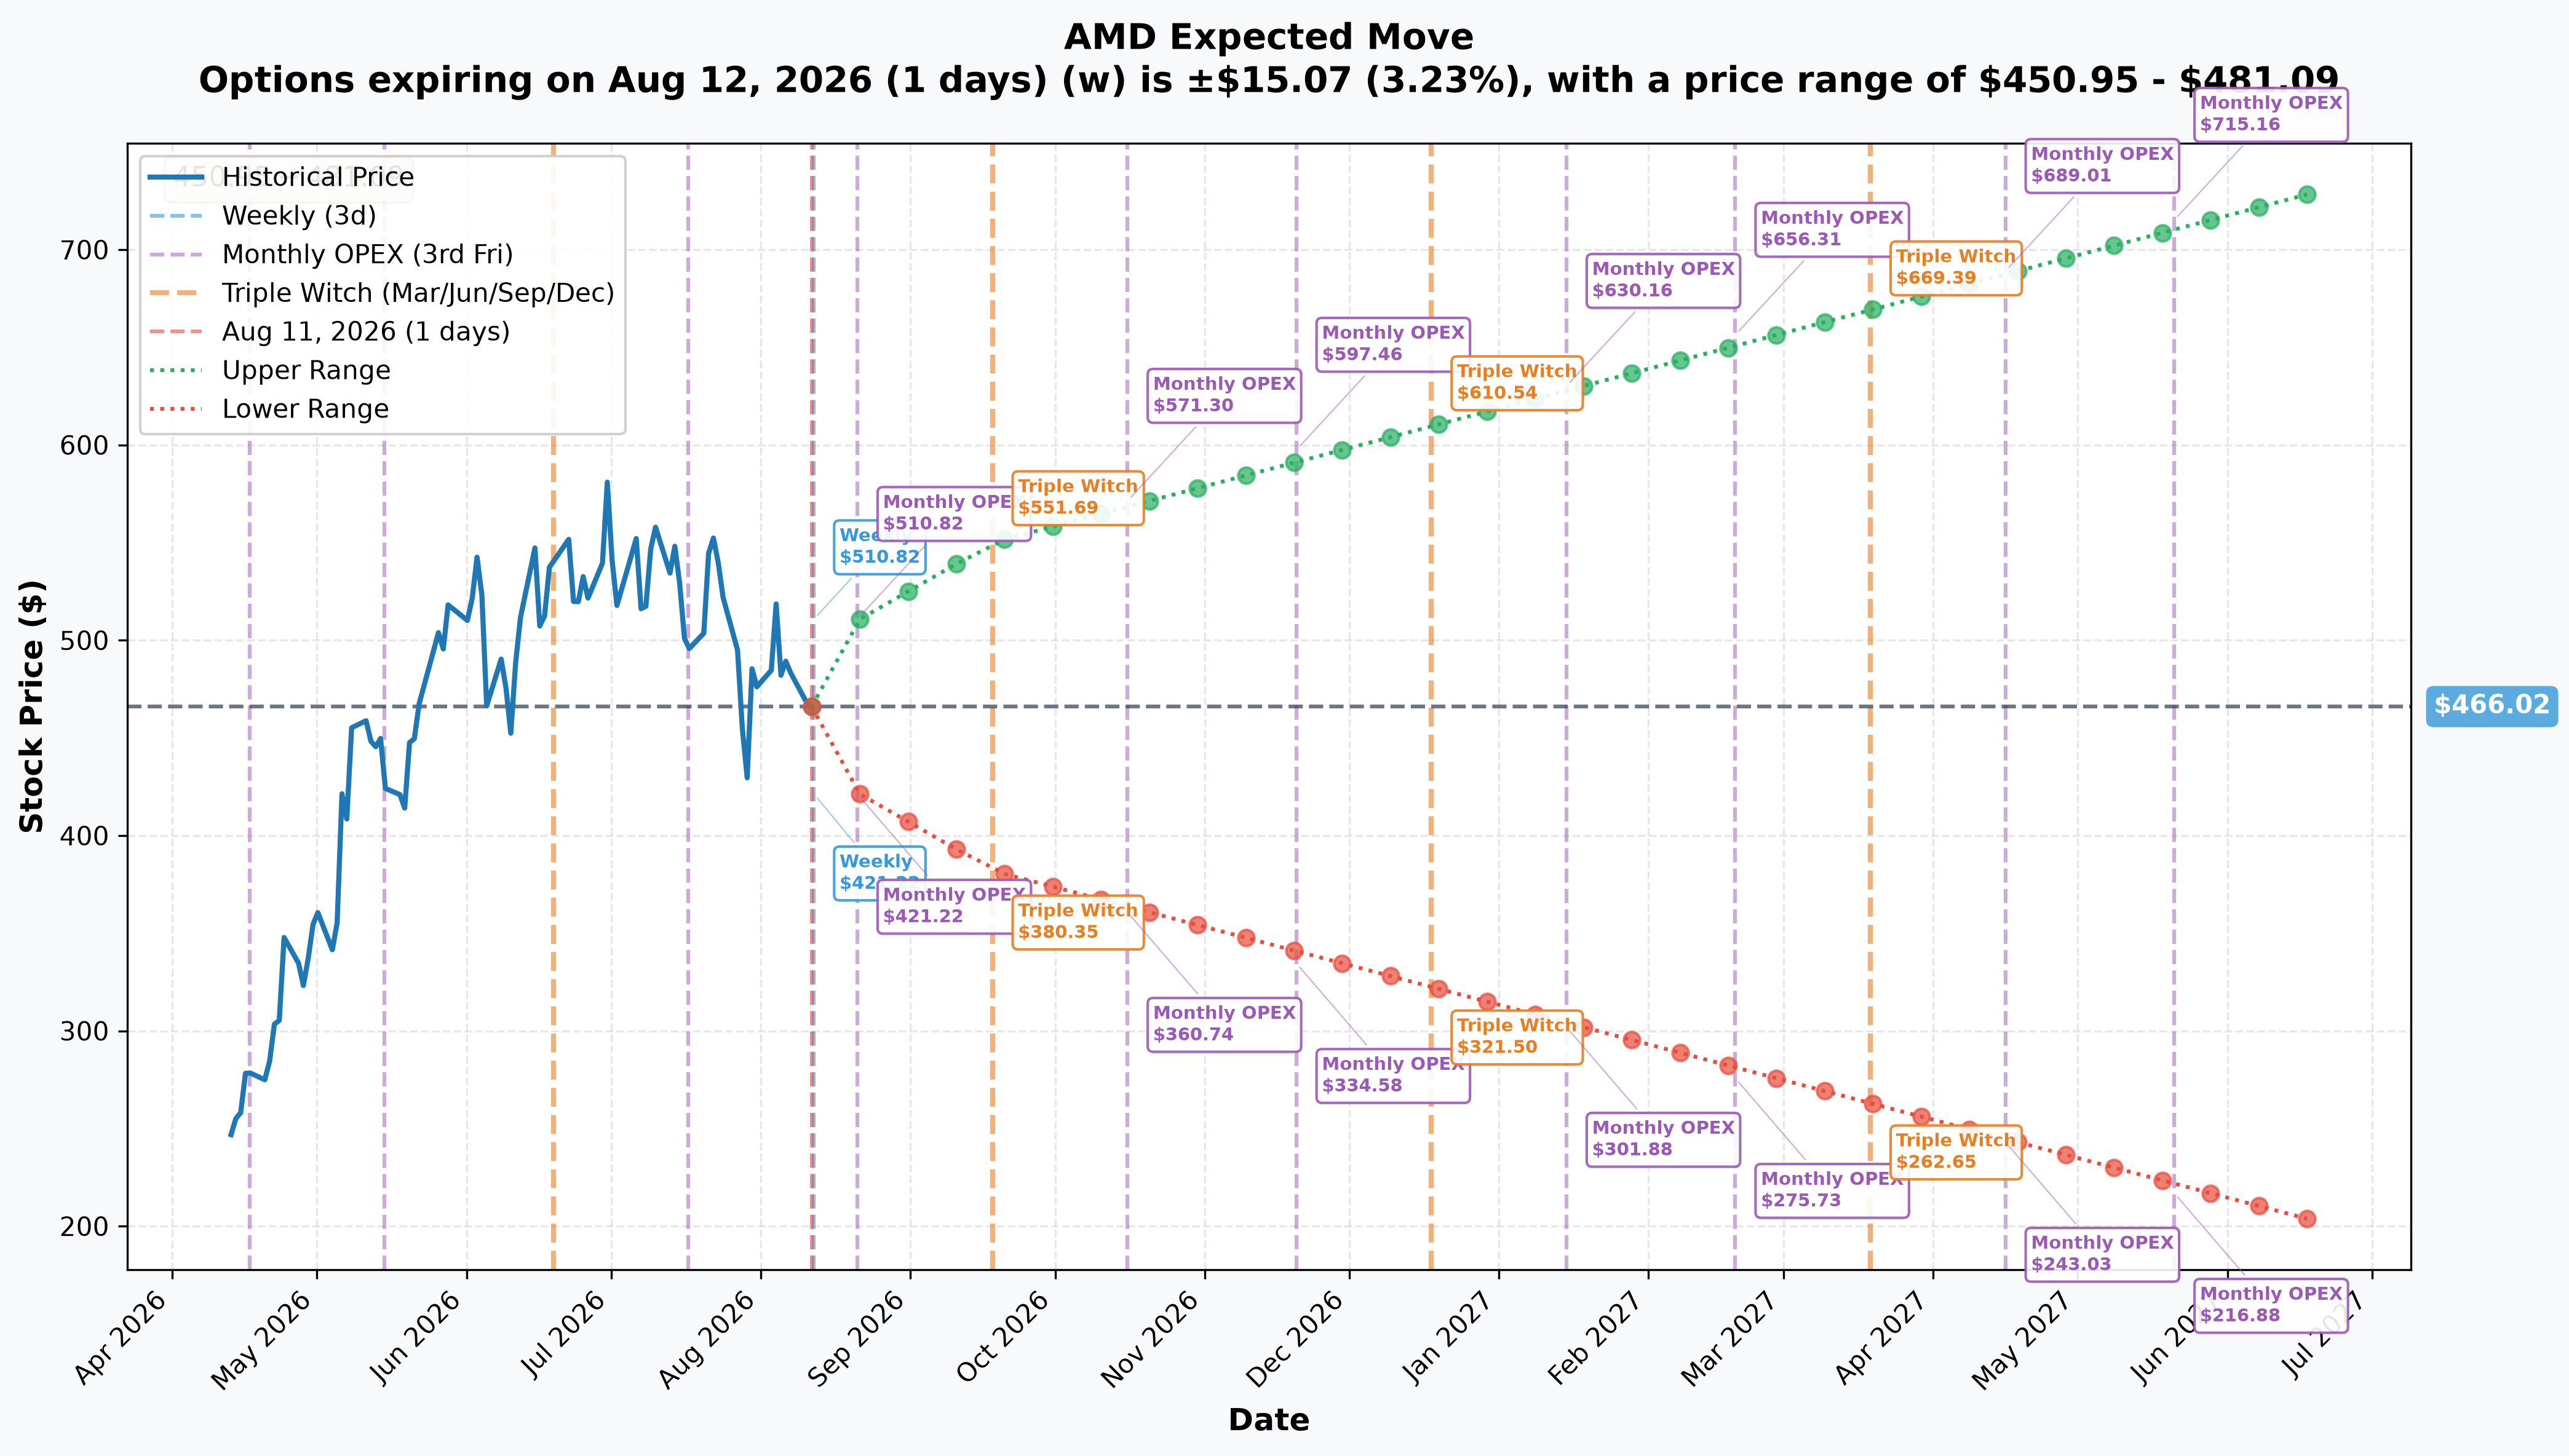
From AMD_implied_move.json:
- August 21 expiry (10 days): implied move ≈±9.6% / ≈$44.80 → range $421.22 – $510.82. The bought $500 call sits inside this one-standard-deviation range but close to its upper edge — hitting it needs most of the market's expected 10-day move.
- September 18 expiry (38 days): implied move ≈±18.1% / ≈$84.36 → range $381.66 – $550.38. The sold $470 strike sits almost dead-center of that range — which is exactly why an at-the-money call 38 days out carries such a rich premium: the market is already pricing a wide potential outcome, and the seller is being paid for underwriting that width.
🎪 Catalysts — Lead With the Calendar
The single most important fact for this trade: both expirations sit in windows with no AMD earnings report.
- AMD already reported. Q2 2026 results came out after the close on August 4, 2026 — revenue $11.536B (+50% YoY), Data Center +107% to $6.718B, non-GAAP EPS $1.66 (+246% YoY), with Q3 guidance of ≈$13.0B above the Street's ≈$12.4B, per MarketBeat.
- AMD's next earnings (Q3 2026) is not scheduled yet, but based on its own cadence lands in early November 2026 — ≈7 weeks after the September 18 expiration in this trade, per MarketBeat's earnings history. Both the August 21 and September 18 contracts expire before AMD next reports.
Already Happened (last ≈3 months)
- August 4: Q2 2026 earnings beat — see above, AMD's release.
- July 20 – 23: a dense run of AI infrastructure news — Microsoft deploying Helios/MI455X and 6th-gen EPYC "Venice", Anthropic committing to up to 2 gigawatts of MI450-series GPUs plus an AMD equity investment of up to $5B, and the AAI 2026 platform launch putting Helios into production with deployments starting Q4 2026.
- August 6: AMD signed a definitive agreement to acquire Taalas, an AI-inference-silicon company — deal value undisclosed.
- 10-Q disclosure (filed for the quarter ended June 27, 2026): OpenAI and Meta each hold warrants for up to 160 million AMD shares at $0.01 — 320 million shares combined, ≈19.6% of the 1.63 billion shares outstanding — vesting on Instinct GPU purchase milestones and stock-price/performance thresholds. As of the filing, no tranches had vested. That's a real, price-conditional dilution overhang sitting quietly behind the AI narrative.
Ahead — Inside the Traded Windows
- August 21, 2026 expiration: ⛔ no scheduled AMD company catalyst between today and this date. It is a pure calendar-empty window for the bought leg.
- August 23–25, 2026: Hot Chips 2026 — AMD presents the Instinct MI400 Series GPU and system architecture (Monday, Aug 24). Technical event, rarely a large standalone price mover. Falls inside the September window, two days after the August contract expires. Hot Chips
- August 26, 2026: NVIDIA earnings — realistically the largest single volatility source inside the September window, via AI-capex read-through, but it is NVIDIA's event, not AMD's.
- September 8 and 11, 2026: Citi and Goldman Sachs investor conference appearances, per AMD IR.
- September 18, 2026: quadruple witching / quarterly index rebalance — the same date as the sold call's expiration, which typically adds pinning pressure and elevated volume independent of anything AMD-specific.
👤 Four Ways to Read This
🎰 YOLO Trader
If you want to fade this desk's view and bet AMD does rip through $470 by September, the cleanest way to express that without stepping in front of a large short-call position is buying your own out-of-the-money call in a window with a real catalyst — not replicating this trade. Note that Hot Chips and NVIDIA's August 26 print both sit inside the September window as potential sympathy-move triggers even though neither is AMD's own earnings. If you're tempted to sell premium the way this desk did, understand you'd be taking on the same open-ended risk after August 21 that this desk just accepted — position size accordingly and never undefined-risk short calls without a plan.
📊 Swing Trader
The interesting technical read here is that the market's own gamma structure agrees with the short call's thesis: $470 is already a resistance wall, and $500 — the strike bought as tail cover — is the single strongest gamma wall on the board. A swing trader watching $465–$470 as a pivot zone, with $500 as the next real technical ceiling and $450 as a "Very Strong" support wall on pullbacks, is reading the same map this trade is implicitly betting on.
💰 Premium Collector
This trade is, in spirit, a premium-collection idea done at institutional size — sell rich at-the-money time value, buy a cheap tail hedge with a small slice of the proceeds. The lesson worth taking, not the trade itself: the desk deliberately avoided selling through AMD's next earnings report (both legs expire before Q3 results), which is a disciplined way to collect premium without also underwriting an earnings gap. If collecting premium on AMD appeals to you, that same earnings-avoidance logic is worth copying — and consider a same-expiration, defined-risk spread instead of a cross-expiration diagonal, so your risk doesn't go uncapped once one leg expires.
🌱 Beginner
Two things to take away without needing to trade this yourself. First, "selling a call" means collecting cash up front in exchange for capping your upside if the stock rallies past the strike — here, someone collected ≈$27.5M doing exactly that on AMD's September $470 call, and used less than a quarter of it to buy a small, cheap "insurance" call further out. Second, big-dollar options trades are not automatically bullish or bearish just because the total premium is large — this $21.28M net credit is a bet that AMD doesn't run away to the upside through September, not a bet that it will.
⚠️ Honest Limits — What the Tape Cannot Prove
- The August $500 call's open/close status is genuinely unresolved from today's tape (size below prior OI). Do not treat the "BTO" label as final until tomorrow's OI print.
- OPRA cannot identify the broker, the counterparty, or whether either leg is hedged elsewhere (stock, futures, or other option positions we cannot see). "Reverse diagonal" describes the visible package; we cannot rule out that it is one piece of a larger, invisible book.
- The bid/ask pricing detail (sold at bid, bought at ask) is a hint about the auction's internal pricing, not proof of directional aggression — a multi-leg auction allocates prices across the package as a whole.
- Gamma-wall levels and implied-move ranges are model outputs derived from open interest and quoted implied volatility, not observed dealer positioning — they describe where flow has clustered, not a guarantee of where price will go.
This analysis is for informational purposes only and is not investment advice. Options trading involves substantial risk, including the potential for rapid and unlimited losses on short, uncapped positions, and is not suitable for all investors.
Last updated: 2026-08-12 (pre-market) — the next-day OPRA open-interest snapshot resolved both legs. Sep-18 $470C 1,262 → 9,479 (+8,217 against an 8,075-lot sale): OPEN (STO), inside the published 8,000–9,600 window. Aug-21 $500C 13,291 → 11,417 (−1,874): not an open — the provisional BTO label is retired, the "cheap August tail cover" framing is withdrawn, and the structure is restated as a short-call roll down and out. The title, the trade table's order-type cell and the tail-cover framing were updated; the ⏳ callout was replaced with the ✅ RESOLVED box.