🐻 AR $2.4M Cheap Downside Put — A Bearish Hedge on a Nat-Gas Name Ahead of July Earnings
📅 June 15, 2026 | 🔥 Unusual Activity Detected
✅ Updated 2026-06-16: Next-day OPRA OI confirms a clean open — the Aug $30 put rose 149 → 48,759 (Δ +48,610 ≈ the 48,000 traded). Fresh bearish/hedge put position confirmed.
🎯 The Quick Take
Someone just spent ≈$2.4M to buy nearly 48,000 put contracts on Antero Resources (AR) — the largest U.S. NGL exporter and a pure-play Appalachian gas producer — targeting the $30 strike expiring August 21, 2026. With AR trading at ≈$34.84, the $30 strike sits ≈14% out of the money: this is cheap tail-risk protection, not a high-conviction "AR is going to $30" call. The structure — huge size, pennies-per-contract premium, Q2 earnings (July 29) squarely inside the window — reads as either a bearish overlay or a portfolio hedge from someone who thinks the natural gas storage glut, soft Henry Hub prices, and China's 84% propane tariff could bite AR before the August expiry.
📊 Company Overview
Antero Resources (AR) is one of the largest natural gas and natural gas liquids (NGL) producers in the U.S., operating entirely in the Appalachian Basin (Marcellus and Utica shales in West Virginia and Ohio):
- Market Cap: ≈$10.8B (≈310M shares × ≈$34.84)
- Sector / Industry: Energy — Oil & Gas Exploration & Production (E&P)
- What they do: Antero drills for and produces dry natural gas and NGL (propane, ethane, butane). They are the largest U.S. NGL exporter, sending a significant portion of their propane and ethane to international markets, particularly Asia. That NGL export tilt is both AR's differentiator and its specific vulnerability to China trade policy.
- Recent performance: Q1 2026 was a monster — $1.95B revenue vs. ≈$1.63B expected, EPS $1.72 vs. $1.17 consensus, free cash flow ≈$674.5M — yet the stock fell ≈3% on earnings day, a classic "buy the rumor, sell the news" in a soft gas-price environment. The median analyst price target is ≈$46, well above current levels.
💰 The Option Flow Breakdown
The Tape — June 15, 2026 @ 09:40:23: 🤝 Multi-leg Auction
| Time | Buy/Sell | Call/Put | Expiration | Premium | Strike | Volume | OI | Size | Spot | Option Price | Option Symbol |
|---|---|---|---|---|---|---|---|---|---|---|---|
| 09:40:23 | BUY | PUT | 2026-08-21 | ≈$2.4M | $30 | 48,000 | 149 | 47,966 | $34.84 | $0.49 | AR20260821P30 |
Flow type: 🤝 Multi-leg Auction — this was a facilitated, complex-order auction routed through an exchange price-improvement mechanism. A paired leg exists on the other side of this structure. This is not a lit sweep (no one urgently hammered the open order book) and not a block cross (no pre-arranged bilateral transaction). A desk worked this order deliberately through an auction to find liquidity for a large, cheap put position.
At just $0.49 per contract on a stock at ≈$34.84, each contract controls the downside of 100 shares from $30 — paying ≈1.4% of the stock's value for a ≈14% OTM hedge. That's the economics of tail-risk protection: cheap individually, significant in aggregate.
✅ RESOLVED — Next-Day OI Confirms a Clean Open (2026-06-16)
| Leg | Pre-print baseline (EOD 2026-06-12) | Resolving (EOD 2026-06-15) | Δ | Verdict |
|---|---|---|---|---|
| Aug-21 $30P | 149 | 48,759 | +48,610 | OPEN — fresh bearish/hedge put confirmed |
The next-morning OPRA snapshot confirms a textbook open: open interest exploded from 149 to 48,759, a +48,610 rise that matches the 48,000 puts traded. This is a brand-new bearish/hedge position on natural gas — fresh contracts, not a transfer or a close.
🤓 What This Actually Means — Plain English
Let's cut through the jargon.
Buying a put option means you're paying for the right — but not the obligation — to sell AR stock at $30 anytime before August 21, 2026. The buyer paid just $0.49 per share (per contract = $49 total) for that right on 47,966 contracts, totaling ≈$2.4M spent.
Here's the math that matters:
- AR spot: ≈$34.84
- Put strike: $30 (the price where the put kicks in)
- Gap to strike: ≈$4.84, or ≈14% OTM — the stock has to fall 14% just to reach the strike
- Breakeven at expiry: $30 − $0.49 = ≈$29.51 — AR would need to be below $29.51 on August 21 for the put buyer to profit at expiry
- Max profit: if AR goes to zero (not realistic, but theoretically $29.51 per share × 47,966 contracts × 100 = ≈$141.7M gross upside cap)
- Max loss: the $2.4M paid. That's it. No matter what AR does to the upside, the put buyer loses only what they spent.
Why spend $2.4M on a 14% OTM put? Two possibilities — and both are legitimate reads on the same trade:
-
Bearish directional bet: The buyer thinks AR could drop toward $30 (or below) before August 21 — driven by a weak Q2 earnings print on July 29, continued gas oversupply, or the China tariff hitting NGL realizations.
-
Portfolio hedge: Someone who owns a lot of AR stock (or energy names broadly) bought downside protection at pennies on the dollar. If AR drops 20%, the put gains significant value and offsets losses in the underlying stock position. Think of it like cheap insurance.
The ≈14% OTM structure, the $0.49 price tag, and the multi-leg auction mechanism all push toward the hedge / bearish overlay interpretation rather than a high-conviction "AR is going to collapse" directional bet. This is tail-risk money, not "I know something" money.
Order type: BTO — Buy to Open. The size-vs-OI math (47,966 vs. 149) makes this a confirmed fresh long-put position. The maximum risk to the buyer is the ≈$2.4M premium paid.
One more thing worth noting: Barclays' analyst Betty Jiang recently lowered her price target to $30 — the exact strike of this put. The low end of the Street's published price target range sits at $26–$30. The put buyer may be expressing a view that the bear analysts are right.
📈 Technical Setup / Chart Check-Up
YTD Performance
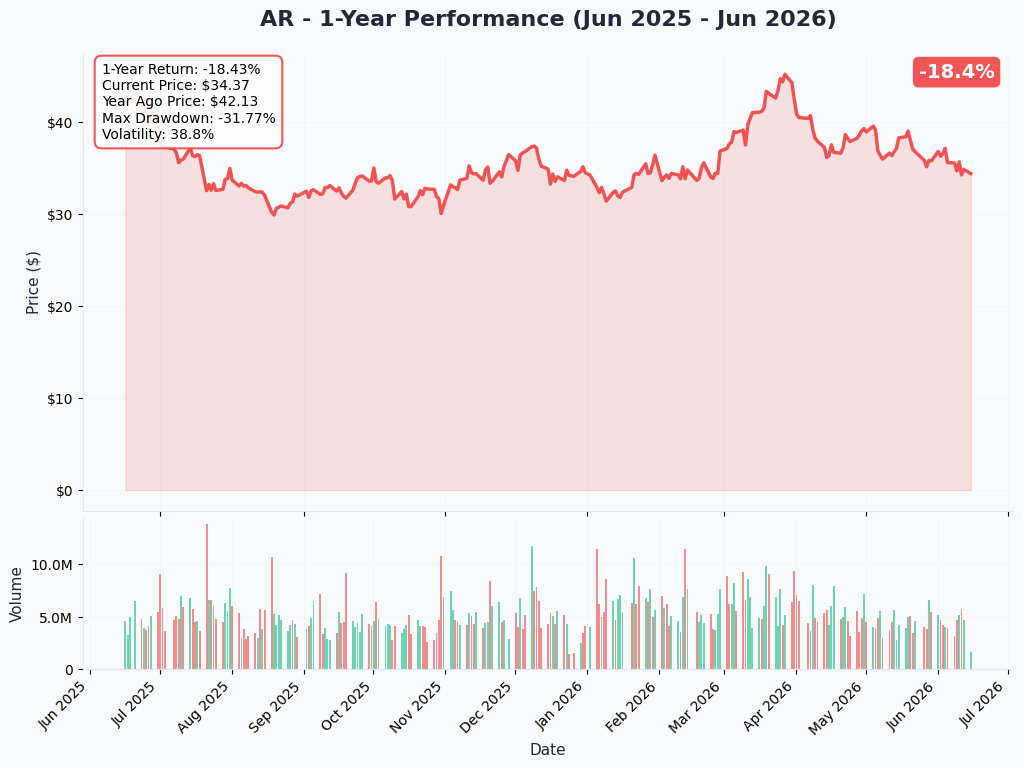
AR has been on a rollercoaster in 2026, reflecting the volatile nat-gas backdrop. The stock recovered sharply into the Q1 earnings beat in April, then pulled back as Henry Hub softened into early summer. At ≈$34.84, AR sits well above the $30 put strike but below the bulk of analyst targets — a middle ground where the market is essentially saying "good company, uncertain commodity."
Key observations:
- 📊 Despite a massive Q1 beat (EPS +47%), the stock fell ≈3% on the day — the market is discounting AR's fundamentals through the lens of soft gas prices
- 📉 Henry Hub at ≈$3.09 is the anchor weighing on the whole Appalachian gas complex
- 🎯 The $30 level corresponds to Barclays' freshly lowered price target and the bottom of the Street's published range
Gamma-Based Support & Resistance
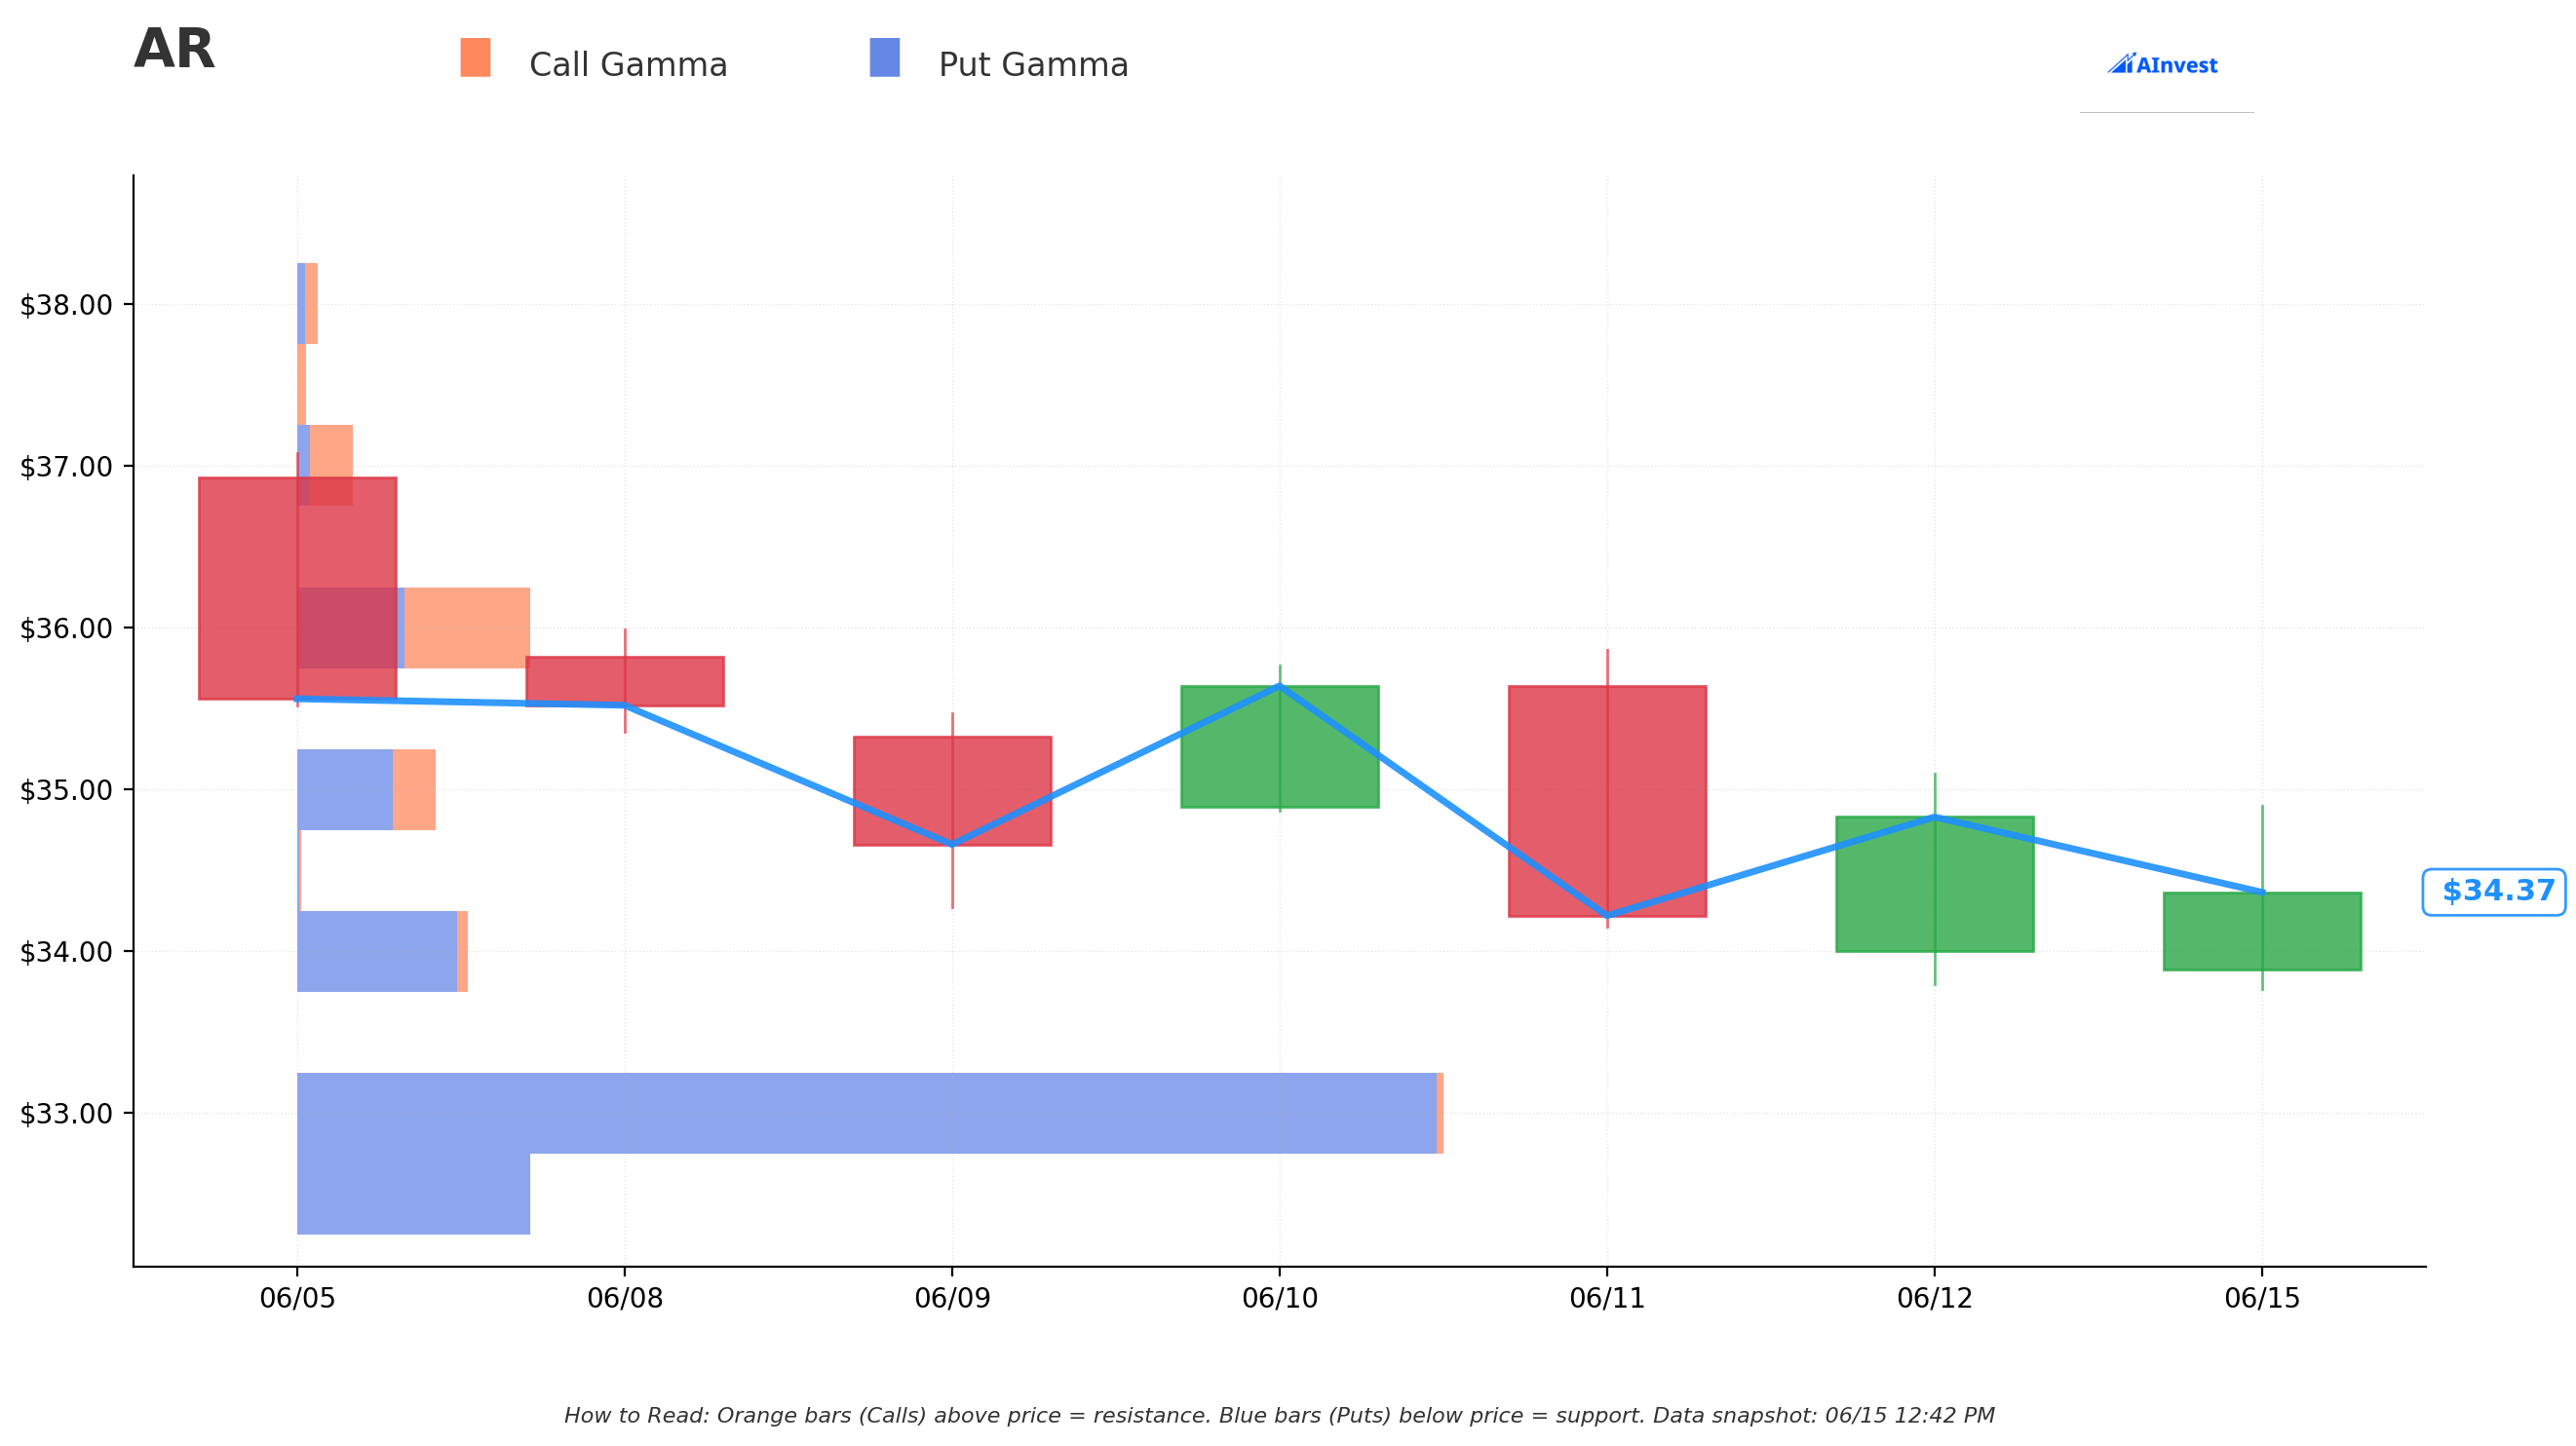
Current Price: ≈$34.84 | Gamma Spot Reference: ≈$34.40
The gamma exposure map around AR's current price shows clear structural levels:
🔵 Support Levels (Put Gamma Below Price):
- $33 — Key Gamma Support. This is the nearest put-gamma cluster below current price. Market makers who are short puts at $33 will tend to buy shares as AR approaches this level, creating a natural cushion. If AR dips toward $33, expect some mechanical buying to slow the slide.
🟠 Resistance Levels (Call Gamma Above Price):
- $36 — Near-Term Gamma Resistance. Call gamma is concentrated above at $36. As AR pushes toward $36, market makers will be selling shares to hedge their short call exposure — a natural ceiling that has to be cleared for a sustained move higher.
Translation for traders: AR is currently sandwiched in a $33–$36 gamma corridor. The $30 put sits below the $33 support floor — meaning AR would have to break through that support level and accelerate lower for the August-21 puts to come into meaningful play. That's consistent with the tail-risk / hedge read: the put buyer isn't betting on a minor dip to $33; they're betting on (or protecting against) a more significant break.
Implied Move Analysis
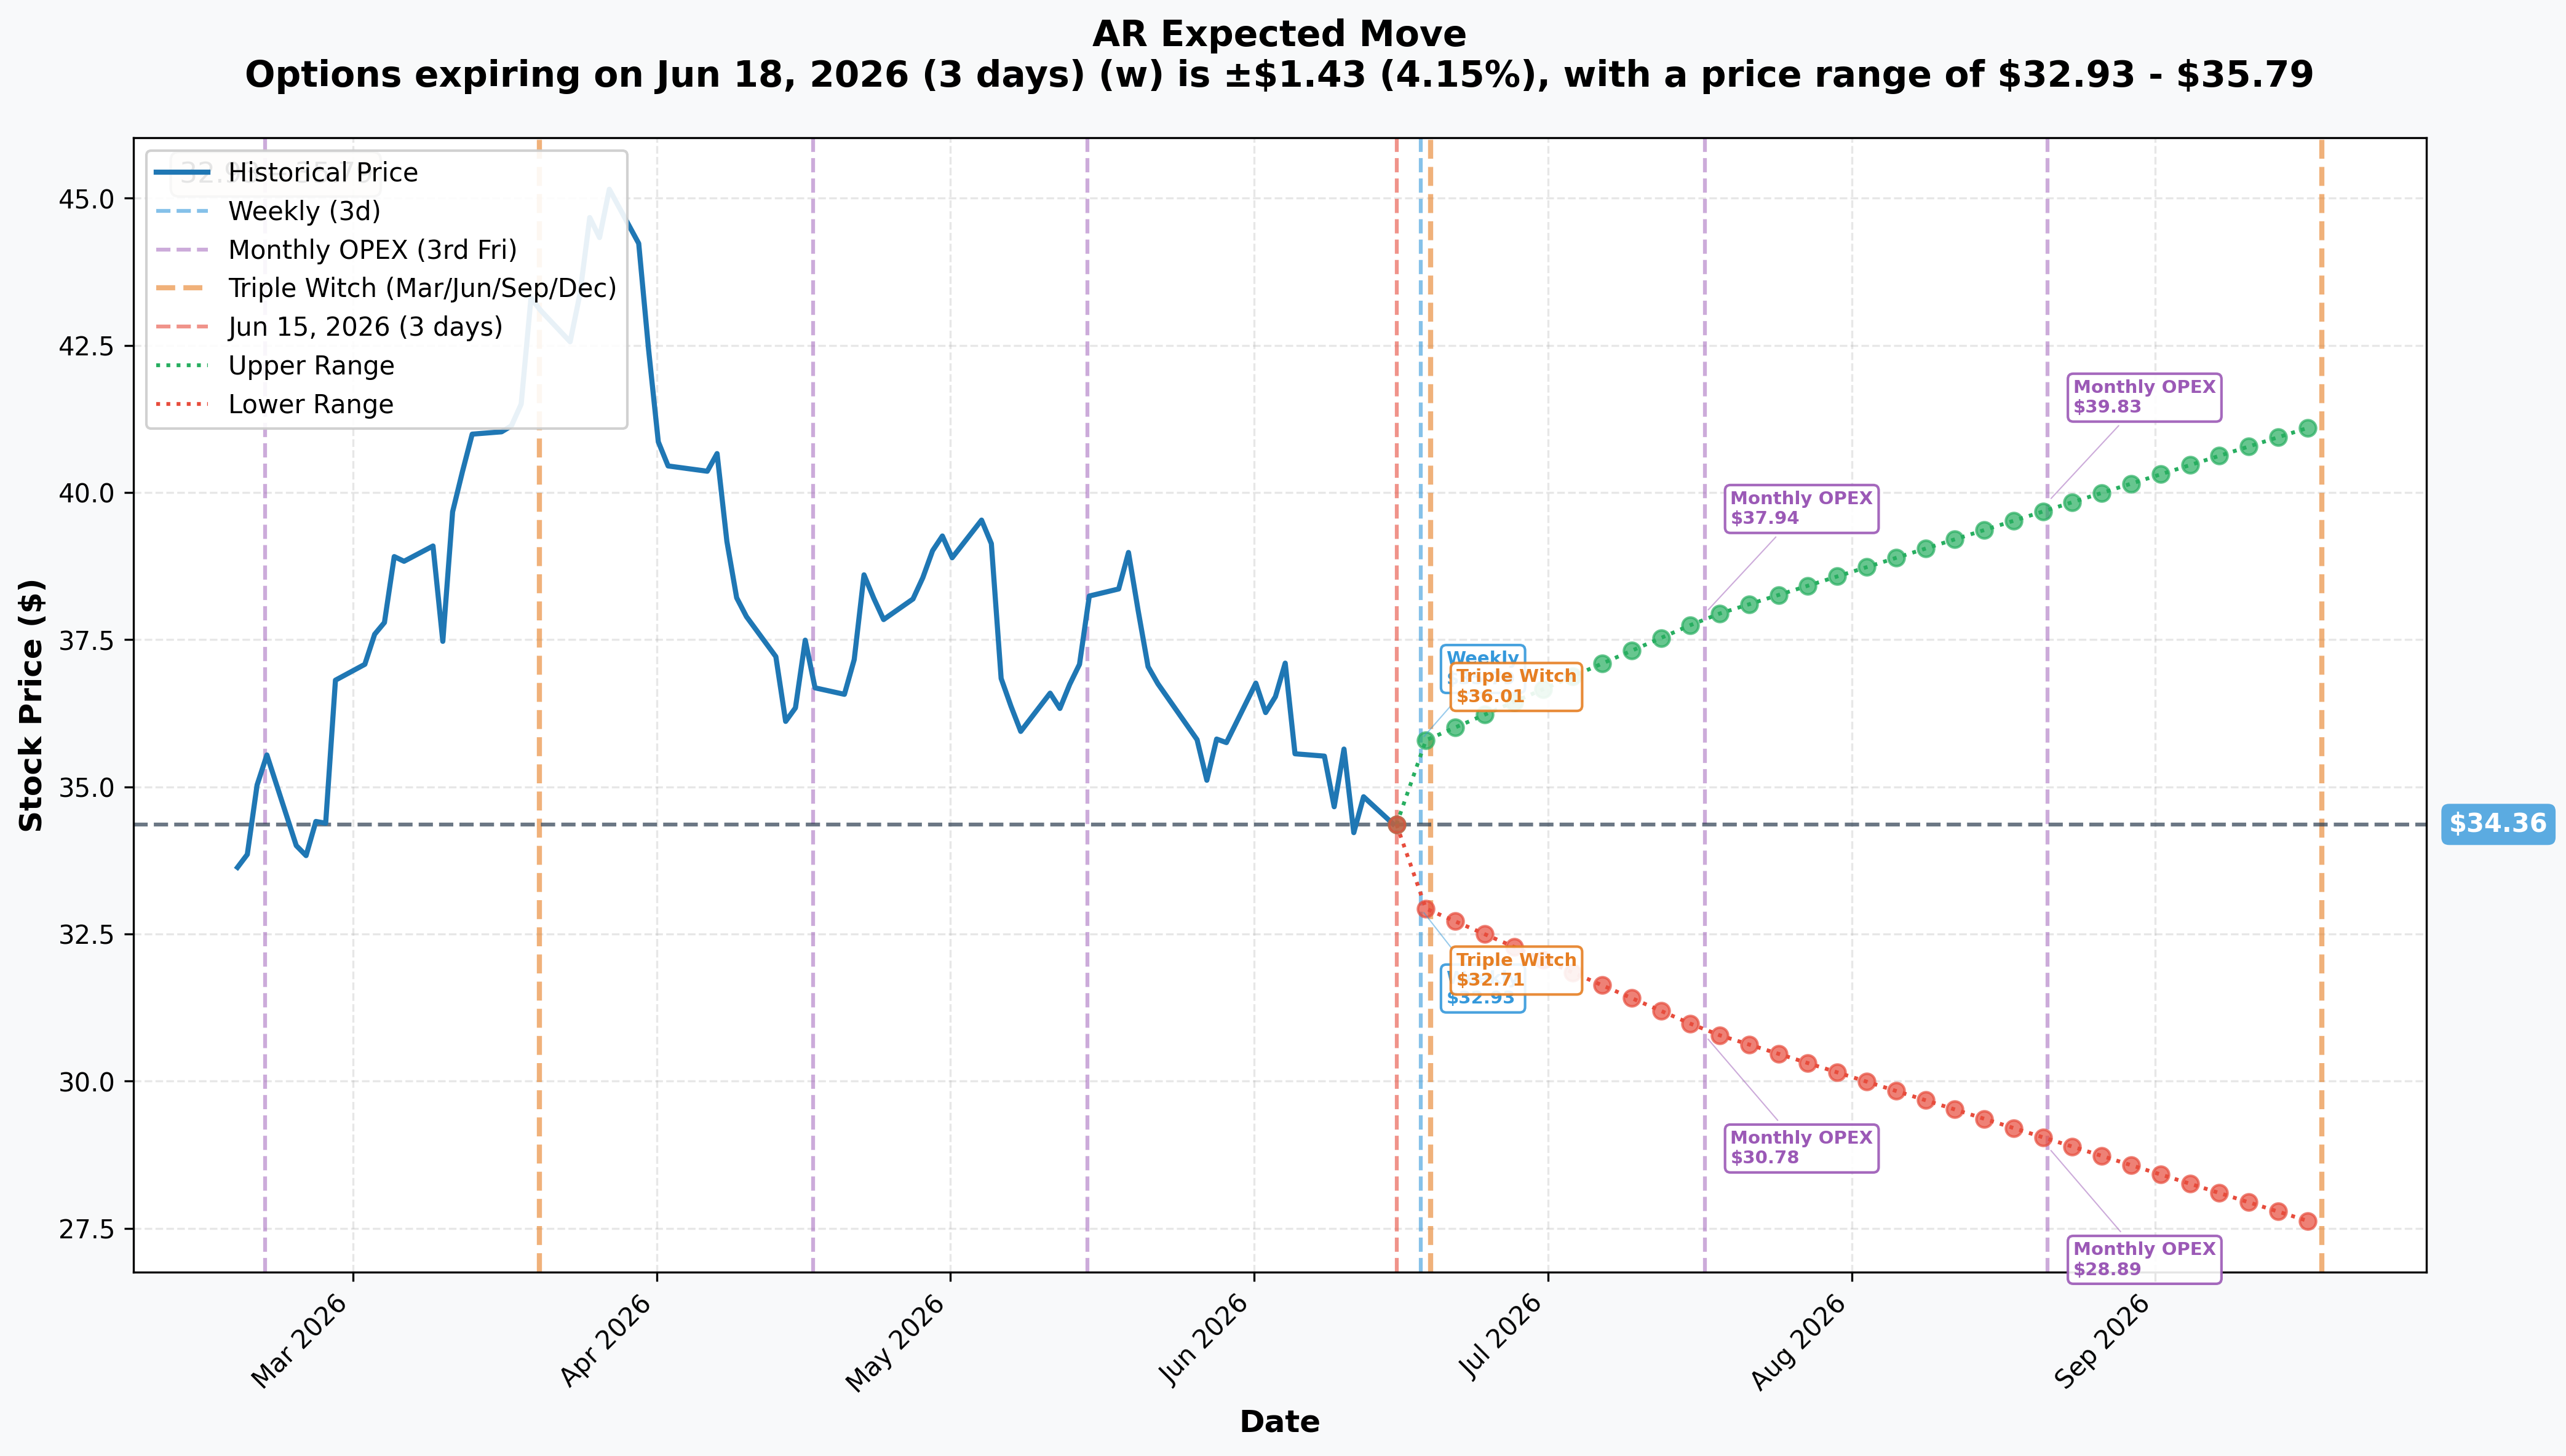
The options market is pricing meaningful uncertainty into AR across time horizons, with Q2 earnings (July 29) anchoring the volatility curve:
- 📅 Monthly (exp 2026-07-17, 32 days): ±10.26% → Range $30.83 – $37.89
- 📅 Quarterly (exp 2026-09-18, 95 days): ±19.9% → Range $27.52 – $41.20
The $30 strike sits just below the lower bound of the monthly implied move range ($30.83). In other words, the options market itself says a move to $30 in 32 days is at the outer edge of what's priced in — not the base case, but not impossible either. By the quarterly expiry, the range widens enough that AR reaching $27.52 is within the probability cone.
Key takeaway: The $30 August-21 put is structured to pay off on a scenario the options market considers unlikely but real — a ≈15%+ drop from current levels. That's consistent with a hedge rather than a probable-payout directional trade.
🎪 Catalysts
Upcoming Catalysts (What Drives This Put)
Q2 2026 Earnings — July 29, 2026, After Close 📅 (CONFIRMED)
This is the dominant event inside the August-21 option window. Nasdaq and TipRanks both confirm the date. Watch for:
- Realized gas differential vs. Henry Hub (did AR beat the soft spot price?)
- C3+ NGL premium vs. the China tariff drag on propane realizations
- Progress toward the ≤1.0x leverage target and any announcement of the buyback pivot
- Any revision to the ≈$3.34/MMBtu 2H26 gas assumption baked into current guidance
Weekly EIA Storage Reports (Every Thursday)
With inventories sitting ≈6% above the five-year average at 2.686 Tcf, every above-consensus injection print is an incremental bearish tick for Henry Hub — and for AR. The EIA added 108 Bcf last week vs. 101 Bcf expected, continuing the surplus trend. Weekly storage prints between now and July 29 will set the tone heading into earnings.
EIA Monthly Short-Term Energy Outlook (≈Mid-July, ≈Mid-August)
The EIA STEO is the market's gas-price scorecard. Any downward revision to the 2H26 average gas price estimate (currently ≈$3.34/MMBtu per EIA) would be incrementally bearish for AR.
Already Happened (Supporting Both Cases)
Q1 2026 Earnings Beat (Reported Late April 2026) Revenue $1.95B vs. ≈$1.63B estimate (+19.6% beat); EPS $1.72 vs. $1.17 consensus (+47% beat); free cash flow ≈$674.5M; adjusted EBITDA $948.5M vs. ≈$706.4M estimate (+34% beat). Operationally, AR is executing extremely well — the risk is the commodity tape, not the company.
Record Production: 347 Bcfe in Q1 2026 ≈3,852 MMcfe/d combined daily output — a new production record, cementing AR's scale in the Appalachian Basin.
Deleveraging Pivot Coming Early AR now expects to hit its ≤1.0x leverage target by mid-2026, six months ahead of schedule, then pivot to opportunistic buybacks. That's a shareholder-return catalyst on the horizon — but it depends on gas prices cooperating.
Analyst Upgrades (Bull Case Markers) Multiple analysts raised targets after Q1: Truist to $38 from $28; Mizuho to $37 from $29; BMO to $40; Jefferies maintains Buy at $54. The bull community is clearly on-side.
China's 84% Propane Tariff — AR-Specific Headwind AR is the largest U.S. NGL exporter, which makes it uniquely exposed to the China trade war. OPIS notes the tariff can "devastate PDH economics" and is forcing lower U.S. propane intake; RBN Energy warns the US-China trade war has "potential to devastate propane/ethane markets". This is a direct hit to AR's NGL-export premium — the very thesis that differentiates AR from its gassier peers.
LNG Demand as the Bull Counterweight Corpus Christi Stage 3 is on track for full delivery by end-2026; Golden Pass LNG is starting up; EIA sees 2026 LNG exports averaging 17.0 Bcf/d, a new record. Winter feedgas demand already hit >20 Bcf/d, ≈5 Bcf/d above a year ago. If summer heat or continued LNG ramp draws down storage faster than expected, Henry Hub could firm meaningfully — and the put thesis weakens.
🎲 4-Reader Interpretation
🚀 YOLO Trader
Here's the deal: the existing Aug-21 $30 put structure was bought at $0.49 / contract. If you're bearish on AR into earnings (July 29), these same puts are your vehicle — cheap, defined-risk, and leveraged to a significant downside move. But understand the math: AR needs to fall to ≈$29.51 or below by August 21 for you to profit at expiry. That's a ≈15% drop from current levels. You're not buying a high-probability trade — you're buying a cheap lottery ticket on a bad earnings + gas glut combo. Size it accordingly (i.e., money you can afford to lose entirely).
📊 Swing Trader
The $33 gamma support is your key tactical level. If AR breaks below $33 with conviction — especially around a weak earnings print on July 29 or a bad EIA storage number — the downside toward the $30 zone opens up technically. A breakdown below $33 would also remove the mechanical gamma cushion. For a swing setup, watch for a confirmed close below $33 on volume, then consider either stock shorts with tight stops or put spreads (e.g., the Aug $33/$30 put spread) to limit your cost basis vs. the outright $30 put. The July 29 earnings date should anchor your sizing — binary event, don't go full-size into it.
🛡️ Premium Collector
With AR pinned in the $33–$36 gamma channel, cash-secured puts at the $33 gamma-support strike in the near term (July expiry, before earnings) could generate income if you're comfortable owning AR near support. Critically: exit or hedge before July 29 earnings — selling puts into a binary event without protection is the kind of trade that blows up premium-collection accounts. If you want to stay in through earnings, sell a put spread (sell the $33 put, buy the $30 put) to define your downside exposure.
🌱 Entry-Level / Beginner
Here is what happened in plain English: someone spent ≈$2.4M to buy "insurance" that pays out if Antero Resources stock falls from ≈$34.84 today to below $30 by August 21. They paid only $0.49 per contract — very cheap per unit, but they bought nearly 48,000 contracts, so it added up to $2.4M. The most they can lose is that $2.4M. The most they can make is if AR collapses well below $30. This is what options traders call "buying downside protection" — like buying car insurance you hope you never need to use. The key thing to understand: with AR at $34.84 and the strike at $30, the stock has to drop ≈15% before this trade reaches breakeven. That's not a base-case bet — it's protection against a bad scenario (a weak earnings report on July 29 or a continued gas-price slide).
⚠️ Risk Factors
Options trading involves substantial risk. Here are the specific two-sided risks for this trade and the AR thesis:
The Bear Case (What the Put Is Hedging) — Real and Near-Term
❗ Gas oversupply / storage glut: EIA inventories at 2.686 Tcf, ≈6% above the five-year average, with end-October stocks projected to exceed the five-year maximum. Henry Hub at ≈$3.09 and EIA projects only ≈$3.34/MMBtu in 2H26 — limited upside for the commodity underpinning AR's cash flows.
❗ China's 84% propane tariff hits AR's NGL-export premium directly. AR earned a $0.94/bbl premium on C3+ NGL in Q1 2026. That premium shrinks if Chinese PDH plants reduce U.S. propane intake in response to the tariff — a risk OPIS and RBN Energy both flag as significant.
❗ Hedge cap limits gas-rally upside: >60% of AR's 2026 gas volumes are hedged. If Henry Hub rallies sharply on summer heat, AR captures only ≈40% of the upside — a mechanical cap on the bull case.
The Bull Case (What Makes the Put Expire Worthless) — Also Real
✅ Record LNG feedgas demand: EIA sees 2026 LNG exports at 17.0 Bcf/d average, with winter demand already at >20 Bcf/d. That structural demand driver is pulling gas out of the system faster than in prior years.
✅ Summer heat could accelerate storage drawdowns. EIA expects warmer-than-normal summer, with domestic gas demand ≈76.7 Bcf/d (+2.3% YoY). If heat spikes materialize, the storage surplus shrinks quickly — a catalyst that would push Henry Hub higher and lift AR.
✅ AR's FCF breakeven is now ≈$1.75/MMBtu. Even at $3.09 gas, AR is generating substantial free cash flow and is ahead of schedule on deleveraging. The company is not in financial distress — the put is hedging commodity weakness, not credit risk.
✅ Analyst consensus: 15 Buy / 6 Hold / 1 Sell, median PT $46. The Street is broadly bullish. If the macro clears, AR has significant re-rating potential toward those targets.
What the OPRA Tape CANNOT Tell Us: We know the mechanism (multi-leg auction), size (47,966 contracts), price ($0.49), and direction (BUY PUT). We do not know whether this is a standalone bearish bet or a hedge against a larger long AR/energy position, the buyer's identity, their existing portfolio, or their specific stop-out logic. A $2.4M put on a ≈$10.8B company could represent a desk hedging $200M+ of equity exposure at a cost of just ≈1.2% of that position. We interpret the tape; we do not read minds.
🎯 The Bottom Line
Here's the deal: a desk just paid ≈$2.4M for cheap downside insurance on Antero Resources — buying nearly 48,000 put contracts at the $30 strike expiring August 21. At just $0.49 per contract on a stock at ≈$34.84, this is tail-risk protection money, not a "conviction AR is going to crash" trade.
The setup is genuinely two-sided:
The bear case the put hedges: Henry Hub at ≈$3.09, storage ≈6% above the five-year average, China's 84% propane tariff hitting AR's biggest competitive advantage (its NGL-export premium), and a July 29 earnings date that could disappoint if gas and NGL realizations came in soft for Q2. Barclays already lowered their target to exactly $30. The risk is real.
The bull case that makes the put worthless at expiry: Record LNG feedgas demand (17.0 Bcf/d average for 2026), potential summer heat waves drawing down storage, AR's lower FCF breakeven (≈$1.75/MMBtu), an imminent deleveraging-to-buyback pivot, and a consensus analyst target of $46. Operationally, AR is firing on all cylinders — the commodity tape is the wild card.
What to watch:
- 📅 Every Thursday: EIA weekly storage report — above-consensus builds are bearish; below-consensus = bull thesis begins to work
- 📅 July 29, 2026 (after close): Q2 earnings — the make-or-break event inside the put window. Watch realized gas differential and C3+ NGL premium vs. the tariff drag
- 📅 ≈Mid-July: EIA Monthly Short-Term Energy Outlook — any downward gas-price revision = bearish for AR into earnings
- 📅 August 21, 2026: AR Aug-21 $30 Put expiry; needs AR below $29.51 to profit at expiry
- 📅 Tomorrow ≈06:30 ET: OPRA OI snapshot — confirm this as a fresh open (expected OI rises from 149 to ≈35,000–48,000)
If you're bullish on AR: The $33 gamma support level and the $46 analyst consensus target give you two reasons to hold through near-term weakness. The earnings print on July 29 is your binary risk event — consider a partial hedge (a put spread, not an outright short) if you're nervous. The put buyer may be wrong.
If you're bearish or hedging: The $30 put structure the desk chose is the playbook — cheap, defined-risk, positioned for a bad earnings + commodity combo. The $30 level aligns with Barclays' target and the low end of the Street's range. A breakdown below $33 gamma support is the first technical signal that the trade is working.
If you're watching from the sidelines: The key macro variable to monitor is natural gas storage. A sustained string of below-consensus EIA injections (especially in July) would be the clearest signal the gas glut is easing and the put thesis is fading. An above-consensus streak keeps the bear case alive into the July 29 earnings.
Cheap, ≈14% OTM puts on a well-run nat-gas company right before an earnings date — hedging is the smart read here, but the commodity tug-of-war makes this genuinely unpredictable. That uncertainty is exactly why the desk bought insurance.
Disclaimer: Options trading involves substantial risk of loss and is not suitable for all investors. This analysis is for educational and informational purposes only and does not constitute financial advice. Past unusual options activity does not guarantee future returns. The AR August 21, 2026 $30 put requires approximately 15% downside from the current price to reach breakeven at expiry, and can expire worthless — resulting in 100% loss of the ≈$2.4M premium paid. The analysis presented reflects the author's interpretation of OPRA tape data and publicly available information; it does not represent a buy or sell recommendation. Always conduct your own due diligence and consider consulting a licensed financial advisor before making any trading decisions. Open/close classification is based on size-vs-prior-OI inference and will be confirmed by next-day OPRA open interest data (≈06:30 ET).
Last updated: 2026-06-16 — next-day OPRA OI confirmed a clean open (+48,610).