🚀 ARM $10.66M Long-Dated Call Package — a 2.3-Year Bet That's 92% Time Value
📅 2026-08-12 | 🤝 Floor Block Detected
✅ Updated 2026-08-13 pre-market — the next-day OPRA open interest confirmed both legs, and both landed on our published numbers. The $250 line printed 551 against a predicted ≈553; the $500 line printed 777 against a predicted ≈761. Net new open interest of +398 and +616 against prints of 400 and 600 means this was a genuine fresh build with almost no transfer against existing holders. The BTO labels stand. See the ✅ RESOLVED box.
🎯 The Quick Take
At 09:40:09 ET a desk negotiated a floor block — a pre-arranged package worked off the lit book, known counterparty on the other side — buying 400 December 2028 $250 calls and 600 December 2028 $500 calls on Arm Holdings (ARM) for a combined ≈$10.66M. Both legs expire December 15, 2028 — roughly 2.3 years out, the longest-dated bet on today's board. Here's the number that matters most: ≈92% of that $10.66M is pure time value, not intrinsic value tied to today's price. This is not a bet on the next earnings print. It's a bet that Arm has time — years of it — for its royalty ramp to play out.
💰 The Option Flow Breakdown
📊 What Just Happened
- 🟢 BOUGHT 400x Dec-2028 $250 calls @ $136.08 → ≈$5.44M
- 🟢 BOUGHT 600x Dec-2028 $500 calls @ $86.92 → ≈$5.22M
- 🤝 Mechanism: floor block — a negotiated package with a known counterparty, not an aggressive lit sweep. No urgency here; someone worked this trade on the floor.
- 📅 Both legs expire the same day: December 15, 2028
- 💵 Spot at the print: $271.19
| Time | Buy/Sell | Call/Put | Expiration | Premium | Strike | Volume | OI | Size | Spot | Option Price | Option Symbol |
|---|---|---|---|---|---|---|---|---|---|---|---|
| 09:40:09 | BUY | CALL | 2028-12-15 | $5,443,200 | $250 | 400 | 153 | 400 | $271.19 | $136.08 | ARM20281215C250 |
| 09:40:09 | BUY | CALL | 2028-12-15 | $5,215,200 | $500 | 600 | 161 | 600 | $271.19 | $86.92 | ARM20281215C500 |
The intrinsic vs. time-value split — this is the whole story:
| Leg | Moneyness | Intrinsic | Time Value | % Time Value |
|---|---|---|---|---|
| $250 Call | ≈8% in the money | $21.19 | $114.89 | 84% |
| $500 Call | ≈84% out of the money | $0.00 | $86.92 | 100% |
| Package | — | $847,600 | $9,810,800 | ≈92% |
Only ≈$0.85M of the ≈$10.66M is money the buyer would collect if Arm froze right here. The other ≈$9.81M is pure premium paid for the possibility the stock gets there — with 2.3 years to do it.
The breakevens — say them plainly:
- 🎯 $250 leg breakeven: $386.08 → needs Arm +42.4% from spot
- 🎯 $500 leg breakeven: $586.92 → needs Arm +116.4% from spot, which implies a market cap of ≈$628B against $286.65B today.
🤔 But here's the plot twist
Arm isn't a stranger to $386. The stock is +146% year-to-date and set an all-time closing high of $439.46 on June 18, 2026 — then fell ≈34% in July to around $268, landing it ≈39% below its own high. So the $250 leg's $386.08 breakeven doesn't require a new all-time high. It requires a round trip to a level the stock already visited eight weeks before this trade printed. That reframing matters: one leg is "recover the June high," the other is "double from here and set a new regime entirely."
✅ RESOLVED — Both Legs Opened Clean, Within a Whisker of the Prediction
Updated 2026-08-13 pre-market. Resolving OPRA snapshot timestamped August 13 (reflects the August 12 close, after this print); baseline is the August 12 snapshot (reflects the August 11 close, before this print).
| Leg | Baseline (Aug-12) | Resolving (Aug-13) | Δ | Print size | What we published | Verdict |
|---|---|---|---|---|---|---|
| Dec-15-2028 $250 call (bought) | 153 | 551 | +398 | 400 | "land near ≈553 if the full 400 became new open interest" | ✅ OPEN (BTO) — 99.5% of size |
| Dec-15-2028 $500 call (bought) | 161 | 777 | +616 | 600 | "land near ≈761 if the full 600 became new open interest" | ✅ OPEN (BTO) — 103% of size |
Both legs are confirmed opens with essentially zero transfer. The $250 line captured 99.5% of the printed size as net new open interest and the $500 line captured 103% — the extra 16 contracts mean other buyers layered onto the same strike after the block. Nothing in this resolution changes the article's read: this is a genuinely new 2.3-year long-call package, not an existing position changing hands.
The one caveat we flagged still stands. The BUY label came off a negotiated floor block, which takes no liquidity, so open interest proves the contracts are new — it does not independently prove who was the buyer. That limit is unchanged by this snapshot.
🤓 What This Actually Means — Plain English
Let's translate "bought 1,000 December 2028 calls" into something you'd actually explain to a friend.
Buying a call that expires in 2.3 years is fundamentally different from buying a call that expires in 2 weeks. A weekly call is a bet on a specific move happening by a specific date — earnings, a headline, a breakout. A 2028 call is a bet that the path has enough time to unfold. You're not betting Arm goes up next Tuesday. You're betting that somewhere across the next 856 days — through nine quarterly earnings reports, product launches, an antitrust probe, a couple of chip-sector rotations, and whatever else happens — Arm's stock ends up meaningfully higher than where it costs you to break even.
Why does 92% of the cost being time value matter so much? Because time value is what you're really buying here — not "cheap access to upside," but "the right to be wrong for a long time and still be okay." If Arm sits flat at $271 for the next two years and then finally breaks out in month 27, this position can still pay off, because there's time left on the clock. Compare that to a short-dated call: if Arm doesn't move now, the option is worthless now. That flexibility is exactly what the buyer paid $9.81M for.
The catch: time value decays, and it decays the whole way down to zero. Even if the long-term thesis on Arm turns out completely correct — royalties compound, AGI CPU orders convert to revenue, the stock eventually re-rates — this position can still lose most or all of its value if the move arrives late or grinds too slowly, because every day that passes without progress burns some of that $9.81M. Being right about the destination doesn't protect you if you're wrong about the timing. That's the core risk of any LEAP, and it's magnified here because so little of the cost is "already earned" intrinsic value.
What each strike actually needs to happen:
- The $250 call needs Arm to get back to $386, a level it already touched (higher, even) just two months ago. This leg is a bet on mean reversion within a demonstrated range — Arm proved it can trade there; the question is whether it can sustain it.
- The $500 call needs Arm to more than double to $587, pushing the company's market cap from $286.65B to ≈$628B — above anything Arm has ever been worth. This leg is a bet on an entirely new valuation regime, not a return trip. Notably, $500 is exactly where Mizuho's Street-high price target sits — the single most bullish number any covering analyst has published.
The float is why a trade like this even makes sense to price. SoftBank owns roughly 87% of Arm, leaving only 140.53M shares (≈13% of shares outstanding) freely tradable, with institutional ownership at just 8.23% and insiders at 0.06%. A tiny float means the stock swings hard on relatively modest flows — that's mechanically why Arm carries a 3.91 beta and a 52-week range spanning $100.02 to $452.70, more than a 4x band in twelve months. For a short-dated trader that's terrifying. For someone buying 2.3 years of optionality, that realized volatility is the raw material the trade is made of — it's exactly what makes paying 92 cents on the dollar for time value a rational price rather than an overpay.
Risk control, stated plainly: the entire ≈$10.66M is at risk. These are long calls — the maximum loss is 100% of premium paid if Arm sits below $250 at expiration in December 2028. The $500 leg specifically needs the stock to more than double from here; if that doesn't happen, that half of the package (≈$5.22M) expires worthless regardless of how the $250 leg performs. This is a position sized for people who can absorb a total loss on a multi-year time horizon — not a trade to size like a weekly earnings play.
📈 Technical Setup / Chart Check-Up
YTD Chart
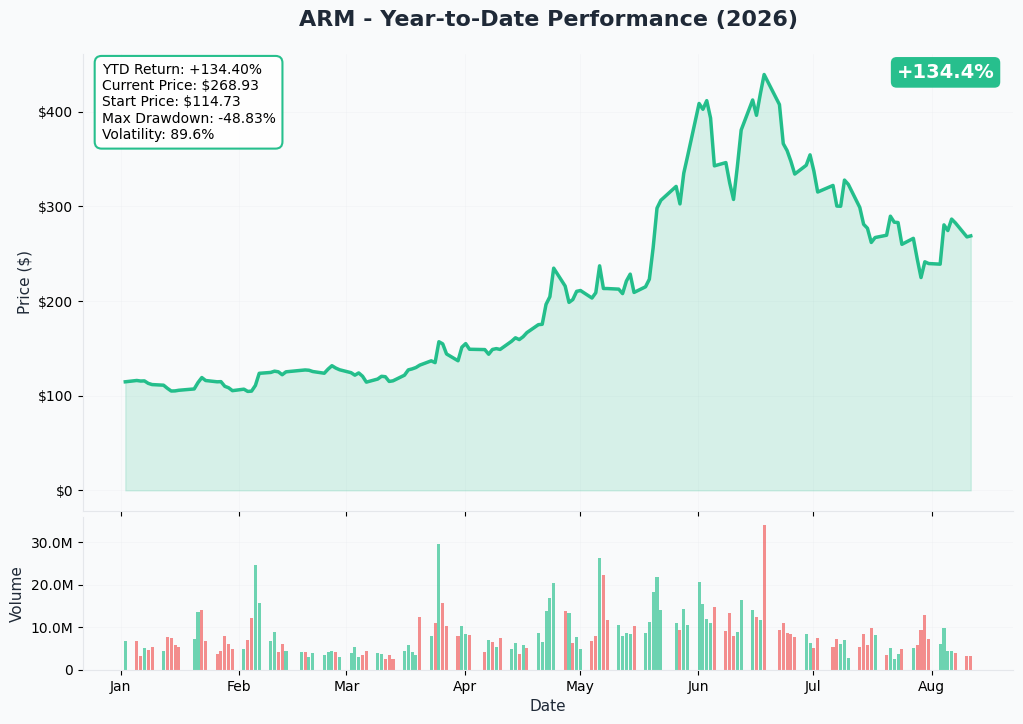
Arm's trailing-year chart tells the whole "violent round trip" story in one picture: a surge from the low-$100s to an all-time closing high of $439.46 on June 18, 2026, then a brutal ≈34% July drawdown back into the $260s-$270s, and a recent bounce off the lows. That's the exact terrain the $250 and $500 strikes are staked across.
Gamma-Based Support & Resistance Analysis
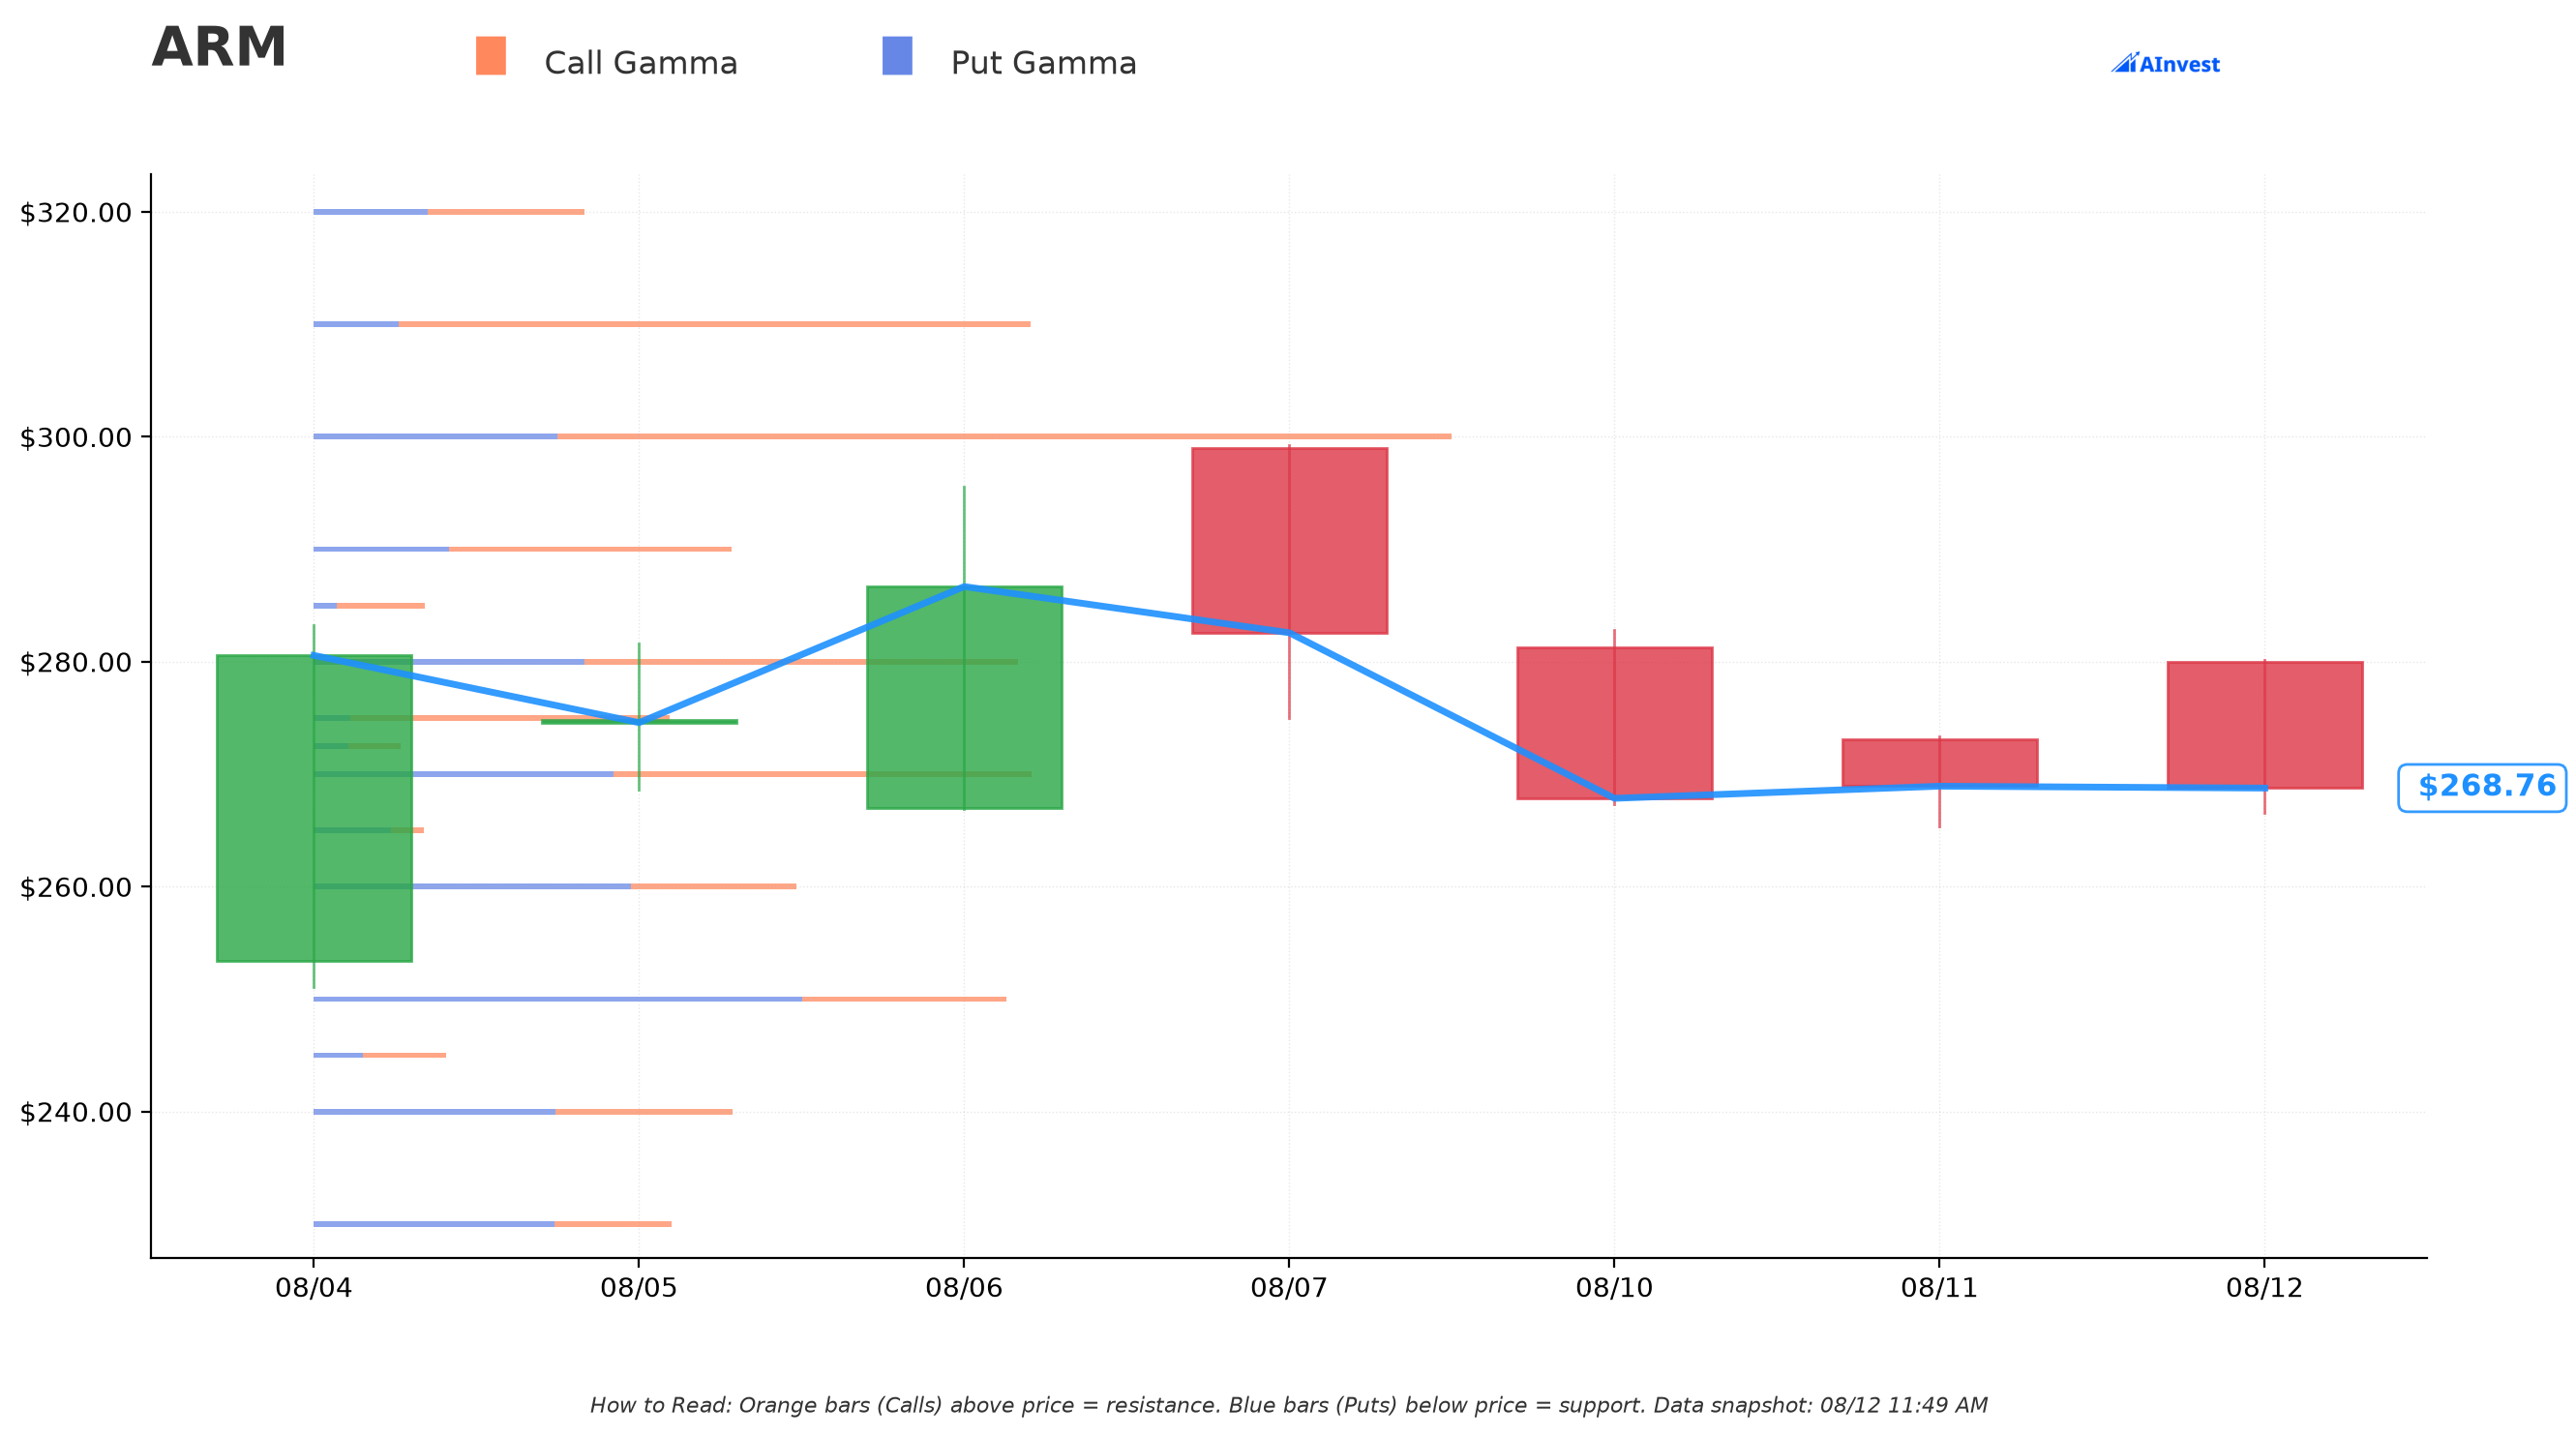
Current price in the gamma data: $268.90.
- 🟠 Resistance: $270 (Moderate) — sits almost exactly at spot, just ≈0.4% away. Dealer positioning is thin right here; this is more of a magnet than a wall.
- 🔵 Support: $250 (Moderate) — ≈7% below spot, and worth calling out explicitly: this is the exact strike of the lower leg in today's trade. The buyer of the $250 calls is positioned right on top of a level options dealers are already defending. If gamma support holds near $250, it works in this trade's favor by keeping the lower leg from going deep out of the money on a pullback.
Gamma levels shift daily as new options trade and expire — treat these as the market's current center of gravity, not a permanent floor or ceiling.
Implied Move Analysis
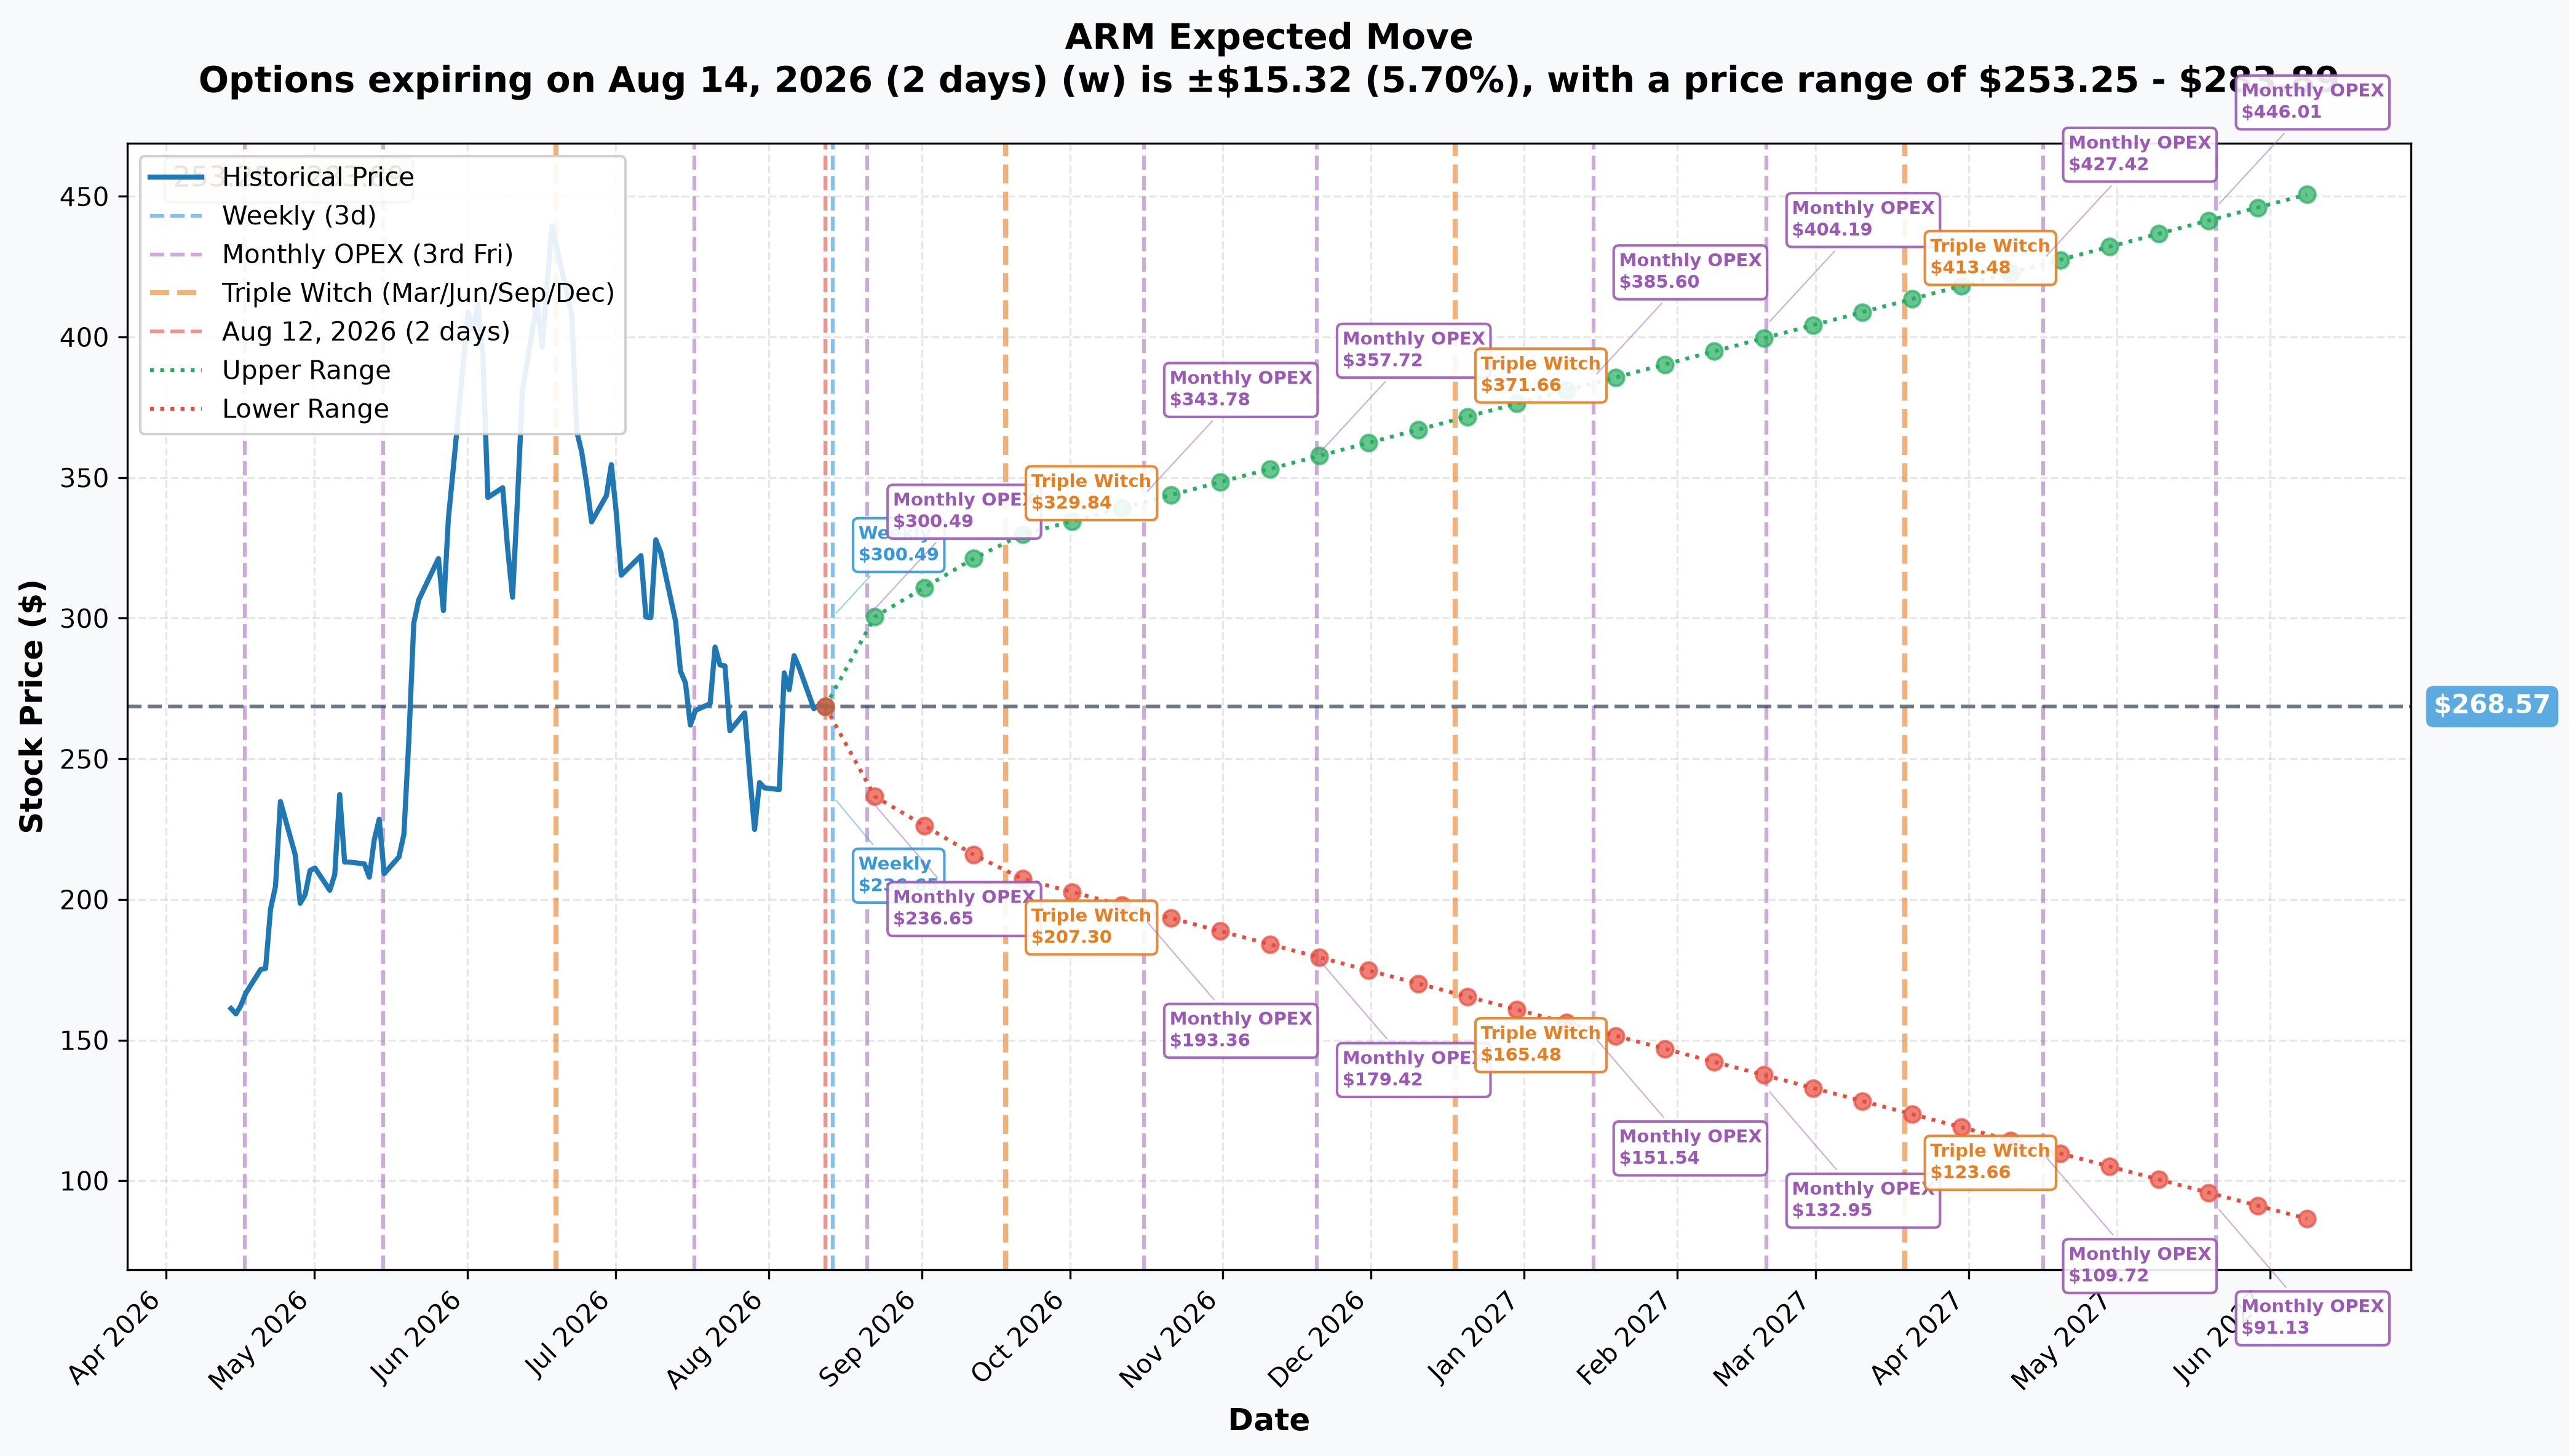
The options market is currently pricing:
| Horizon | Expiry | Implied Move | Range |
|---|---|---|---|
| Weekly | 2026-08-14 | ±5.7% | $253.25 – $283.89 |
| Monthly OPEX | 2026-08-21 | ±11.5% | $237.69 – $299.45 |
| Quarterly / Triple Witch | 2026-09-18 | ±22.3% | $208.69 – $328.45 |
Sit with that last number: a ±22.3% expected range over roughly five weeks, on a company with a $286.65B market cap. That is an extraordinary amount of priced-in movement for a company this size — most mega-caps trade in a fraction of that range over a comparable stretch. This is not a side note; it's the entire reason a 2.3-year call on Arm costs what it costs. The same realized-volatility profile that produces a ±22% five-week range is what a 2.3-year, 92%-time-value call is actually buying — access to a stock whose distribution of outcomes is unusually wide, in both directions, for a very long time.
🎪 Catalysts
Already Happened (last three months)
Arm's most recent quarter set the tone for the entire thesis. On July 29, 2026, Arm reported Q1 FY2027 results: record revenue of $1.289B (+22% year over year), royalty revenue of $715M (+22%), and non-GAAP EPS of $0.45 against a $0.40 consensus — the company's fifth straight EPS beat. Inside that report is the cleanest datapoint in the whole research file: data-center royalties more than doubled year over year, "again," and cumulative Neoverse shipments passed 1.5 billion cores — with the most recent 500 million cores shipping in just nine months, versus six years for the first billion. That acceleration curve is the multi-year royalty-ramp thesis in a single number.
Arm has also stopped being purely an IP-licensing company. On March 24, 2026, it launched the Arm AGI CPU — a 136-core Neoverse-based datacenter processor, its first in-house silicon, with Meta as the debut customer. By the July 29 report, that order book had doubled from ≈$1B to more than $2B across fiscal 2027–2028 in a single quarter, and Oracle Cloud Infrastructure joined the AGI CPU ecosystem on June 2, 2026 as a second named hyperscaler.
On the risk side, Bloomberg reported on May 15, 2026 that Arm would face a US FTC antitrust probe** over whether Arm restricts architecture access to the same licensees it now competes with via the AGI CPU — a direct consequence of Arm's move into building its own chips. South Korea opened a separate probe in November 2025. And between June 2 and July 16, 2026, CEO commentary on China export controls shifted from "difficult to ban" to explicitly "flagging hurdles."
Analyst reaction to the beat was genuinely mixed: on July 30, 2026, four firms cut price targets 8–28% the same day — RBC from $475 to $340, TD Cowen from $475 to $350, Wells Fargo from $350 to $280, UBS from $360 to $320 — while every one of them kept a positive rating. That's a valuation reset after the ≈40% drawdown from the June high, not a change of thesis. Meanwhile Mizuho's June 8, 2026 raise to $500 remains the Street high — and lands exactly on today's upper strike.
Upcoming
Nine quarterly reports fall between today and the December 15, 2028 expiration on Arm's established reporting cadence:
| # | Fiscal Quarter | Period Covered | Expected Report |
|---|---|---|---|
| 1 | Q2 FY2027 | Jul–Sep 2026 | ≈ November 2026 |
| 2 | Q3 FY2027 | Oct–Dec 2026 | ≈ February 2027 |
| 3 | Q4 + FY2027 | Jan–Mar 2027 | ≈ May 2027 |
| 4 | Q1 FY2028 | Apr–Jun 2027 | ≈ Jul/Aug 2027 |
| 5 | Q2 FY2028 | Jul–Sep 2027 | ≈ November 2027 |
| 6 | Q3 FY2028 | Oct–Dec 2027 | ≈ February 2028 |
| 7 | Q4 + FY2028 | Jan–Mar 2028 | ≈ May 2028 |
| 8 | Q1 FY2029 | Apr–Jun 2028 | ≈ Jul/Aug 2028 |
| 9 | Q2 FY2029 | Jul–Sep 2028 | ≈ November 2028 — last print before expiry |
Note the fiscal quirk: Arm's fiscal year ends March 31, so the fiscal-year label runs one year ahead of the calendar year it mostly covers — "FY2027" mostly means calendar 2026.
Important framing: keep catalyst dates and the expiration date separate. Every one of the events above lands well before December 15, 2028. No Arm corporate event sits at or near the expiration date itself. This position was deliberately dated past the entire visible catalyst calendar — consistent with a structural, multi-year thesis rather than a bet on any single print. The entire >$2B AGI CPU order book, explicitly framed by Arm as spanning "fiscal 2027–2028," resolves well before this option expires, and two full fiscal years (FY2028 and the first half of FY2029) play out entirely inside the position's life.
🎲 Price Targets & Probabilities
Reading the gamma structure and implied-move data together against the two strikes:
- Base case / near-term: price gravitates toward the $270 gamma resistance zone, essentially where it sits now. The five-week implied range of $208.69–$328.45 (±22.3%) captures the realistic near-term band.
- Bull case ($250 leg territory): a move back toward $386 doesn't require new territory — it's a round trip to levels seen as recently as June 18, 2026. The mechanical driver would be continued royalty beats and AGI CPU order-book growth reaccelerating investor confidence in the datacenter ramp.
- Bear case (floor risk): the $250 gamma support level is exactly where the lower strike sits — a level options dealers are already defending. A breakdown below $250 for a sustained period would put the entire $5.44M lower leg underwater on intrinsic value, though with 2.3 years of runway it wouldn't be dead.
- Extreme bull case ($500 leg territory): requires Arm to clear its own 52-week high ($452.70) and then keep going another ≈30% past it, to a market cap north of $600B — squarely in "new valuation regime" territory, not incremental appreciation.
💡 How Four Different Traders Should Read This
🎲 The YOLO trader
The $500 leg is your lottery ticket, and it's worth being blunt about the price of the ticket. It's 100% time value — every dollar of the $86.92 paid per contract is pure premium, none of it is money you'd collect if Arm sat still. To be right, Arm needs to more than double from spot (+116.4%) to a ≈$628B market cap — a level the company has never reached, above even Mizuho's Street-high $500 target. To be wrong costs 100% of whatever you put into that leg, and it can go to zero well before December 2028 if the move doesn't show up in time. This is the leg that pays off big on a genuine re-rating and pays off nothing on anything short of one — size it like a lottery ticket, not like a core position.
📈 The swing trader
Be honest with yourself here: 2.3 years is not a swing trade, and this exact structure isn't built for you. Holding a December 2028 call through weeks or months of chop, waiting on a multi-year royalty thesis, isn't what swing trading is. What is tradeable off this research is the price action underneath it — Arm is ≈39% below its June 18, 2026 closing high of $439.46, and the options market is currently pricing a ±22.3% range over the next five weeks (roughly $208.69 to $328.45 into the September 18 triple-witch expiry). That's real, near-term volatility you can build a shorter-dated position around — just don't mistake this LEAP package for the vehicle to do it with.
💰 The premium collector
This trade is the mirror image of what you do. Someone on the other side of this floor block effectively sold ≈$10.66M of long-dated time value on a stock with a 3.91 beta and a ≈13% public float. Selling near-dated premium on a liquid, well-behaved name is one risk profile — theta decays fast, gamma risk is contained, and you can adjust weekly. Selling 2.3-year time value on a name this volatile is a completely different animal: you're pinned to the position for years, gamma and vega risk compound over a much longer runway, and a thin float means the stock can gap hard on relatively light volume — working against a short-premium seller in a way a deep-float mega-cap wouldn't. If you're used to collecting theta on 30-45 day cycles, understand that whoever sold this side of the package took on a multi-year version of your trade, with a stock that has already proven it can move over 4x peak-to-trough in a year.
🌱 The beginner
Here's the one concept to take from this entire trade: time value. Of the ≈$10.66M spent, ≈92% — about $9.81M — is time value, not intrinsic worth. Intrinsic value is what an option would be worth if the stock froze right now; time value is what you're paying for the chance the stock moves your way before expiration. The reason this matters: a long-dated option can lose most or all of its value even if you end up being completely right about the company, simply because the move showed up too late. If Arm eventually does everything the bulls hope for, but takes until 2030 instead of 2028, this position can still be worth close to nothing at expiration in December 2028. Being right about the story and being right about the timing are two different bets — options make you pay for both.
⚠️ Risk Factors — Read This Before Anything Else
- The entire ≈$10.66M is at risk. These are long calls; maximum loss is 100% of premium if Arm closes below $250 on December 15, 2028.
- The $500 leg needs Arm to more than double (+116.4%) to a market cap of ≈$628B — a level the company has never reached. If that doesn't happen, this half of the package expires worthless.
- A long-dated option can lose most of its value even if the eventual thesis proves correct, simply because the move arrives too late. Time value decays every day regardless of whether the underlying story is intact.
- Valuation offers no cushion: Arm trades at 274.5x trailing and 112.7x forward earnings, 55.7x sales, and 248.8x EV/EBITDA. There is little room for a stumble.
- The median analyst target ($260) sits below spot even though the mean ($286.79) sits above it — the average is skewed upward by a handful of very bullish outliers, Mizuho's $500 chief among them.
- GAAP operating margin fell to 7.1% from 10.8% on +28% opex growth in the most recent quarter — the reason four analysts cut targets the same day as a beat.
- The FTC probe and Arm's own move into competing silicon is a genuine multi-year risk, not a headline that resolves quickly — it runs on roughly the same clock as this option.
- Sector beta cuts both ways: the semiconductor index fell 7.88% in the June 23–24, 2026 chip rout alone; Arm's 3.91 beta amplifies broad tech/semi drawdowns, not just company-specific news.
What the tape genuinely cannot prove: this printed as a negotiated floor block — a known counterparty on the other side, no urgency, no aggressor read available the way a lit sweep would offer. We cannot independently confirm the buyer's motive from the tape alone; the counterparty could be a market-maker warehousing vega, a large holder overwriting or unwinding a related position, or a fund monetizing long-dated volatility on the other side. The BUY label is reported by the venue, not proven by a %-across-the-spread aggressor read, because a floor trade takes no liquidity from a displayed book.
Nine specific research gaps — do not treat any of the following as known, because they aren't:
- Arm's v9 royalty-revenue share and CSS attach rate could not be retrieved — the investor relations site and shareholder-letter PDF were unreachable during research. This is a material gap for sizing the royalty-rate-step-up thesis.
- No remaining performance obligations (RPO) / licensing backlog figure was retrievable.
- No customer-concentration or China-revenue percentage could be sourced — SEC EDGAR blocked automated retrieval. Do not assume a specific China exposure number.
- The Q2 FY2027 earnings date is unconfirmed — Arm had not announced it as of today; ≈November 2026 is a cadence-based estimate only.
- No sourced figure exists for Arm's current datacenter CPU unit-share percentage.
- Sources conflict on the July 30, 2026 earnings-day stock reaction — reports range from −8% to −2% to +7.4%. We are not picking one; treat the actual one-day move as unverified pending direct price-data confirmation.
- Short interest figures conflict between providers — 12.02% (of a smaller float denominator) versus 1.58% (of a different base), with the discrepancy unreconciled.
- No 2026-dated reporting confirms or denies a pending SoftBank secondary offering, despite SoftBank's ≈87% stake.
- Current Nasdaq-100 index-membership status could only be sourced to a 2023-dated reference.
🎯 The Bottom Line
Real talk: someone paid ≈$10.66M for the right to be patient on Arm — and 92 cents of every dollar of that premium is the cost of time, not intrinsic value. This isn't a bet that Arm rips higher next week. It's a bet that across 2.3 years and nine earnings reports, Arm's royalty-ramp story — data-center royalties doubling "again," Neoverse cores compounding from 1.5B, and a silicon order book that just doubled to $2B+ — has room to play out, while a structural risk (the FTC probe into Arm's own channel conflict) runs on the exact same clock.
The $250 leg is the easier ask: Arm already traded above $386 eight weeks before this print, so it's a round trip, not a moonshot. The $500 leg is the hard ask: more than doubling to a market cap Arm has never touched. Both legs are proven fresh opens — 400 against prior OI of 153, and 600 against prior OI of 161 — so this is genuinely new positioning, not existing contracts changing hands.
Mark your calendar for ≈06:30 ET tomorrow for the open-interest snapshot that confirms how much of today's size became durable new positioning, and for early November 2026 for the next real information event — Q2 FY2027 earnings. Whatever you take from this trade, remember the entire ≈$10.66M is genuinely at risk, and being right about Arm's destination doesn't protect you if the market takes its time getting there.
This analysis is for informational purposes only and does not constitute investment advice. Options trading involves substantial risk of loss and is not suitable for all investors. Long-dated options can lose most or all of their value even if the underlying thesis eventually proves correct.
Last updated: 2026-08-13 (pre-market) — the next-day OPRA open-interest snapshot confirmed both legs. Dec-2028 $250C 153 → 551 (+398 against 400) and $500C 161 → 777 (+616 against 600): OPEN (BTO) on both, essentially no transfer. The ⏳ callout was replaced with the ✅ RESOLVED box; no thesis or title change was required.