🐻 DIA $3.7M Bearish Dow Hedge — A Desk Bets the Blue-Chips Crack by Mid-2027
✅ RESOLVED — Next-Day OI Update (2026-06-11): $440P OI 71 → 3,071 (Δ +3,000 = size). The Dow downside hedge opened as read.
Last updated: 2026-06-11
📅 June 10, 2026 | 🔥 Unusual Activity Detected
🎯 The Quick Take
A desk just paid ≈$3.7M for long-dated Dow downside protection — buying 3,000 June-2027 $440 puts on DIA with the ETF trading near $503. That's a bet the Dow falls ≈12% or more over the next year. Executed as a negotiated block cross (known counterparty, off the lit book), this is textbook portfolio insurance or a macro bearish bet — not a panic sweep. With the Dow at all-time highs, inflation at a 3-year high, and recession odds near a coin flip, the setup for far-dated downside protection is unusually compelling right now.
📊 Fund Overview
SPDR Dow Jones Industrial Average ETF Trust (DIA) is the oldest and most liquid Dow ETF, managed by State Street Global Advisors. It is the only fund designed to precisely replicate the price-weighted 30-stock Dow Jones Industrial Average — the index of America's most storied blue-chip companies.
- AUM: ≈$44.8B at a 0.16% expense ratio (State Street, ETF Database)
- Index: 30 large-cap, price-weighted Dow components
- Top sector weight: Financials ≈28% — Goldman Sachs, JPMorgan are outsized directional drivers (Mitrade)
- 52-week range: $419.62 – $517.75 as of June 9
The Dow pushed through 51,000 and printed an all-time high of 51,370 in early June before a sharp 1,151-point two-day selloff to 50,776 — triggered by fresh U.S.–Iran strikes, a Broadcom earnings miss, and a near-four-year-high inflation print all within 48 hours (Mitrade). DIA is hovering near record territory but visibly fragile to headline shocks — a setup that favors cheap, far-dated downside hedges.
💰 The Option Flow Breakdown
📊 What Happened — The Tape
Two prints, same strike, same desk, 60 seconds apart. Combined: 3,000 contracts, ≈$3.7M premium.
| Time | Buy/Sell | Call/Put | Expiration | Premium | Strike | Volume | OI | Size | Spot | Option Price | Option Symbol |
|---|---|---|---|---|---|---|---|---|---|---|---|
| 13:07:55 | BUY | PUT | 2027-06-17 | $2.5M | $440 | 2,000 | 71 | 2,000 | $503.49 | $12.45 | DIA20270617P440 |
| 13:08:55 | BUY | PUT | 2027-06-17 | $1.2M | $440 | 3,000 | 71 | 1,000 | $503.25 | $12.45 | DIA20270617P440 |
Flow type: 🤝 BLOCK CROSS — Negotiated, known counterparty
⏳ Come Back Tomorrow (≈06:30 ET) for the OI Confirmation
Today's prior OI on these contracts was only 71. The combined trade size of 3,000 contracts is ≈42x that OI, which strongly suggests this is a new opening position — the math almost forces it. That said, we cannot fully rule out a pre-existing position that opened before our lookback window. Next trading day's OPRA OI snapshot is the definitive test: if OI rises by ≈3,000 (from 71 to ≈3,071), the open is confirmed. It may rise by somewhat less if the counterparty was transferring a position rather than creating net new open interest. Watch that number.
🤓 What This Actually Means — Plain English
Let's decode exactly what went down here.
The structure: A desk bought 3,000 put contracts on DIA with a June 2027 expiration and a $440 strike. Each contract covers 100 shares. The $12.45 per-share premium × 300,000 shares = ≈$3.7M total cost.
Why it's a bearish/hedge bet: A put option profits when the underlying price falls below the strike price at expiration. DIA is currently trading near $503. The $440 strike is ≈12.6% below the current price. This trade only pays off if DIA is below $440 by June 2027 — meaning the Dow would need to fall at least 12% from today's level to even reach breakeven. If the Dow drops 20–25%, the payoff becomes very large. If the Dow is still above $440, the $3.7M premium is simply lost.
Why the block cross matters: This was executed as a negotiated block cross — a broker pre-arranged a buyer and a seller off the open order book, then printed both sides simultaneously. There is a known counterparty on the other side. This is categorically different from an aggressive lit sweep (where someone is urgently lifting offers). The cross format means we cannot tell which party initiated: the buyer wanted protection OR the seller wanted to collect premium. The most natural read for a 3,000-lot deep-OTM long-dated put is portfolio insurance or an outright macro bearish bet — not a premium-collection trade (that would involve selling puts, not buying them). But the cross structure means we flag that honestly.
The economics in plain terms: If the Dow falls ≈12% to ≈$440 by June 2027, these puts are at-the-money and the desk roughly breaks even on the premium. If the Dow falls 25% to ≈$380, these puts are $60 in-the-money and the position is worth ≈$18M on a $3.7M investment — roughly a 5x return. The Dow would need to drop ≈25% below today for that to happen. It's insurance against a macro shock, not a bet on a small move.
📈 Technical Setup / Chart Check-Up
YTD Performance
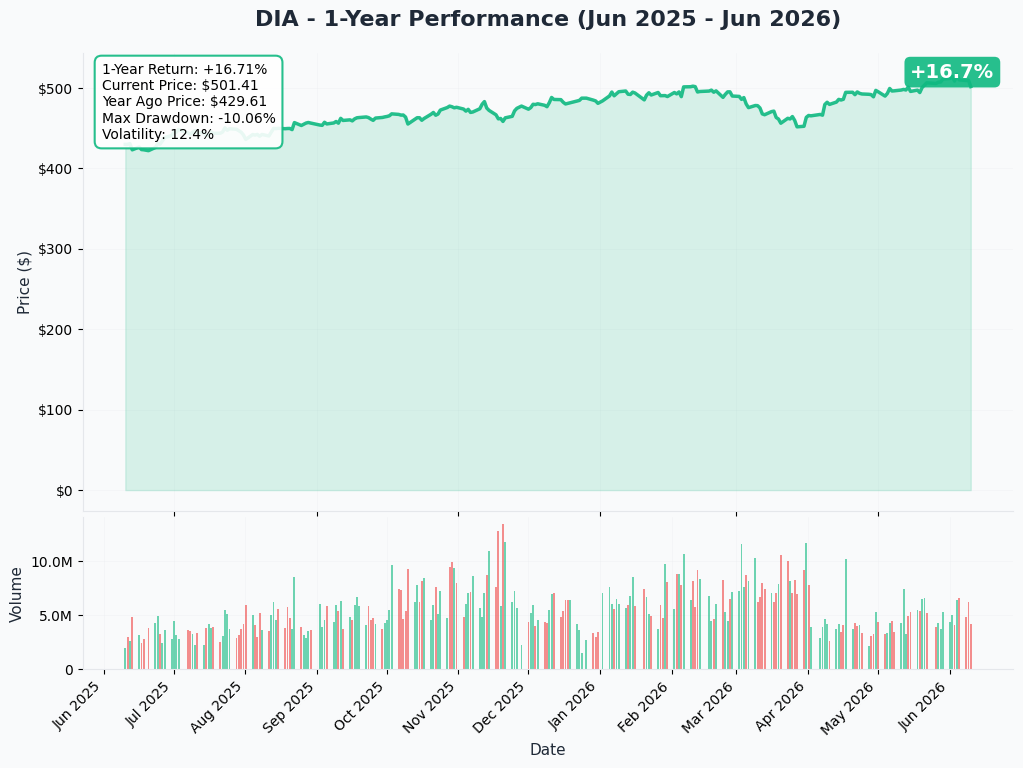
DIA pushed to a new all-time high at ≈$517 before pulling back to ≈$503 in the most recent sessions. The 52-week range ($419 – $518) shows the ETF has had room to run — but also has precedent for pulling back toward the $420s. The recent June 4 two-day drop of 1,151 Dow points reminds us that sharp moves can arrive quickly. The put buyer's $440 strike sits just above the 52-week low, representing a full retest of the lower range.
Gamma-Based Support & Resistance
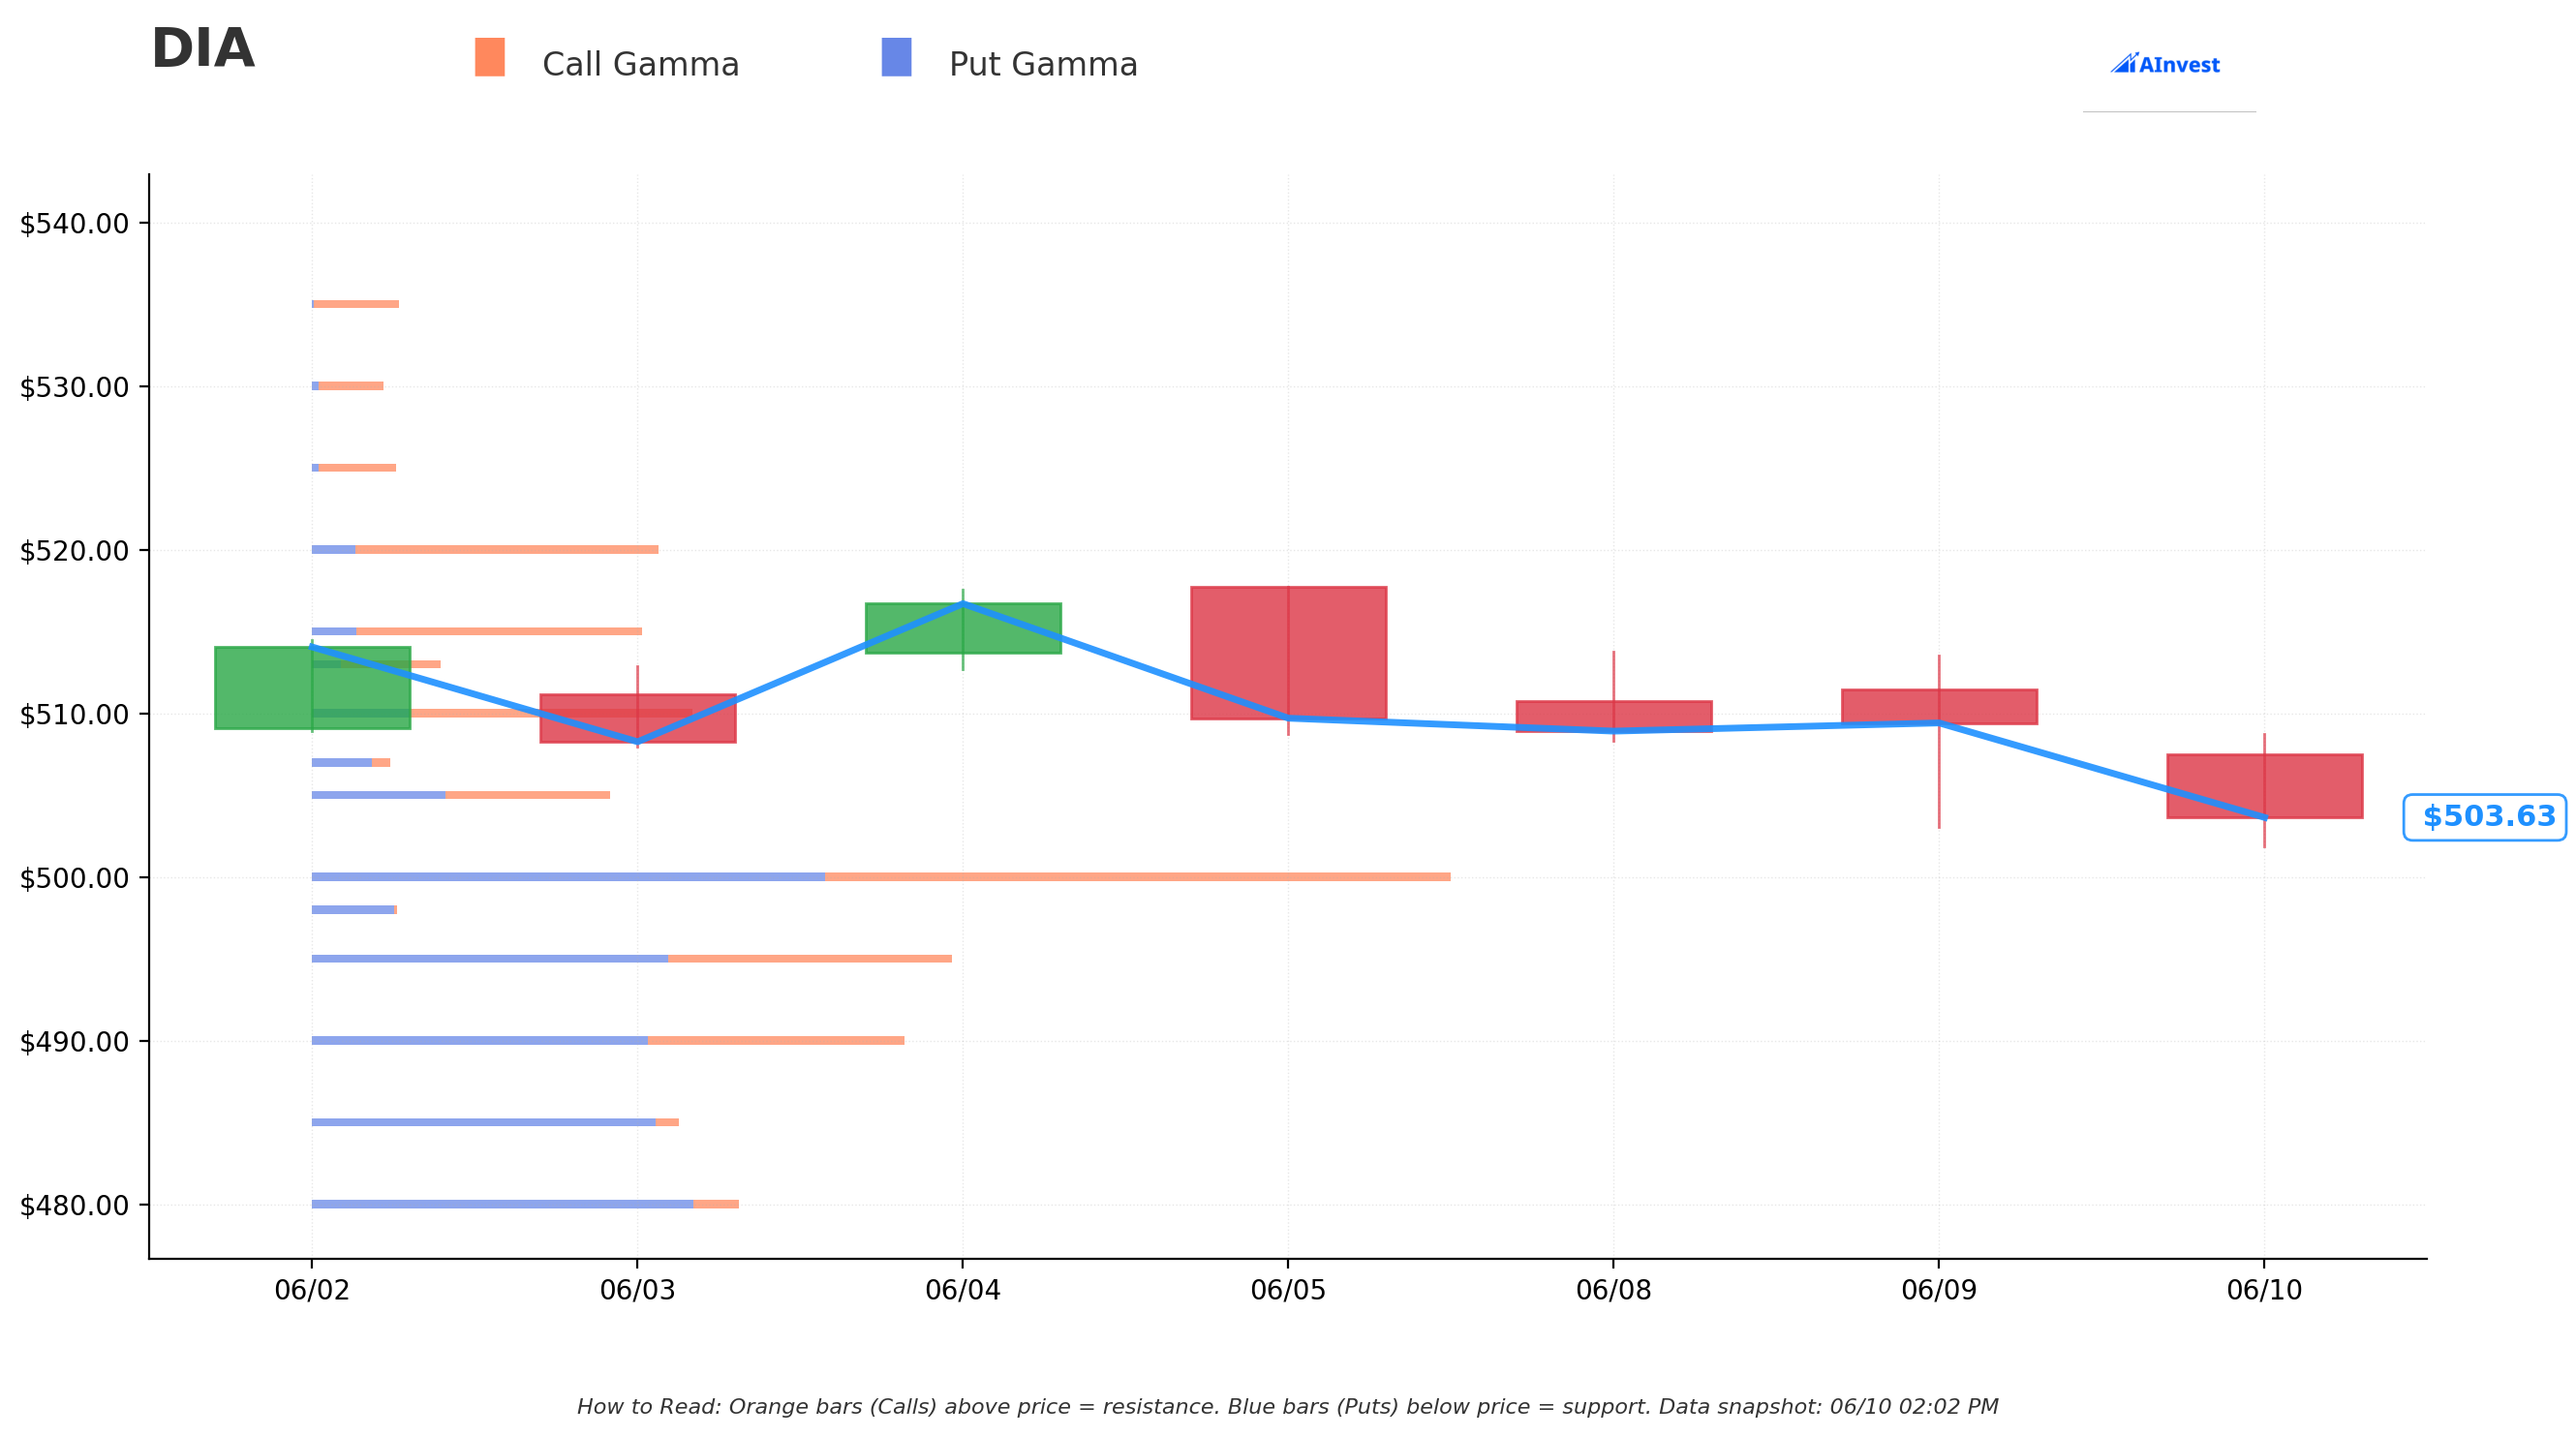
Current Price: ≈$503.86
The gamma exposure map reveals where market-maker hedging creates natural price stickiness:
🔵 Support Levels (Put Gamma Below Price):
- $500 — Very Strong support; the round-number gamma wall and the nearest floor
- $495 — Strong support; secondary gamma concentration
- $490 — Strong; the next major gamma cushion below
🟠 Resistance Levels (Call Gamma Above Price):
- $510 — Moderate resistance overhead
- $515 — Moderate; next ceiling
- $520 — Moderate; extended target ceiling
What this means: DIA is sitting right above the $500 Very Strong gamma wall. Market makers are heavily positioned to defend $500 — a break below it would be a meaningful signal that momentum is shifting. The $440 put strike is well below all gamma support levels, which is intentional: the put buyer wants protection against a macro move that breaks through all of these floors, not a routine intraday wobble.
Implied Move Analysis
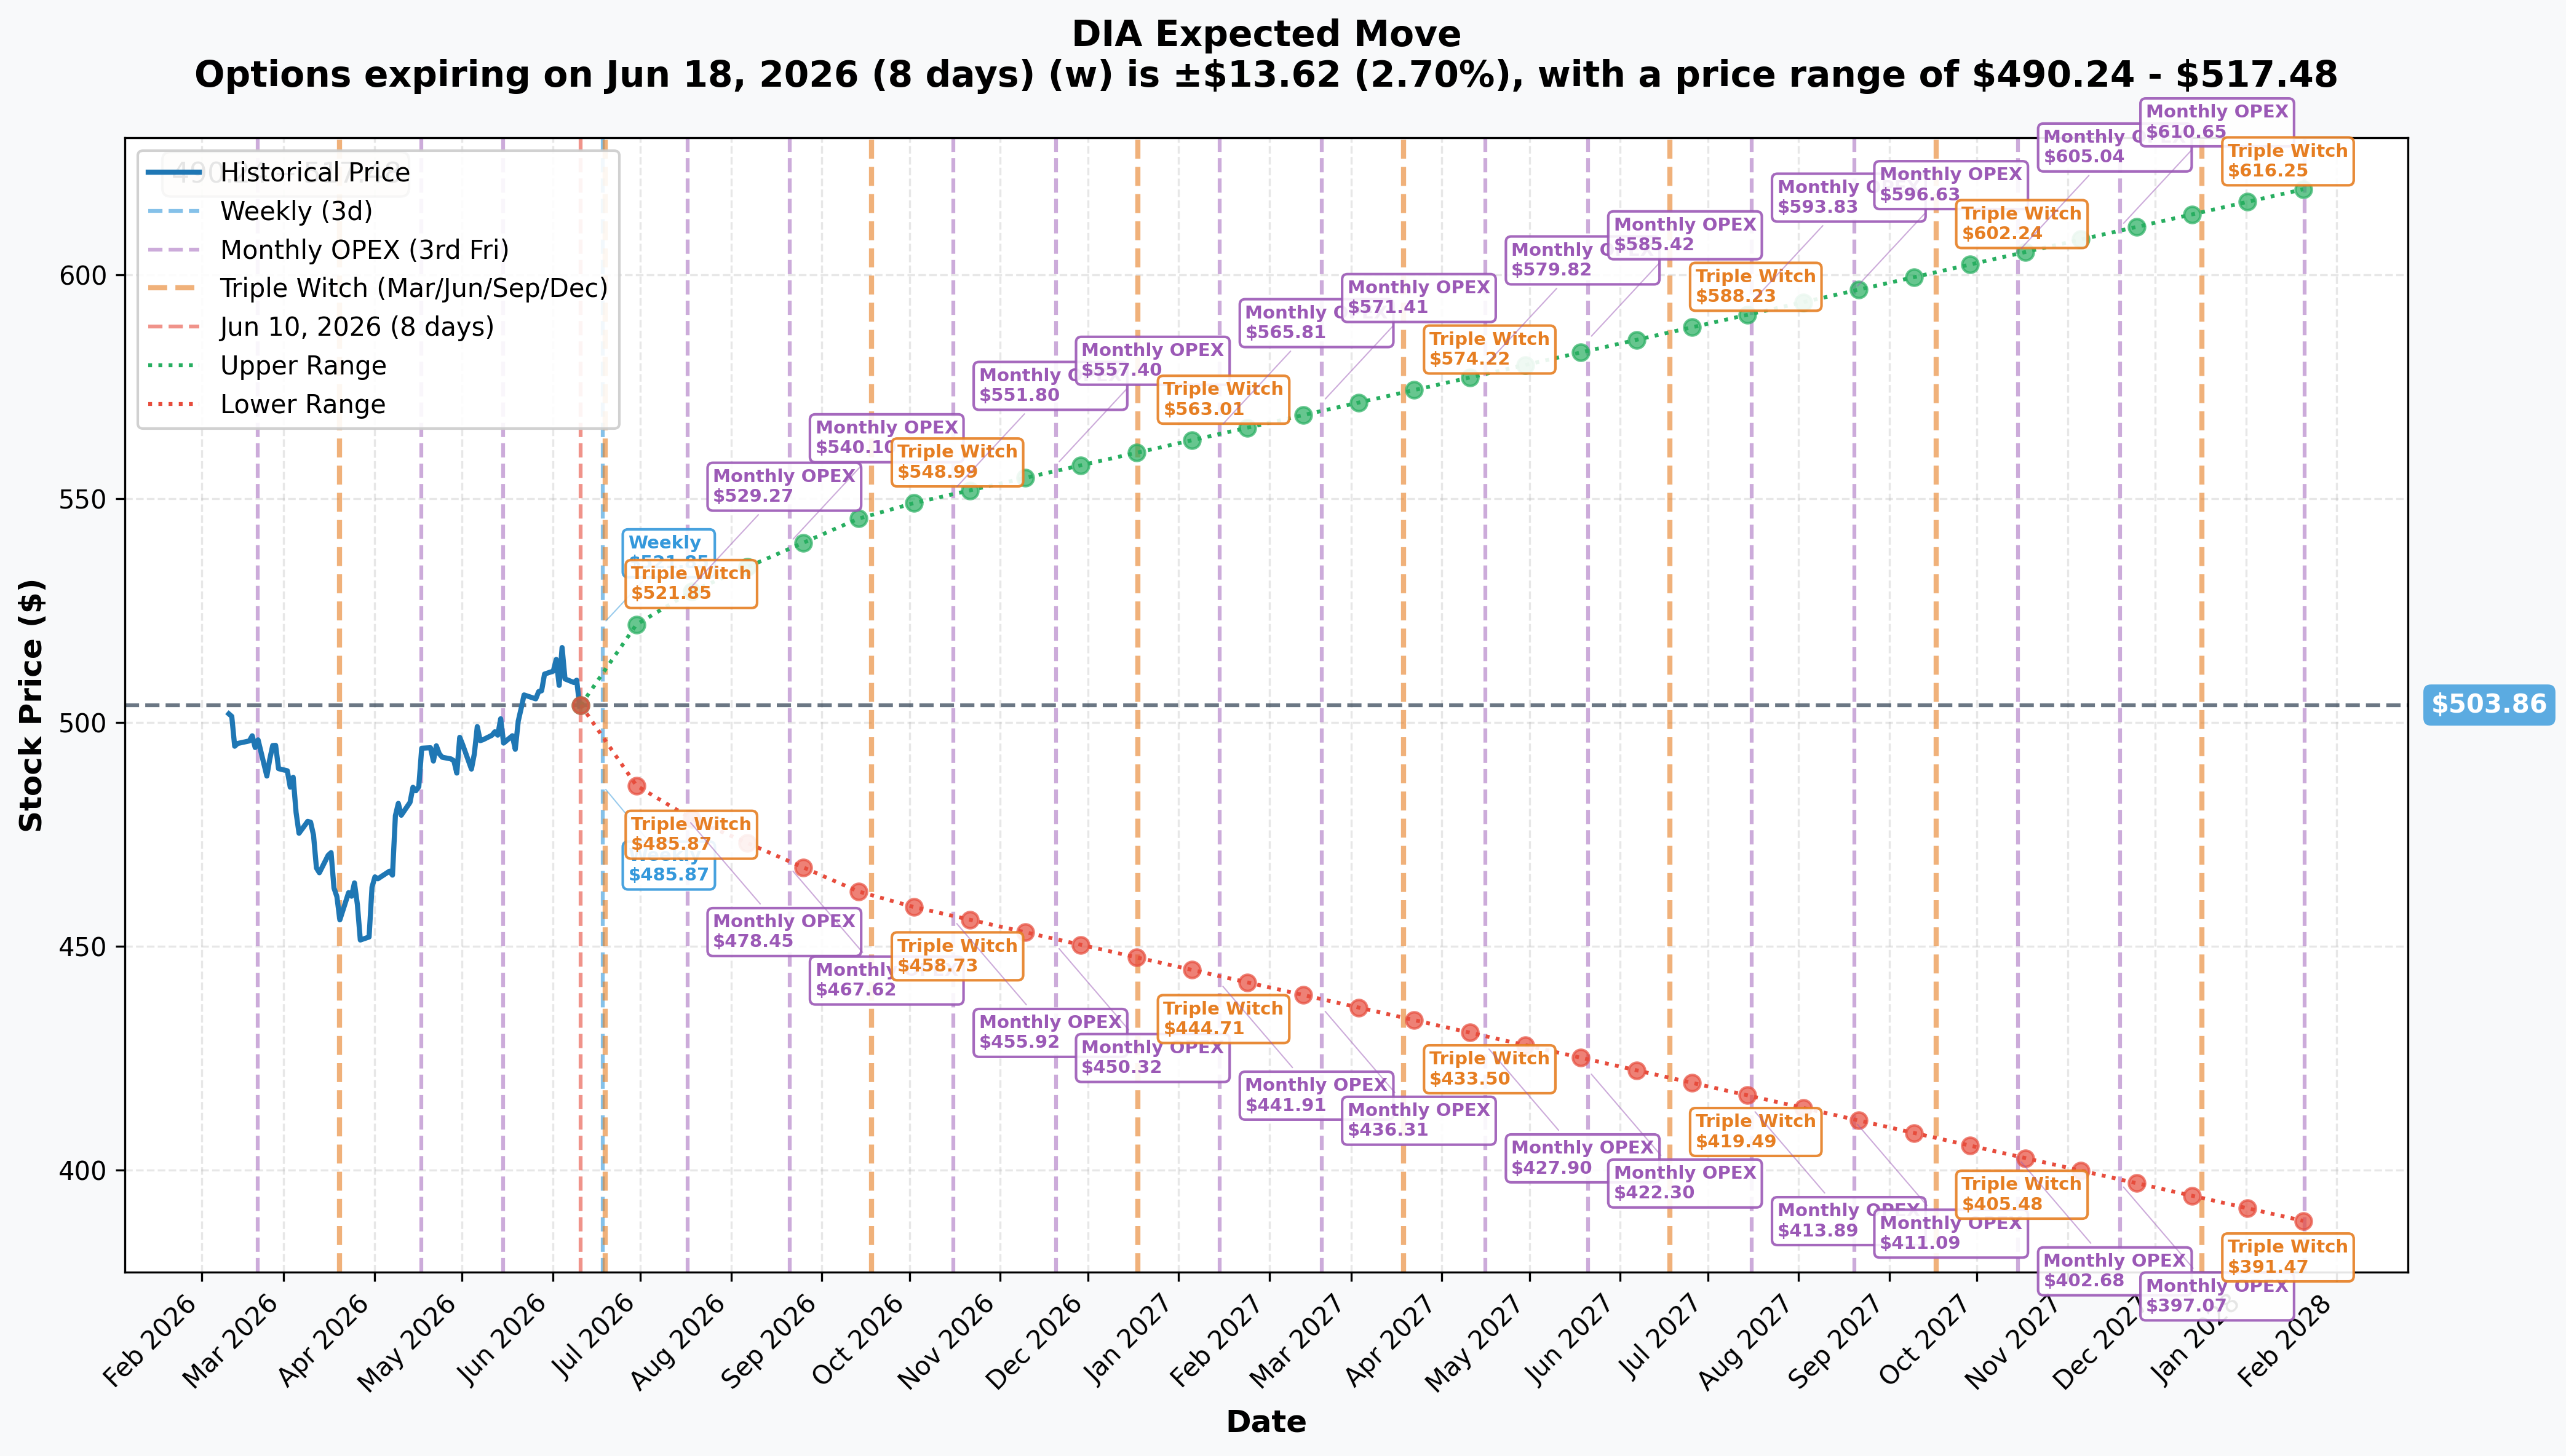
The options market is pricing the following moves from DIA's current level (≈$503.86):
| Horizon | Expiration | Implied Move | Range |
|---|---|---|---|
| Weekly | 2026-06-18 (8d) | ±2.7% (±$13.62) | $490 – $517 |
| Monthly | 2026-07-17 (37d) | ±4.99% (±$25.13) | $479 – $529 |
| Quarterly | 2026-09-18 (100d) | ±8.55% (±$43.07) | $461 – $547 |
| LEAP | 2028-01-21 (590d) | ±22.89% (±$115.34) | $389 – $619 |
Translation for regular folks: Over the next year, the options market is pricing in a ≈23% move in either direction for DIA. The June-2027 $440 put sits at roughly half of that expected downside range — this isn't a "lottery ticket" OTM bet, it is a position inside the market's own implied probability cone over the relevant time frame. The put buyer is not betting on something implausible; they're betting on a scenario that the options market itself treats as plausible.
🎪 Catalysts
🔥 The Dominant Driver — Iran War & Energy Shock (Already Underway)
The single biggest swing factor is the U.S.–Israel conflict with Iran, which has sent energy markets into shock. Brent crude closed near $120/barrel, up ≈50% from pre-conflict levels, and that fed directly into inflation. The May CPI report showed headline inflation at 4.2% year-over-year — the highest since April 2023, driven by gasoline prices up 40.5% YoY. Core CPI at 2.9% was tamer (Morningstar), but a sustained oil spike above $125/bbl is widely flagged as the stagflationary trigger (National Security Journal).
📉 Recession Odds Near a Coin Flip
Moody's Mark Zandi puts 12-month recession odds at ≈49–50%, warning that oil above ≈$125/bbl could tip the economy into contraction and calling recession "more than likely by the second half of the year" without a ceasefire (CBS News). Goldman Sachs (≈30%) and JPMorgan (≈35%) are less bearish (CBS News). The soft-landing counterargument: May payrolls rose 172,000, beating the 80,000 consensus, with unemployment steady at 4.3% — a resilient labor market is what stands between the Dow and a genuine drawdown.
🏦 The Warsh-Fed Transition & Rate Policy
The Fed is on hold at 3.50%–3.75% with markets pricing ≈96–98% odds of no change at the June 16–17 FOMC and roughly 80% odds of zero cuts through all of 2026 (J.P. Morgan, Polymarket). The twist: Kevin Warsh was confirmed 54–45 on May 13 and sworn in as Fed Chair, replacing Powell (CBS News). Warsh is seen as Trump-aligned and open to cuts, but inherits a 4.2% CPI print that constrains any easing (CNN). Fed-independence concerns alongside a war-driven inflation flare create a uniquely two-sided macro risk for blue-chips.
📊 Valuations at Record Highs
The Dow is at all-time highs while the broader market is rich: the S&P 500 forward P/E sits at ≈20.9, above its 5-year (19.9) and 10-year (18.9) averages. Blue-chip constituents are targeting 8–12% EPS growth led by financials and healthcare, and the Dow is framed as a "defensive value haven" (MarketScreener). But rich valuations leave little cushion if EPS growth disappoints — the mechanism through which a 12% drawdown would run.
📅 Upcoming Catalysts (Next 6 Months)
- June 16–17, 2026 FOMC — Statement-only; watch for any Warsh tone shift (Fed)
- Monthly CPI & jobs prints — Each report is now a high-volatility event given the inflation/recession tug-of-war (BLS)
- July 28–29 FOMC + mid-July Q2 bank earnings — Financials are ≈28% of DIA; a swing factor (Mitrade)
- September 15–16, 2026 FOMC — Carries fresh dot plots / SEP (Fed)
- Iran conflict / oil headlines — A move above ≈$125 Brent is Zandi's recession trigger (National Security Journal)
- Tariff / fiscal & debt-ceiling risk — Flagged as a Q2/H2 volatility source (MarketPulse)
🎲 Price Targets & Scenarios
Using gamma levels, implied move data, and the macro backdrop:
📈 Bull Case — Ceasefire & Soft Landing (≈35% probability)
DIA Target: $515 – $530+
- 🕊️ An Iran ceasefire unwinds the oil premium fast; Brent falls back toward $80–90 and CPI moderates sharply
- 💪 May payrolls' strength persists; recession odds collapse from 50% toward 20%
- 📈 Warsh signals openness to modest cuts in the second half; financial conditions ease
- 🏦 Q2 bank earnings (mid-July) beat on NIM expansion and loan quality
- 📊 DIA pushes above $510 Moderate resistance, tests the $515 level; breakout targets $520–$530
- The put buyer loses their $3.7M premium — the insurance simply expires unused
🎯 Base Case — Muddle Through (≈40% probability)
DIA Target: $480 – $510 range
- ⚖️ No ceasefire but no further escalation; Brent hovers $110–$125
- 📊 Monthly CPI prints stay in the 3.8–4.4% range; Fed stays on hold all year
- 💤 Dow consolidates in a choppy sideways range; gamma support at $500 holds
- 🎢 Occasional sharp drops on headlines (like June 4's 1,151-point selloff) but recovery follows
- The put expires worthless or with minimal value; the hedge cost $3.7M but provided peace of mind
📉 Bear Case — Stagflationary Shock (≈25% probability)
DIA Target: $440 – $460 (the put kicks in)
- 🛢️ Brent crosses $125/bbl and holds; Zandi's recession trigger fires
- 📉 GDP prints negative in Q2 or Q3; unemployment ticks up toward 5%+
- 🏦 Bank earnings disappoint on credit losses; financials ≈28% of DIA drag the index
- 📊 S&P 500 forward P/E contracts from 20.9 toward the historical mean of 15–16x; Dow falls 20%+ from highs
- DIA falls to $440–$460; the 3,000 put contracts are in-the-money; position value rises sharply
Put payoff in the bear case:
- DIA at $440 at June 2027 expiry: puts at-the-money, recover premium ≈ break even
- DIA at $400: puts worth $40/share → position worth ≈$12M on $3.7M invested (≈3.2x)
- DIA at $360: puts worth $80/share → position worth ≈$24M on $3.7M invested (≈6.5x)
💡 Trading Ideas for 4 Types of Traders
🚀 YOLO Trader — "I want the big bearish payoff"
Play: Buy DIA put options yourself, but go closer-to-the-money for more delta
Structure example: Buy DIA January-2027 $475–$480 puts (more expensive, but higher delta = more sensitive to moves)
Why: Closer-to-the-money puts have a higher delta and profit faster on a Dow decline. You're betting on the bear case materializing within the next 6–8 months.
Risk: You lose 100% of premium if DIA stays above your strike. Long-dated puts bleed theta slowly, but a 12-month option still decays. Only appropriate if you can afford to lose the entire premium.
Cost ballpark: ≈$15–$25 per contract for Jan-2027 $475P (vs. $12.45 for the $440P this desk bought). Closer in = more expensive per contract.
📈 Swing Trader — "I want near-term bearish exposure with defined risk"
Play: Buy a DIA put spread to reduce cost
Structure example: Buy the DIA September-2026 $490 put, sell the DIA September-2026 $470 put (a $20-wide bear put spread)
Why: A spread caps your upside but dramatically reduces your cost vs. outright puts. You profit if DIA falls to the $470–$490 zone by September — consistent with the quarterly implied move range of $461–$547 (downside $461).
Risk: Max loss = net debit paid. Max gain = $20/share × 100 = $2,000 per spread. Defined risk at entry.
When to consider entering: After a retest of $510 resistance (sell the rally into macro resistance) or on a break below $500 (gamma wall) confirming momentum shift.
🛡️ Premium Collector — "I want to sell volatility, not buy it"
Important note: This trade was a put BUYER, not a seller. The put buyer is spending premium; the premium collector is on the other side of this trade — and that counterparty already exists (it's the block cross seller).
If you want to collect premium in DIA, consider a covered call on a DIA long position — selling calls at $510–$515 resistance to generate income while the Dow consolidates. This is consistent with a neutral-to-slightly-bearish view (you own DIA but cap your upside in exchange for premium).
Risk: If DIA rips through $510–$515, your long position is called away. Not a bearish play — a yield-enhancement overlay.
🌱 Entry-Level Investor — "What does this even mean for me?"
Real talk: a desk just paid $3.7M for insurance on the Dow Jones falling 12%+ over the next year. Think of it like a homeowner in a hurricane zone buying a really expensive insurance policy — they haven't decided the hurricane will definitely hit, but the probability is high enough that the insurance makes sense.
What you can do:
- 👀 Watch the $500 level on DIA. That's the big gamma support number. If DIA holds $500 consistently, the market is telling you the floor is solid.
- 📉 If DIA breaks below $490 on meaningful volume, that's a warning signal that the bear case is starting to unfold.
- 🛡️ If you own individual Dow stocks (Boeing, Goldman, JPMorgan, etc.), remember that a 12% Dow decline would hit them proportionately.
- ⏰ You don't need to trade this at all. Just knowing that sophisticated money is buying long-dated downside protection at all-time highs is useful context — it's a signal to be thoughtful, not reckless.
What NOT to do: Don't rush into buying puts just because you saw this trade. Long-dated OTM puts require the underlying to move a lot just to break even, and most of the time they expire worthless.
⚠️ Honest Risk Factors & What the Tape Cannot Tell Us
What the OPRA tape proves:
- A desk bought 3,000 DIA June-2027 $440 puts via a block cross on June 10, 2026
- The size (3,000) is ≈42x the prior OI (71), strongly consistent with a new opening position
- Total premium: ≈$3.7M at $12.45 per share
What the tape cannot prove:
- Which side initiated: the buyer wanted protection, OR the seller wanted premium. On a cross, we do not know who "called the broker first"
- Whether this is a standalone bearish bet or a hedge against a much larger long position in Dow components, futures, or swaps — the $3.7M could be 0.5% of a $740M book
- The identity of the desk, their broader portfolio, or whether they will hold to expiration
- Whether next-day OI rises by the full 3,000 (new open) or something less (transfer of an existing position)
Key risks to the bearish thesis:
- An Iran ceasefire would rapidly unwind the energy premium; CPI could fall sharply within 2–3 months — eliminating the main macro driver
- U.S. labor market resilience (May +172,000 payrolls) suggests the consumer is still spending, which historically prevents recessions even amid inflation
- The Fed under Warsh could cut if the labor market softens; any rate cut would be a significant catalyst for equities
- At ≈$12.45 per contract, the put buyer is paying ≈2.5% of the ETF's current price in premium — a real cost that decays if the catalyst doesn't materialize within the year
🎯 The Bottom Line
Real talk: A desk bought a year's worth of Dow downside protection — 3,000 puts on DIA at $440, about 12% below current levels, expiring June 2027. At $3.7M, it's meaningful but not a "bet the firm" position. This is the kind of trade you make when you're either (a) running a large blue-chip book and want insurance against a stagflationary macro shock, or (b) you have a genuine macro bearish view on the Dow over the next 12 months.
The macro backdrop for this trade is unusually credible right now: war-driven oil at $120/bbl, CPI at a 3-year high, recession odds near a coin flip, a new Fed chair inheriting a policy bind, and the Dow sitting at all-time-high valuations. That's not a normal backdrop for an ATH. It's the kind of setup where buying insurance on blue-chips 12% below the market for just $12.45/share actually looks cheap.
For DIA holders: The trade is not a "sell everything" signal. It's a reminder that smart money at record-high index levels sometimes buys insurance rather than just riding it higher. If you have meaningful Dow exposure, ask yourself whether you're hedged against a genuine macro shock.
For those on the sidelines: Watch $500 as the first tell. A break below that Very Strong gamma support, confirmed with volume, would be the market's first signal that the bear case is starting. Until then, the floor looks solid.
Mark your calendar:
- 📅 June 16–17, 2026 — FOMC (Warsh's first meeting as Chair — any tone shift moves markets)
- 📅 July 2026 mid-month — Q2 bank earnings (≈28% of DIA; the sector swing factor)
- 📅 Monthly CPI prints — Each one is a live macro event given the Iran/oil backdrop
- 📅 September 15–16, 2026 — FOMC with dot plots; first real read on Warsh's rate path
- 📅 June 17, 2027 — Expiration of this put position; the moment of truth
⚠️ Disclaimer: Options trading involves substantial risk of loss and is not suitable for all investors. This analysis is for educational and informational purposes only and does not constitute financial advice or a recommendation to buy or sell any security. The trade described above involves a block cross, and the initiating party's true motive (hedge vs. outright directional bet) cannot be determined from the public tape alone. Long-dated OTM puts frequently expire worthless. The put buyer's $440 strike requires a 12%+ decline in DIA from current levels just to reach breakeven, and a larger decline to generate profit. Past option flow activity does not guarantee future price movements. Always conduct your own research and consult a licensed financial advisor before trading. Open interest confirmation pending next trading day ≈06:30 ET.