🔄 DOCU $2.77M Synthetic Long Stock — A Textbook Financing Trade, Not a Moonshot Bet
📅 August 10, 2026 | 🤝 Floor Block — Two-Year-Plus Horizon
🎯 The Quick Take
At 12:39:52 someone put on the cleanest structure on today's whole board in DOCU: bought 2,200 January-21-2028 $77.50 calls (≈$2.72M) and sold 2,200 January-21-2028 $77.50 puts (≈$5.49M) — same strike, same expiry, same size, printed as a negotiated floor block. That combination is synthetic long stock: it behaves almost exactly like owning 220,000 shares. The net effect was a ≈$2.77M credit, and the math behind that credit points to financing, not a bullish conviction bet — we'll walk through exactly why below.
🏢 Company Overview
Docusign, Inc. provides electronic-signature solutions in the United States and internationally, delivered through an AI-powered Intelligent Agreement Management (IAM) platform. The company is trying to convert its mature e-signature business into a broader system that stores, searches, analyzes and now acts on the agreements a company signs — the AI layer underneath that effort is branded Iris. Docusign was founded in 2003 and is headquartered in San Francisco, led by President and CEO Allan C. Thygesen.
- Market cap: ≈$11.56 billion
- Sector / industry: Technology — Software (Application Software)
- Current spot: $60.27 (the flow desk's reference price at the time of the trade)
- No dividend, ever — the company has never paid one, which matters directly to how we read this trade (more below)
💰 The Trade in Plain English
Two legs, one timestamp, one desk: at 12:39:52, 2,200 contracts of the January 21, 2028 $77.50 call were bought for ≈$2.72M, and simultaneously 2,200 contracts of the January 21, 2028 $77.50 put were sold for ≈$5.49M. Same strike. Same expiry. Same size. That is not a coincidence — it's the recipe for synthetic long stock.
The tape printed this as a floor block (🤝) — a manually negotiated trade between a broker and a known counterparty, not a lit sweep hitting the open book. There is no urgency here; nobody was "slamming the ask." A desk built a specific, deliberate position.
| Time | Buy/Sell | Call/Put | Expiration | Premium | Strike | Volume | OI | Size | Spot | Option Price | Option Symbol | Order Type | Strategy |
|---|---|---|---|---|---|---|---|---|---|---|---|---|---|
| 12:39:52 | BUY | CALL | 2028-01-21 | $2.72M | $77.50 | 2,200 | 58 | 2,200 | $60.27 | $12.35 | DOCU20280121C77.5 | BTO | Long Call — synthetic long stock leg |
| 12:39:52 | SELL | PUT | 2028-01-21 | $5.49M | $77.50 | 2,200 | 5 | 2,200 | $60.27 | $24.95 | DOCU20280121P77.5 | STO | Short Put — synthetic long stock leg |
Net: ≈$2.77M CREDIT (the $5.49M collected on the puts minus the $2.72M paid for the calls) — 🤝 floor block, mechanism = negotiated, not lit.
✅ RESOLVED — Both Legs Opened, Within ≈40 Contracts of the Prediction
Updated 2026-08-11 pre-market. Resolving OPRA snapshot timestamped August 11 (reflects the August 10 close); baseline is the August 10 snapshot (reflects August 7 — before these prints).
| Leg | Baseline (Aug-10) | Resolving (Aug-11) | Δ | Print size | Δ as % | Day vol | Our published prediction | Verdict |
|---|---|---|---|---|---|---|---|---|
| Jan-21-2028 $77.50 call (bought) | 58 | 2,222 | +2,164 | 2,200 | +98.4% | 2,222 | ≈2,258 | ✅ OPEN (BTO) |
| Jan-21-2028 $77.50 put (sold) | 5 | 2,214 | +2,209 | 2,200 | +100.4% | 2,211 | ≈2,205 | ✅ OPEN (STO) |
Both numbers landed essentially on the published predictions — the call at 2,222 against ≈2,258 expected, the put at 2,214 against ≈2,205. The synthetic long stock position is fully confirmed as new: a long call and a short put at the same strike and expiration, both opened in size against near-zero prior open interest.
The put leg is the more precise of the two, adding 2,209 against a 2,200-lot print (100.4%) — every contract sold created a new open contract. The call added 2,164 of a possible 2,200 (98.4%), with the small shortfall reflecting a handful of contracts matching against the 58 that already existed. Neither result leaves room for a transfer or close interpretation.
🤓 What This Actually Means — Plain English
This is the most valuable teaching moment on the board today, so let's slow down and build it step by step.
Step 1 — what "long call + short put, same strike, same expiry" actually is. When you buy a call and sell a put at the identical strike and identical expiration date, the two option payoffs cancel each other's curvature out and what's left is a straight line — the exact payoff shape of owning the stock outright. This is called synthetic long stock. At expiration:
- If DOCU is above $77.50, the call is exercised and the position is effectively long the stock at $77.50.
- If DOCU is below $77.50, the short put is assigned and the position is forced to buy the stock at $77.50 anyway.
Either way, above or below the strike, the position ends up long the stock at $77.50 — which is why it behaves like owning 220,000 shares (2,200 contracts × 100 shares) from day one, with a delta close to 1.00.
Step 2 — why this printed as a $2.77M credit, not a debit. The $77.50 strike sits ≈28.6% above the $60.27 spot. That means:
- The call is deep out of the money — all $12.35 of its price is pure time value, zero intrinsic value.
- The put is deep in the money — it carries $17.23 of intrinsic value (77.50 − 60.27) plus $7.72 of time value, for its $24.95 price.
Selling a deep in-the-money put collects far more premium than buying a far out-of-the-money call costs. That's why the package pays the trader $12.60 per share net ($24.95 − $12.35) even though it's "long" the stock synthetically.
Step 3 — the honest economics, and why this smells like financing. If you net the $12.60 credit against the $77.50 strike, the effective price this desk locked in for their synthetic 220,000 shares is:
$$77.50 - 12.60 = $64.90 \text{ per share, against a } $60.27 \text{ spot}$$
That's a ≈7.7% premium over ≈1.45 years (529 days) — which, on an annualized basis, works out to roughly 4.3% per year. For a stock that pays no dividend at all, that 4.3%-ish rate is squarely ordinary cost-of-carry — basically what it costs to borrow money and hold a position over time, not a rich premium paid for conviction.
Here's the key insight: a trader who simply wanted to bet bullish on DOCU could just buy 220,000 shares outright. Instead, this structure gets the same stock-like exposure while collecting $2.77M up front instead of laying out ≈$13.3M in cash (220,000 × $60.27). That is the signature of a financing or conversion package — synthetic exposure engineered for capital efficiency, or one leg of a larger position (e.g., against an offsetting short-stock or dealer-inventory leg we can't see) — not a headline "someone just bet $2.77M bullish on DOCU."
Step 4 — the risk is real, and it is not small. Do not read "credit received" as "low risk." A short put obligates the seller to buy the stock at $77.50 no matter how far it falls — synthetic long stock carries essentially the full downside of owning shares outright, dollar for dollar below the $64.90 breakeven. If DOCU were to go to zero, the loss on this package would be the entire $64.90 per share — $6,490 per contract, or ≈$14.28 million across all 2,200 contracts. There is no floor. This is the honest cost of the leverage this structure provides.
📈 Charts
1-Year Price Path
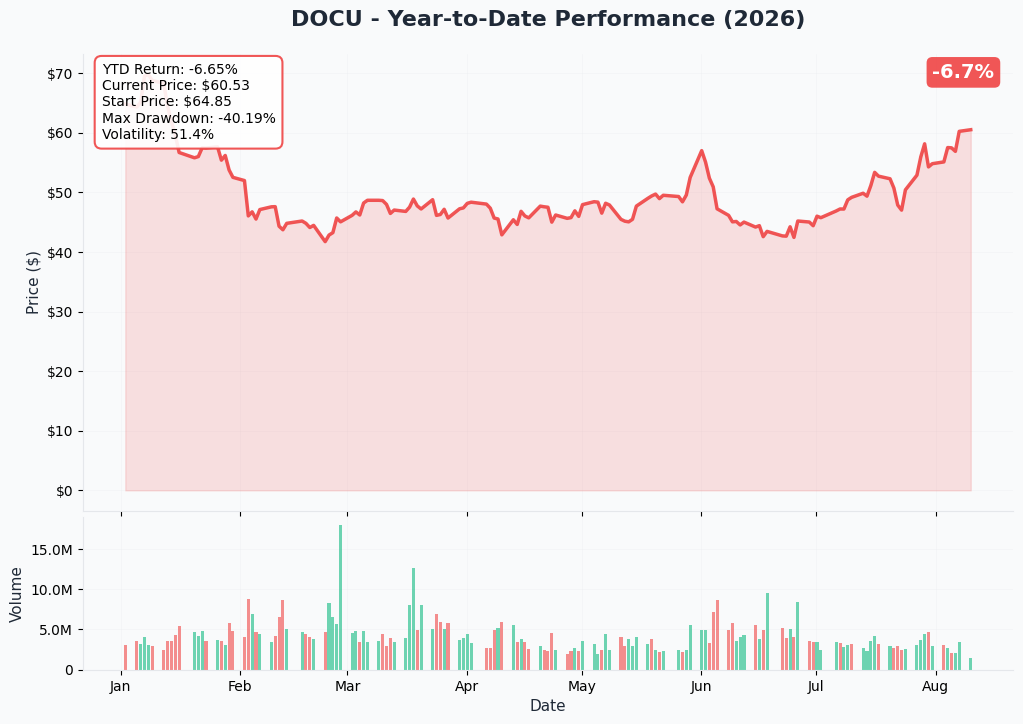
DOCU has round-tripped violently in 2026 — down as much as 27% earlier in the year on "agentic AI kills software" fears (a 52-week low of $40.16 in late February), then a sharp −7.22% guidance-driven drop to $46.73 on June 5 after an otherwise beat-and-raise quarter, followed by a largely news-free +23% rally over the past month to the current $60.27–$60.56 zone. Year-to-date the stock is still −11.47%.
Gamma Support & Resistance
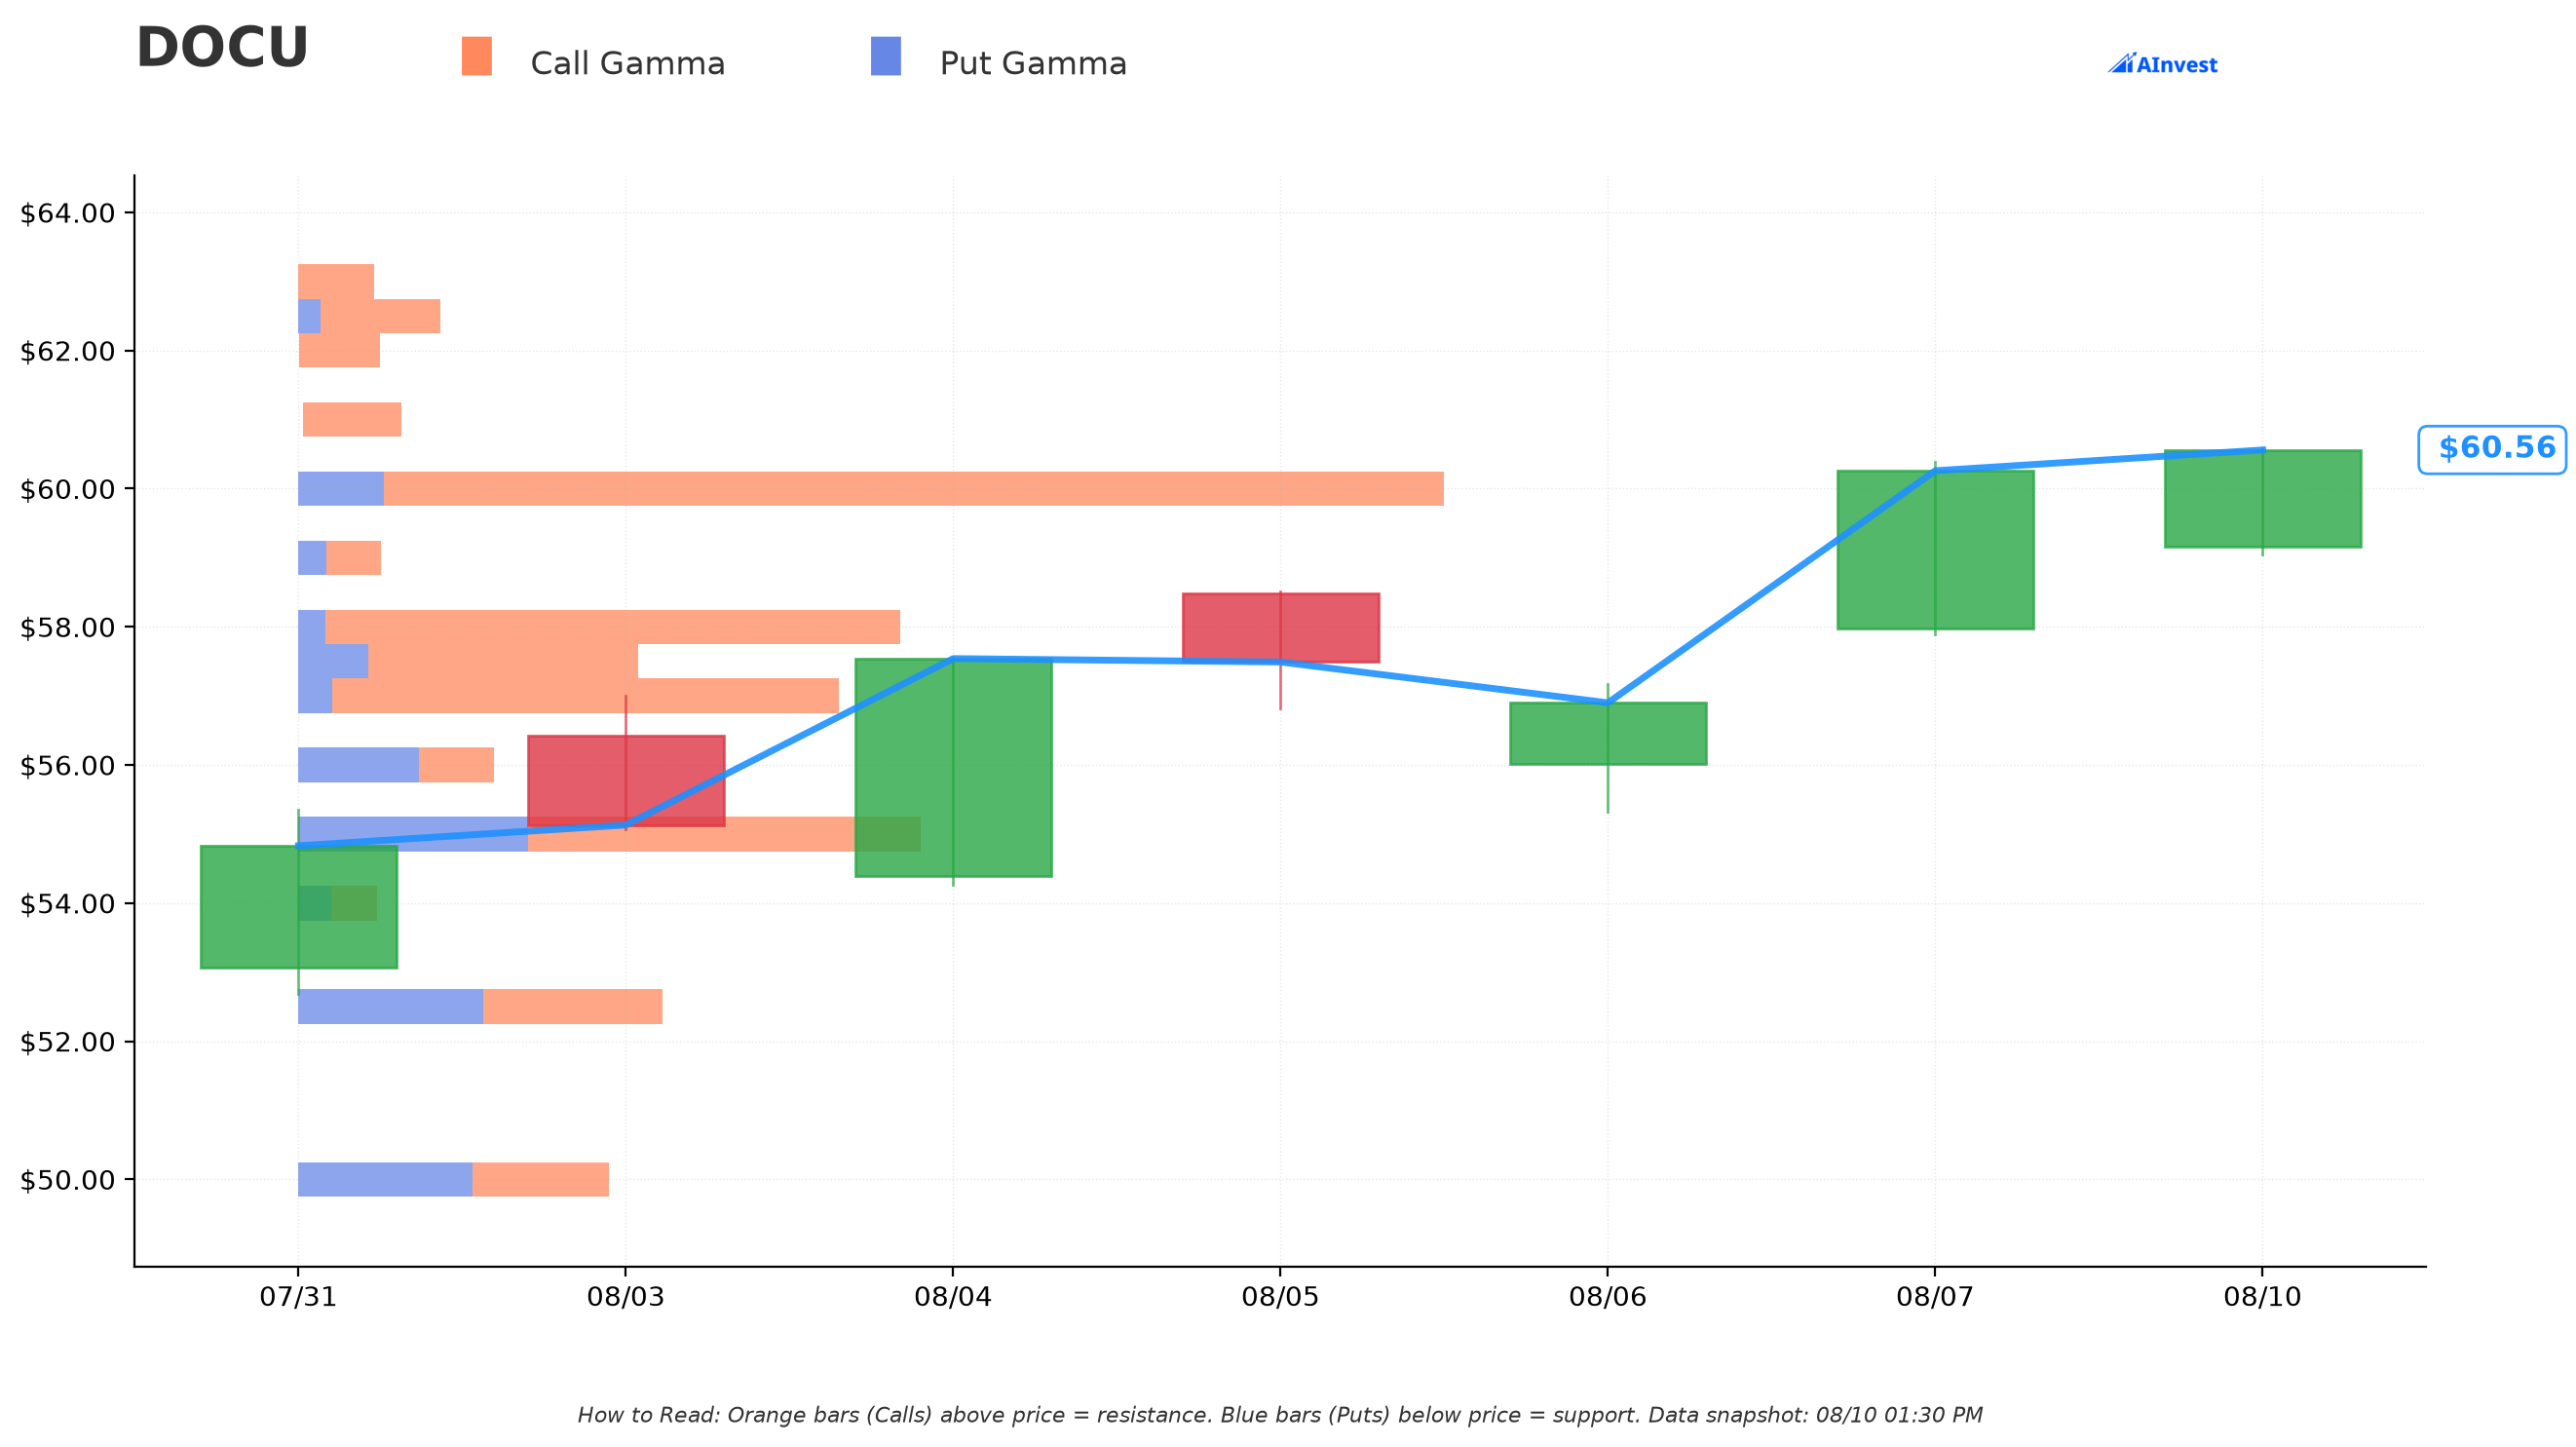
Be straight with the reader here: this name has very thin gamma data. The desk's snapshot found zero identified gamma walls across only 28 total strikes — nothing close to the density you'd see in a heavily-optioned mega-cap. We are not going to invent support/resistance levels that the data doesn't support.
What the data does show: the largest total-gamma concentrations sit clustered right around today's spot — $60 (the single largest reading among all 28 strikes), followed by $58, $65, and $57. Above that, gamma thins out fast: $75 shows a small net-positive reading and $80 is essentially flat/slightly negative — and there is no strike listed at $77.50, the exact strike used in today's trade. In practical terms, the dealer-hedging map available to us has nothing meaningful to say about the strike or the January 2028 expiration this trade actually used — which makes sense, since gamma maps are most reliable for near-dated options, and this position is 1.45 years out. Don't treat this trade as a "level play"; it isn't positioned against any visible dealer wall.
Implied Move
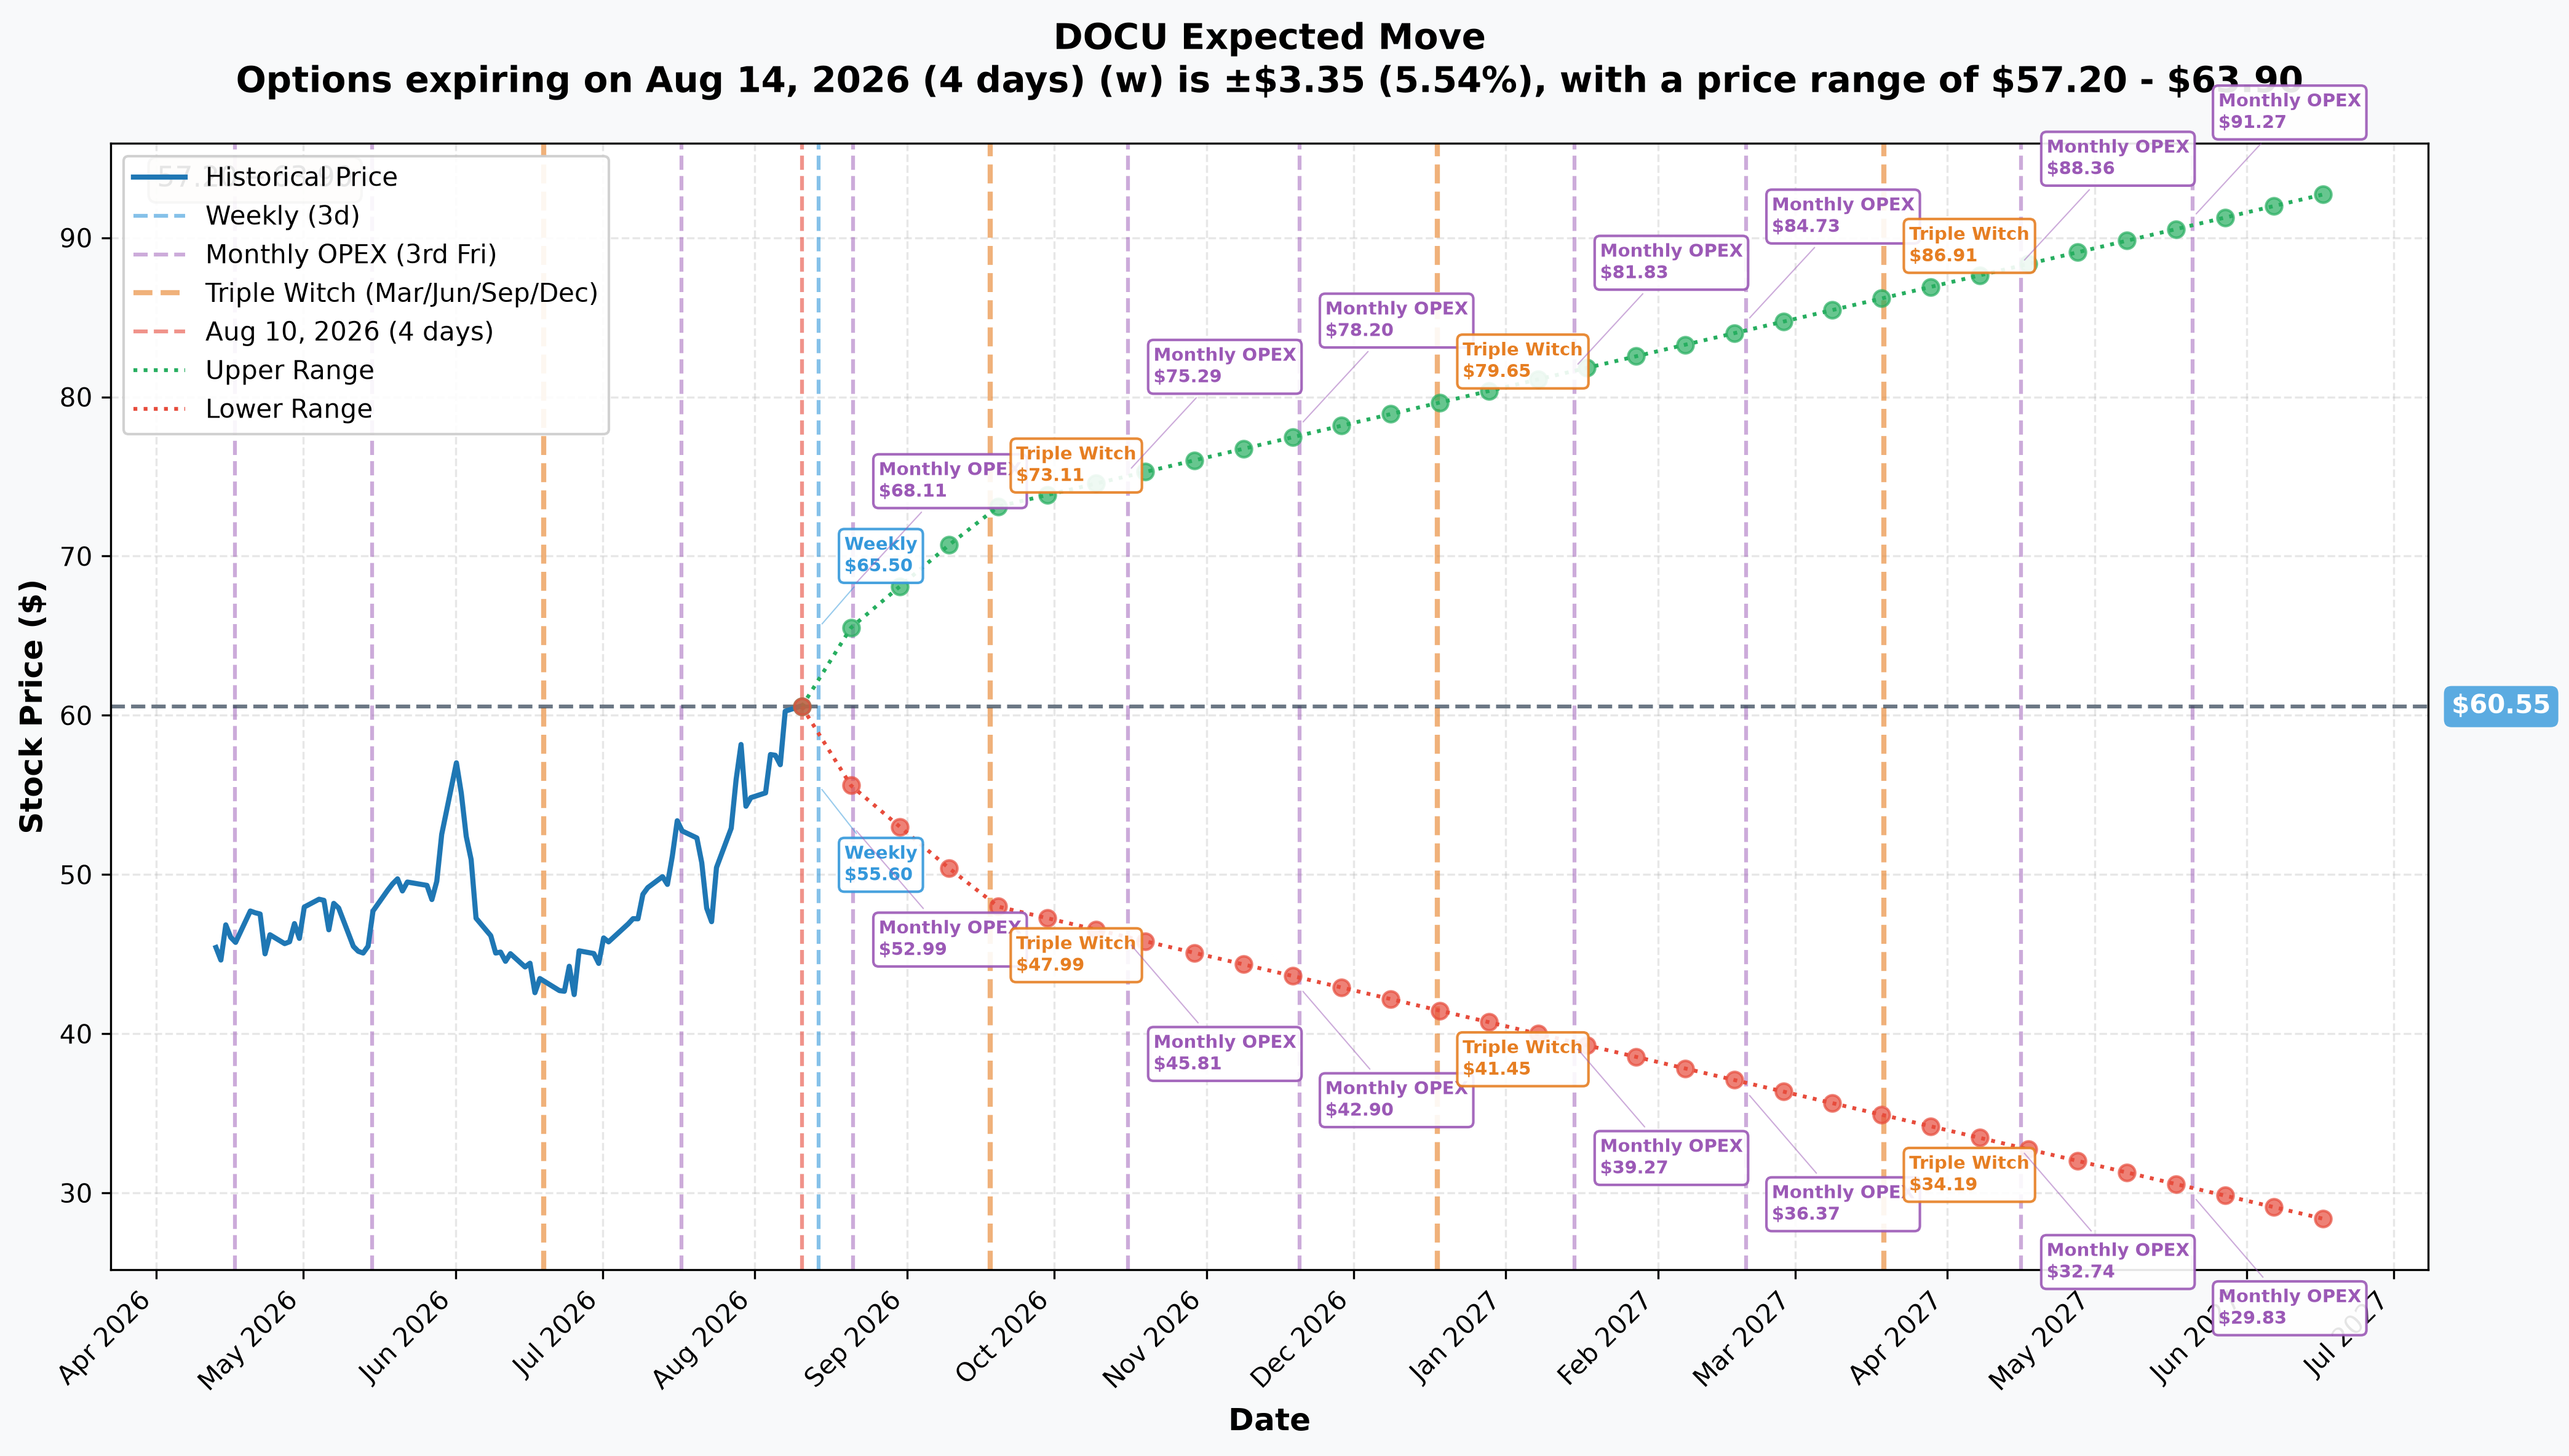
The options market's own pricing of expected ranges, from nearest to furthest available tenor:
| Expiry | Days out | Implied move | Range |
|---|---|---|---|
| Weekly (2026-08-14) | 4 | ±5.54% (±$3.35) | $57.20 – $63.90 |
| Monthly OPEX (2026-08-21) | 11 | ±8.62% (±$5.22) | $55.33 – $65.77 |
| Quarterly triple witch (2026-09-18) | 39 | ±20.62% (±$12.49) | $48.06 – $73.04 |
| Yearly LEAPS (2027-06-17) | 311 | ±53.24% (±$32.24) | $28.31 – $92.79 |
Important honesty check: the furthest tenor the implied-move data actually reaches is 2027-06-17 (311 days out) — it does not extend to the trade's real January 21, 2028 expiration (529 days out). We should not fabricate a precise number for that date. What we can say: even at 311 days, the market already prices a range wide enough ($28.31–$92.79) to comfortably straddle both the $64.90 breakeven and the $77.50 strike in either direction, and the furthest labeled OPEX bracket in the dataset (2027-05-21, range $29.83–$91.27) tells the same story — this stock's own option market treats an 8%-plus move in either direction as unremarkable over a horizon this long.
🎪 Catalysts
Near-term calendar (through ≈February 2027) — 2 earnings reports fall here
Docusign runs a January 31 fiscal year end, so its fiscal quarters are offset from the calendar. Mapped carefully:
- ≈August 13–17, 2026 (expected): Docusign typically issues an "earnings timing" press release about three weeks ahead of results — the Q1 FY2027 timing release came May 15, 2026 for a June 4 report. Expect the Q2 confirmation around this window.
- September 3, 2026 — Q2 FY2027 earnings (quarter ended July 31, 2026), listed on the company's quote page but not yet company-confirmed. Company guide: revenue $865–$869M (≈8% YoY), non-GAAP operating margin 29.7%–30.2%, per the Q1 FY2027 results release. The number to watch beyond the headline beat/miss is IAM as a percentage of total ARR — it moved from 10.8% (Jan 31, 2026) to 12.6% (Apr 30, 2026), a +1.8-point jump in one quarter, per the same release.
- ≈Early December 2026 — Q3 FY2027 earnings (quarter ended October 31, 2026), date not yet announced; based on cadence.
Why September 3 matters more than usual: on June 5, 2026, Docusign beat both revenue and EPS consensus and the stock still fell 7.22% because the forward guide only met expectations rather than beating, per the price history. Docusign no longer discloses billings — its headline growth metric is now total ARR, guided to 8.25%–8.75% for FY2027. The beat has not been the catalyst this year; the guide has been.
The long-horizon window (to January 21, 2028) — 6 earnings reports fall here
Counting on the actual fiscal calendar between today and expiration, six quarterly reports land inside this position's life: Q2 FY2027 (Sep 2026), Q3 FY2027 (≈Dec 2026), Q4/full-year FY2027 (≈mid-March 2027, includes the initial FY2028 guide), Q1 FY2028 (≈June 2027), Q2 FY2028 (≈Sept 2027), and Q3 FY2028 (≈Dec 2027).
Multi-year milestone to track: the IAM mix. If the +1.8-percentage-point-per-quarter cadence observed between January and April 2026 simply held in a straight line (a scale check, not a forecast — real adoption curves rarely stay linear), IAM would be running near ≈25% of total ARR by January 2028, up from 12.6% today.
One important distinction the reader must not confuse: September 3, 2026 is a Docusign catalyst — something the company does. January 21, 2028 is only when this option contract stops existing. Nothing happens at Docusign on that date; it simply determines whether this structure ends up in the money.
What would have to be true by early 2028
For the synthetic long to clear its $64.90 breakeven (only ≈7.7% above today's spot), any combination of the following would help: total ARR growth inflecting meaningfully above the current 8.25%–8.75% guide (an analyst called double-digit growth a "long-term aspiration" on the June 5 earnings tape); the IAM mix crossing 20%+ of ARR at a comparable or better price point than the legacy seats it replaces; the AI agent/Agent Studio rollout that began general availability in July 2026 actually showing up in bookings rather than remaining press releases; and continued buyback execution — Docusign repurchased $317.5 million in Q1 FY2027 alone against an $11.56B market cap, per the same release.
Working against it: sell-side consensus is currently 16 Hold ratings out of 22 analysts, with an average target of $59.33 — below today's spot, per the forecast page; the stock is +23.13% in the past month with no company press release since July 1, 2026, per the news tape, meaning the rally itself isn't sourced to a fundamental trigger; and software names including DOCU have twice in 2026 been dragged down by sector-wide events unrelated to company execution (the February "SaaSpocalypse" and an April software-sector plunge).
👥 Four-Reader Interpretation
🎰 YOLO Trader
This isn't your trade to copy directly. The structure only prints a credit because of the deep-ITM short put — replicate it with 1 contract instead of 2,200 and you're still on the hook to buy 100 shares at $77.50 if assigned, no matter how far the stock falls, and your broker will demand real margin for that obligation (likely far more than the $1,260 credit you'd collect). If you want synthetic upside exposure on a smaller scale, understand you're taking on stock-like downside risk with none of the "my max loss is what I paid" comfort of a simple long call.
📊 Swing Trader
There's nothing here to swing-trade off of. This is a 1.45-year structural position, not a near-term directional signal — the desk isn't telling you DOCU moves this week or this month. If anything, treat the September 3 earnings guide as your actual near-term signal, and treat this trade as background context: institutional money is willing to carry synthetic exposure at ≈4.3% annualized cost, which is a mild, unremarkable vote of confidence at best, not an urgent one.
💰 Premium Collector
Pay close attention here — one leg of this package is a sold put, and it's worth understanding exactly what that obligates you to. Selling a $77.50 put when the stock is at $60.27 means you are deep in the money already — you are effectively agreeing today to buy the stock ≈28.6% above where it trades, and you'll be assigned early risk and full downside exposure the whole way down. This is nothing like a conservative out-of-the-money cash-secured put sold for a small edge; the $24.95 premium collected here is mostly ($17.23 of it) just the intrinsic value of a bet that's already deep against the seller unless the stock rallies. A retail premium-collector replicating only the put leg alone — without the offsetting long call — would be taking on outright bearish-to-neutral risk with a very large capital commitment, not a defined, modest-risk income trade.
🌱 Beginner
Think of this whole package as a way to "act like you own the stock" without paying for it up front. Buying a call gives you upside if the stock rises; selling a put at the same strike and date takes away your protection if the stock falls, obligating you to buy the shares anyway. Put those two together and you've synthetically recreated owning the stock — with all of its downside risk, and here, actually being paid $2.77M to do it because of how far above the stock price the strike sits. The lesson worth taking away: getting paid to open a position doesn't mean the position is low-risk. This one can lose money exactly like owning 220,000 real shares can.
⚠️ Honest Limits — What the Tape Cannot Prove
- We cannot tell financing from conviction. The ≈4.3% annualized implied cost is consistent with plain-vanilla cost-of-carry, which is why we lean toward reading this as a financing or conversion package rather than a bullish bet — but the tape alone cannot rule out a genuine directional view dressed up in efficient structure.
- We cannot see any offsetting position. If this desk holds an offsetting short-stock or dealer-inventory leg elsewhere, the whole package could carry zero net directional exposure. Options tape never shows equity or futures hedges executed away from the listed option print.
- We do not know the counterparty or the motive. A floor block confirms a known counterparty negotiated the trade — it does not tell us who that counterparty is, whether this was a customer facilitation, or the specific business reason behind it.
- We could not benchmark the implied ≈4.3% rate against a live risk-free rate in this research pass, which is the correct test for confirming "plain financing" versus "paying up" or "hard-to-borrow." Treat the financing read as the best available inference, not a proven fact.
- Both legs are proven opens by size vs. prior OI — that part is solid. What remains genuinely unprovable from today's tape is why the position was built this way.
Disclaimer: Options trading involves substantial risk of loss and is not suitable for all investors. This analysis is for educational purposes only and is not financial advice. Selling puts, even as part of a synthetic structure, carries risk equivalent to owning the underlying shares — full downside exposure with no floor. Always size positions appropriately and consider consulting a licensed financial advisor before trading.
Last updated: 2026-08-11 (pre-market) — the next-day OPRA open-interest snapshot resolved this session's provisional flags. Both legs OPEN, on the published numbers: Jan-2028 $77.50C 58 → 2,222 (predicted ≈2,258) and $77.50P 5 → 2,214 (predicted ≈2,205). The synthetic long stock position is confirmed new. The ⏳ callout was replaced with the ✅ RESOLVED box.