🌍 EEM $7.5M Block Cross — Dec-2027 $65 Put Hedge on Emerging Markets
Published June 16, 2026 · Last updated 2026-06-17
✅ Updated 2026-06-17: Next-day OPRA OI confirms a clean fresh open — the Dec-2027 $65 put rose 0 → 10,000 (Δ +10,000 = exactly the size traded). Brand-new long-put hedge confirmed; no pre-existing position to close.
Quick Take
A desk crossed a 10,000-contract block of December-2027 $65 puts on iShares MSCI Emerging Markets ETF (EEM) this morning at ≈$7.45 per contract — ≈$7.5M in total premium. The strike sits ≈6.5% below spot (EEM at ≈$69.49), the expiry is ≈18 months out, and prior open interest on this exact strike was zero, confirming a fresh position. The mechanism was a negotiated block cross — a known counterparty took the other side off the open order book. This is the signature of a large institution buying multi-year tail-risk insurance on an existing emerging-markets allocation, not an aggressive directional short.
Company Overview
iShares MSCI Emerging Markets ETF (EEM) tracks the MSCI Emerging Markets Index, providing exposure to ≈1,200 large- and mid-cap companies across 24 EM countries. China is ≈25% of the fund (Tencent, PDD Holdings), and the two largest single-name weights are Taiwan Semiconductor and Samsung Electronics — making the ETF a concentrated proxy for global technology supply chains, dollar sensitivity, and China's economic trajectory. EEM gained ≈33% over the prior twelve months, driven by North Asia semiconductor and AI-related earnings, but that same concentration creates outsized tail risk if the dollar firms, China's deflation deepens, or Taiwan-Strait tensions escalate. As of June 16, 2026, EEM trades at ≈$69.49, with a market cap in assets under management exceeding $40B.
Option Flow Breakdown
| Field | Detail |
|---|---|
| Date | June 16, 2026 |
| Time | 10:06:56 ET |
| Symbol | EEM Dec-2027 $65 Put |
| Buy / Sell | BUY |
| Call / Put | PUT |
| Expiration | December 17, 2027 |
| Strike | $65.00 |
| Volume | 10,000 contracts |
| Open Interest (Prior) | 0 |
| Premium (per contract) | ≈$7.45 |
| Total Premium | ≈$7,500,000 |
| Spot at Print | ≈$69.49 |
| Strike Distance | ≈6.5% OTM |
| Days to Expiry | ≈549 days (≈18 months) |
| Order Type | BTO (Buy to Open) |
| Flow Tag | 🤝 BLOCK CROSS |
| Option Leg Link | EEM Dec-2027 $65P |
✅ RESOLVED — Next-Day OI Confirms a Clean Open (2026-06-17)
| Leg | Pre-print baseline (EOD 2026-06-15) | Resolving (EOD 2026-06-16) | Δ | Verdict |
|---|---|---|---|---|
| Dec-2027 $65P | 0 | 10,000 | +10,000 | OPEN — fresh long-put hedge (BTO) confirmed |
The next-morning OPRA snapshot lands exactly on the prediction: open interest rose from 0 to 10,000, a +10,000 increase equal to the size traded. With no prior open interest, there was nothing to close — this is unambiguously a brand-new long-put position.
🤓 What This Actually Means — Plain English
Order type: BTO — a desk paid $7.5M in premium to open 10,000 long put contracts. Long puts profit if EEM falls below $65 before expiry; the maximum loss is the $7.5M premium paid if EEM stays above $65 through December 2027.
Mechanism: The trade was a block cross — a broker matched the buyer with a known counterparty in a negotiated, off-order-book transaction. This is categorically different from an urgent lit sweep (where an institution hits every resting offer on the open market). A cross says: two parties agreed on price and size in advance; a broker facilitated the transfer. The premium changed hands, but there was no urgency signal at the open-book level.
Structure: A single-leg, slightly-OTM long put with ≈18 months of runway. This is the textbook geometry of portfolio tail insurance, not a near-term short bet:
- A speculator betting on an imminent EEM drop would typically buy short-dated, closer-to-the-money puts to maximize leverage.
- A hedger protecting a large existing EM book buys long-dated, OTM puts precisely because they are cheaper per day of coverage, survive multiple macro catalysts, and don't need to be rolled for 18 months.
Who does this? A large institutional investor — a sovereign wealth fund, endowment, pension, or multi-strategy fund — that holds a substantial EM equity allocation and wants to be protected if the whole trade reverses. At $7.5M in premium, this is serious insurance spend. The cross mechanism reinforces it: institutions that are hedging their own book often negotiate off-market rather than telegraphing the hedge to the lit market.
What the tape CANNOT tell us: We cannot see the underlying EM portfolio being hedged, the hedge ratio (how many dollars of EM exposure this $7.5M protects), or the identity of the counterparty. The put could also theoretically be a standalone bearish bet by a trader who does not hold EEM — the structure allows it. The balance of evidence (block cross, ≈18 months, slightly OTM, zero prior OI) tilts heavily toward the hedge interpretation, but conviction is medium rather than high.
Bottom line for the reader: A known counterparty took the other side. This is not urgency or panic — it is a desk paying real money to be covered if emerging-market equities fall materially over the next year and a half.
Technical Setup
EEM Year-to-Date Performance
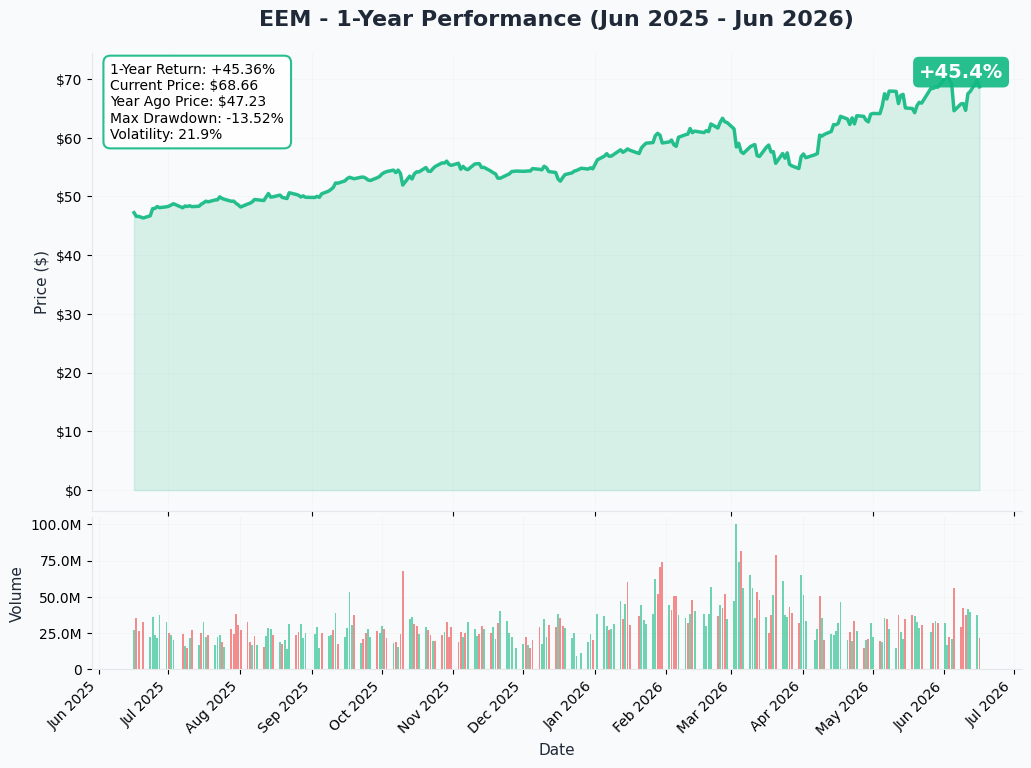
EEM has been on a strong uptrend over the past twelve months — up ≈33% — powered by Taiwan and Korea semiconductor names. The YTD chart shows a well-defined ascending structure, but the rally has brought EEM into a zone where the upside gamma is heavily concentrated (the $70 resistance wall, detailed below), which can act as a speed bump.
Gamma Support & Resistance Levels
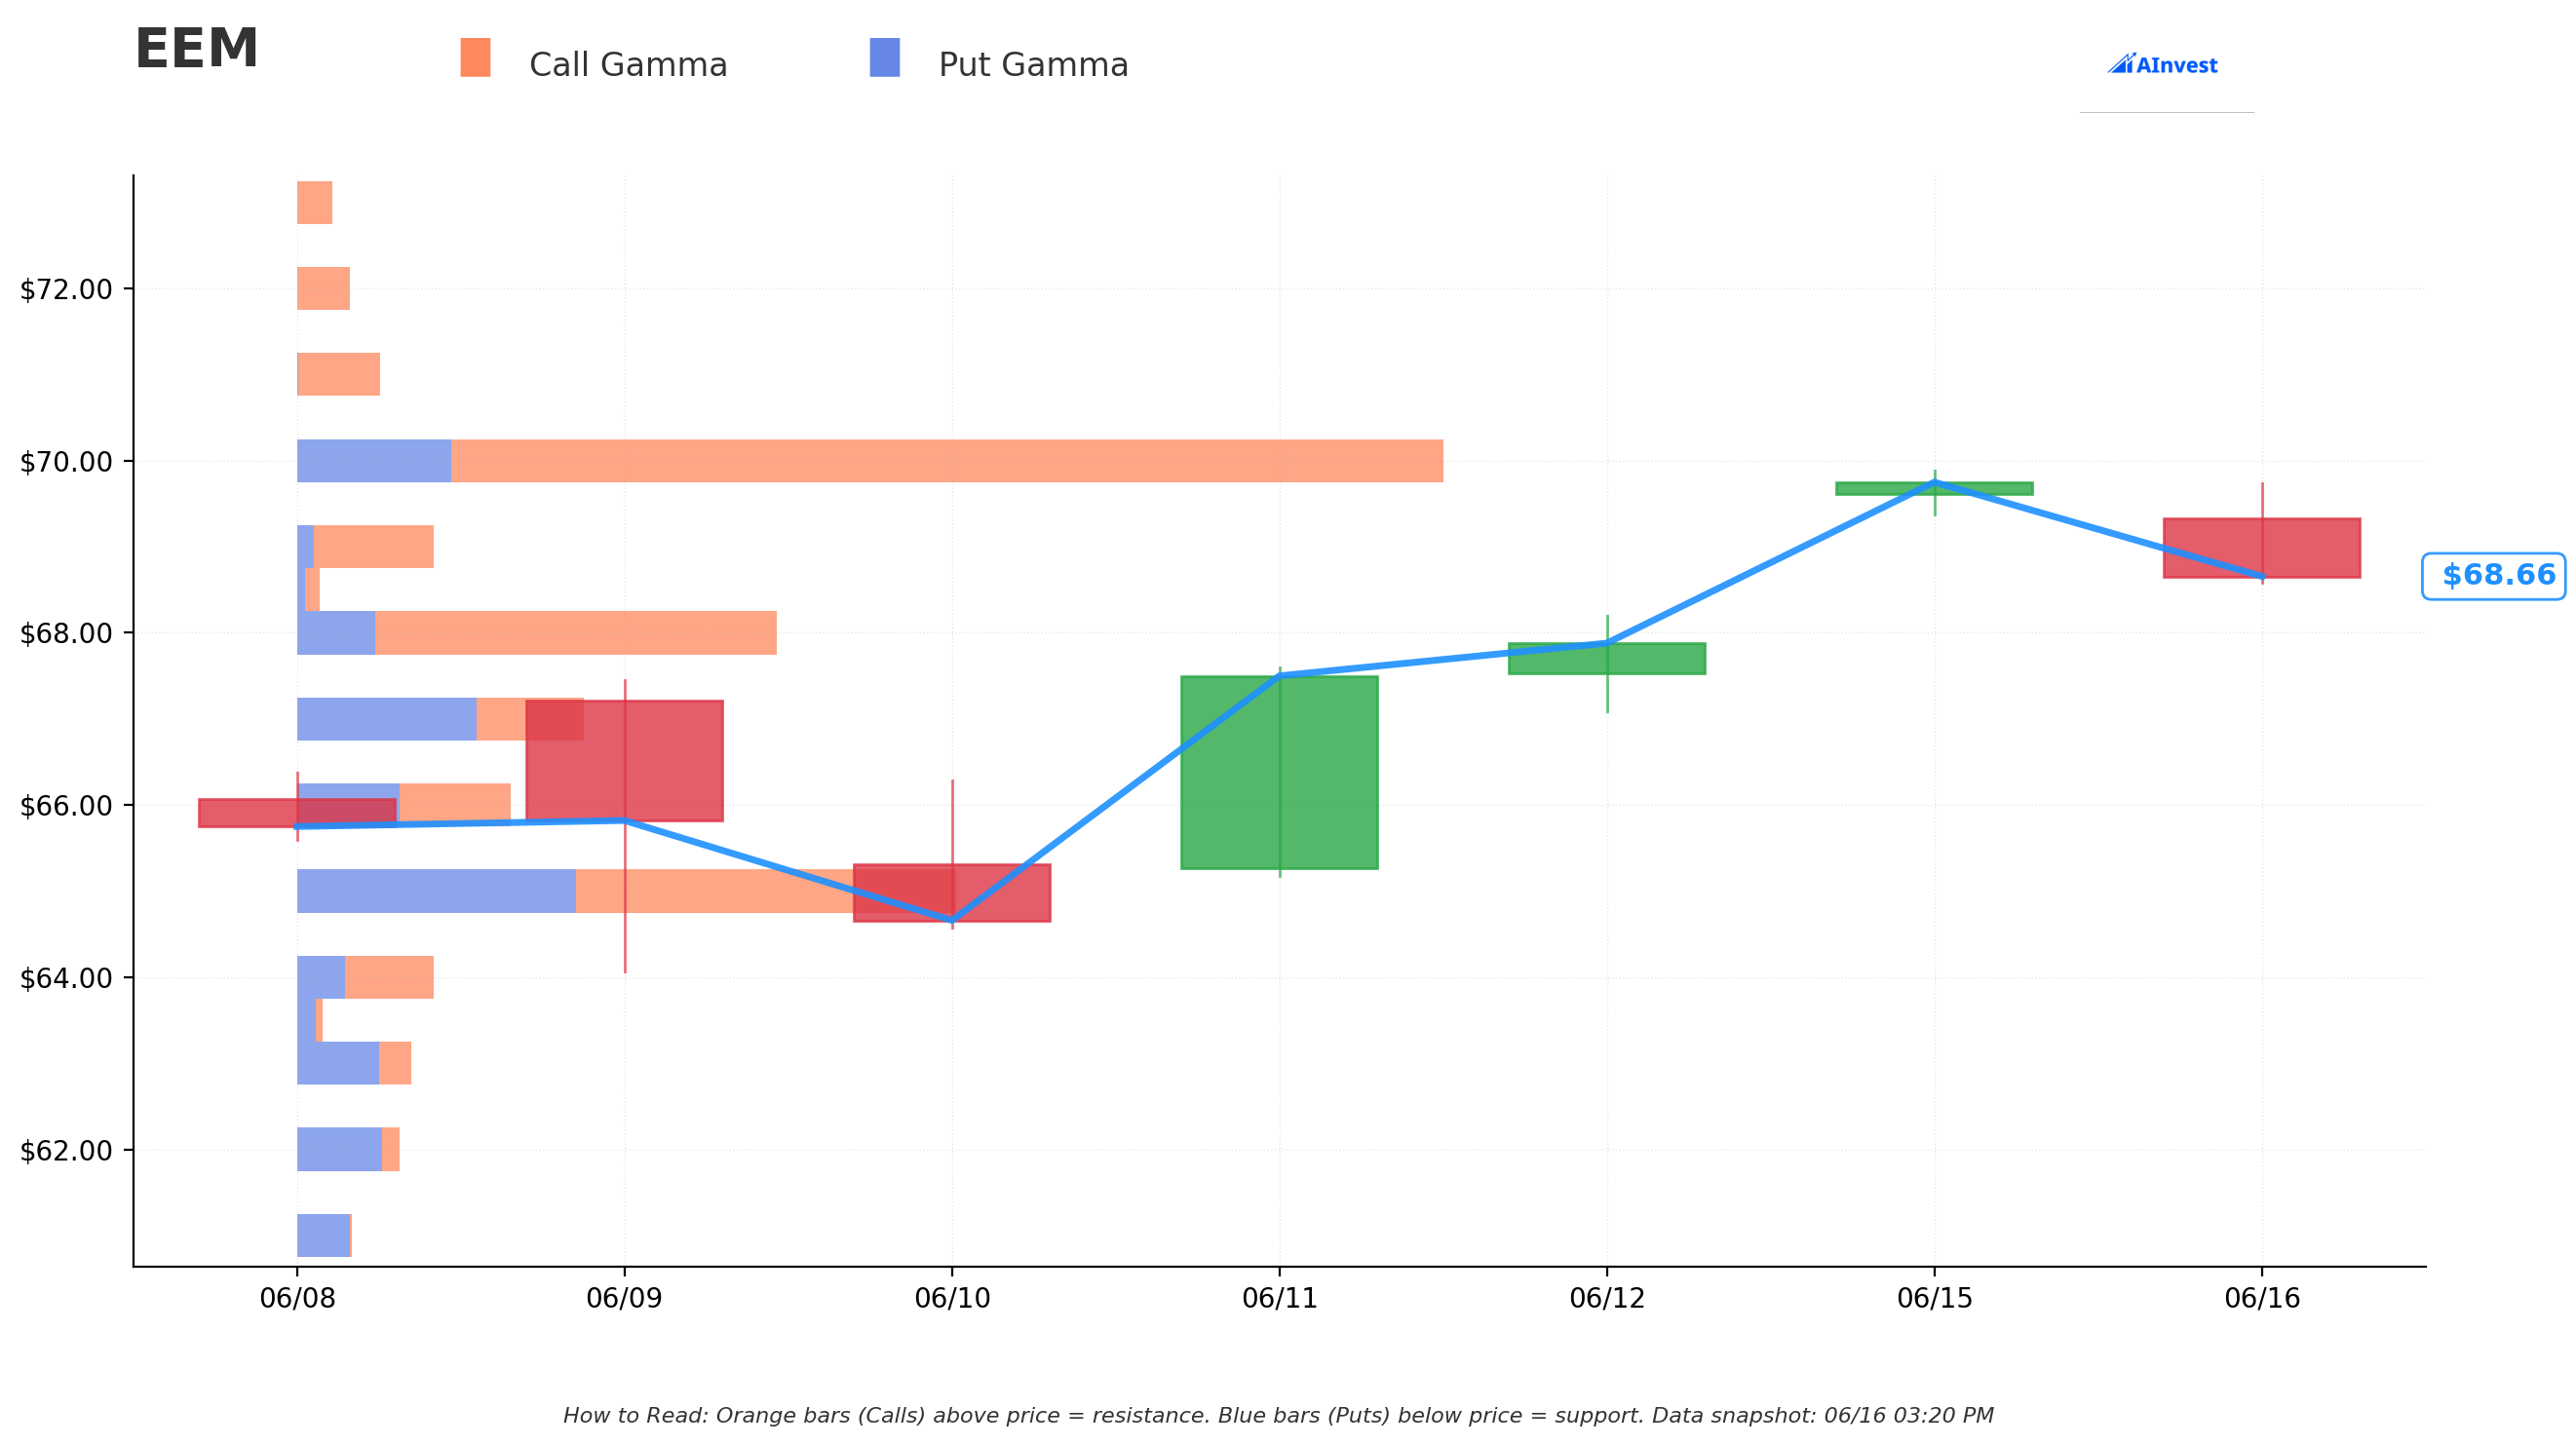
The current open-interest gamma structure creates a tight band around spot:
Key Resistance:
- $70.00 — Dominant resistance wall; total gamma ≈228 units, net call gamma ≈166 units. This is the single largest gamma concentration in the entire chain, ≈1.9% above spot. Dealers are short gamma here on the call side, which means they sell into rallies near $70 — a mechanical headwind.
- $69.00 — Secondary resistance wall; ≈27 units net call gamma at just ≈0.4% above spot. Essentially a first speed bump before $70.
Key Support:
- $68.00 — Nearest support wall; ≈95 units total gamma, ≈1.0% below spot. A large call-heavy book creates dealer long-delta demand on dips to $68, providing near-term cushion.
- $67.00 — Second support cluster; ≈57 units total gamma at ≈2.5% below spot. Notably put-heavy (net put GEX negative), so dealer hedging flips supportive here.
- $66.00 — Additional support band at ≈4.0% below spot; ≈42 units.
- $65.00 — Very Strong Support Wall; ≈131 units total gamma at ≈5.4% below spot. This is the STRIKE of the put that was crossed today — substantial open interest at this level. If EEM were to trade down toward $65, dealer gamma positioning would mechanically cushion the move. Importantly, the newly crossed 10,000-put block now adds even more put open interest at $65, reinforcing this level as a key gamma magnet.
The practical takeaway: EEM is pinned between a dominant resistance wall at $70 (≈1.9% up) and a very strong support cluster at $65 (≈5.4% down, which is also the hedge strike). The gamma structure gives dealers a strong incentive to keep EEM in this range near-term.
Implied Move Cone
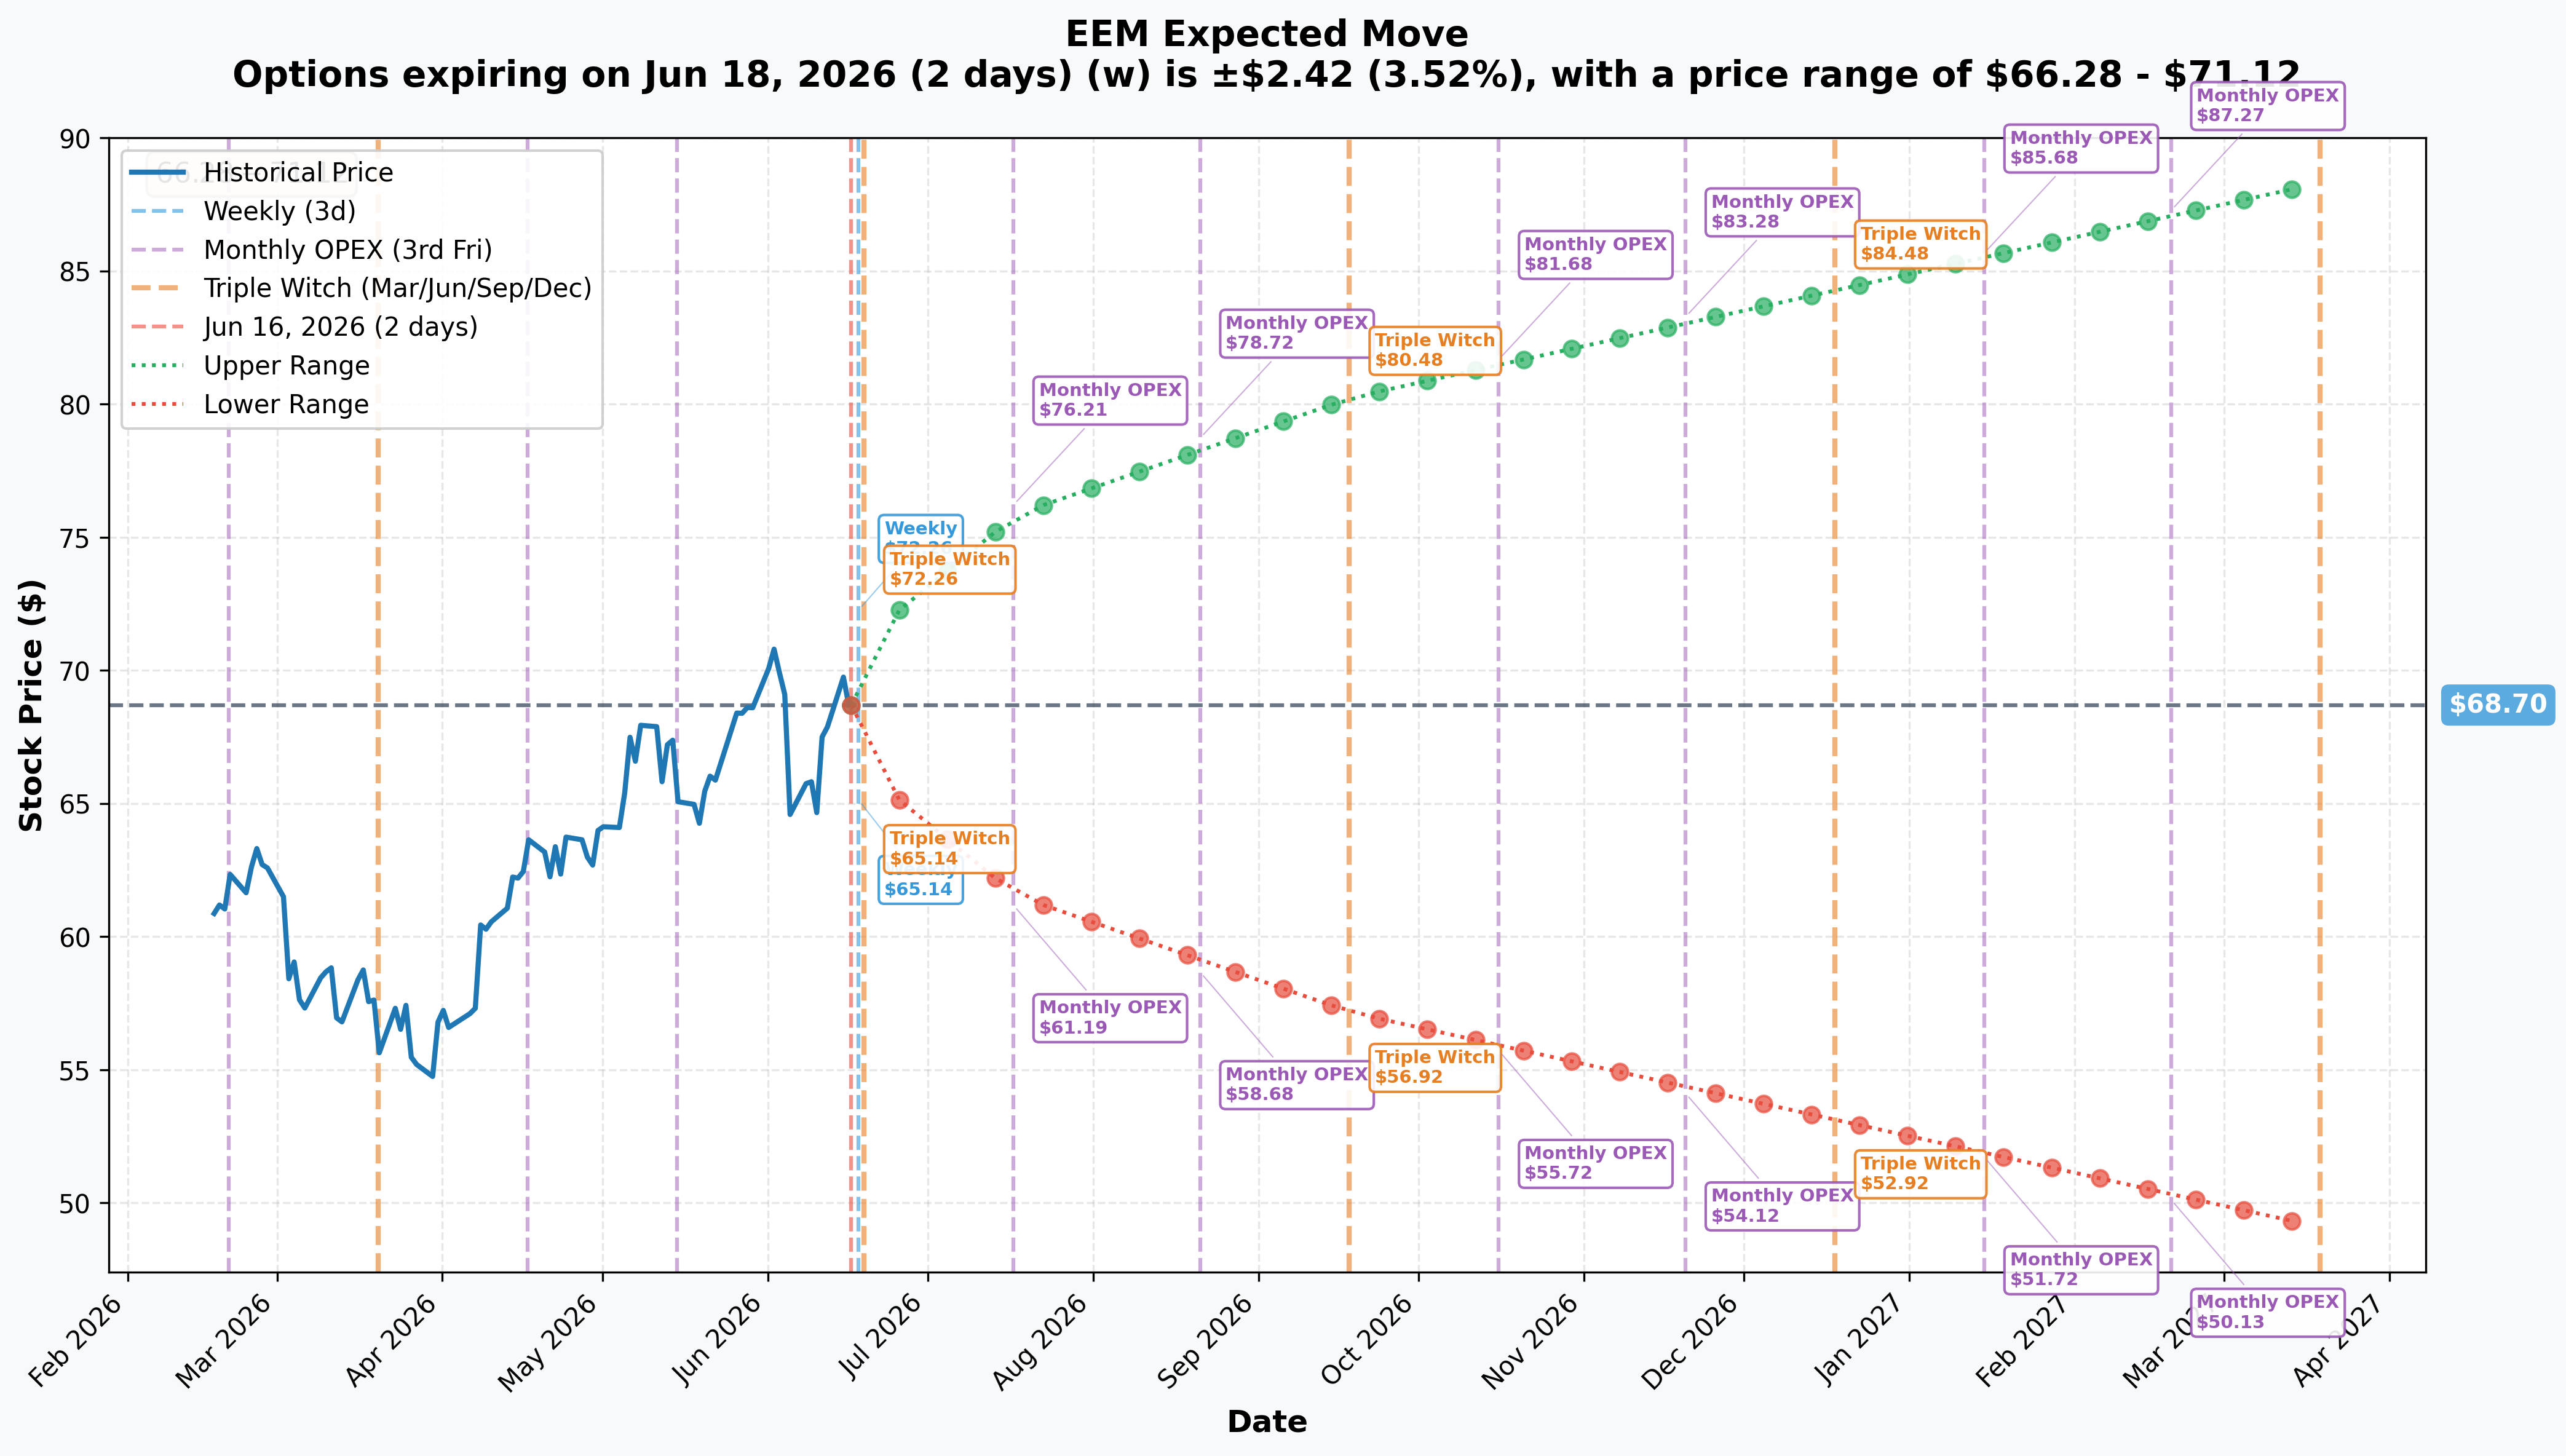
Options are pricing the following moves from current spot (≈$68.70):
| Timeframe | Expiry | Implied Move | Upper | Lower |
|---|---|---|---|---|
| Weekly | June 18, 2026 | ±3.52% (±$2.42) | $71.12 | $66.28 |
| Monthly OPEX | July 17, 2026 | ±10.42% (±$7.16) | $75.86 | $61.54 |
| Quarterly | September 18, 2026 | ±16.83% (±$11.56) | $80.26 | $57.14 |
| LEAPS | March 19, 2027 | ±28.59% (±$19.64) | $88.34 | $49.06 |
Key observations:
- The FOMC (June 16-17) is priced into this week's ±3.52% implied move — the market is not ignoring it.
- The Dec-2027 $65 put strike corresponds to a move below the lower end of the quarterly implied move cone by September 2026. In other words, the market's own implied vol says EEM reaching $65 would require roughly a 1-sigma or worse adverse move.
- The yearly LEAPS lower bound of ≈$49.06 shows the true tail being priced: a catastrophic EM scenario could take EEM far below the $65 hedge strike, which is exactly the scenario this put is designed to pay off in.
Catalysts
The macro calendar is unusually dense right now. Multiple near-term events could trigger the kind of risk-off episode this put is designed to survive.
This Week
-
FOMC (June 16-17, 2026) — Warsh's debut. Kevin Warsh chairs his first FOMC meeting today and tomorrow. A hold at 3.50%-3.75% is ≈97% priced, but the critical read is the statement language: economists broadly expect the Fed to drop its prior easing bias for a neutral or hawkish stance, and markets are even contemplating a future hike. Under a higher-for-longer Fed and a new, untested chair, EM currencies and equities face continued headwinds — EM FX won't stage significant recoveries while the Fed stays cautious on cuts. A hawkish statement tomorrow is the first test for this hedge.
-
MSCI 2026 Global Market Accessibility Review (June 18, 2026). MSCI announces its accessibility review results on June 18 — any country reclassification or index composition change directly affects EEM's holdings and weights.
-
MSCI 2026 Annual Market Classification Review (June 23, 2026). The annual classification results on June 23 could include potential EM country upgrades or downgrades that reprice EEM's underlying exposure.
The Dollar / DXY — The Master Switch for EM
DXY has firmed back toward ≈99, and consensus forecasts show a 2026 range of roughly 93-100. The entire EEM bull case rests on the dollar resuming a slide — overseas hedge ratios are at historically low levels, and most desks read hedging costs as dollar-bearish into late 2026. But State Street's EM research flags the historical pattern clearly: "when the dollar surged, these crowded trades declined quickly… driving simultaneous declines in gold and EM equities." The put pays off precisely in the scenario the consensus is dismissing.
China — ≈25% of EEM, Stuck in Deflation
China's growth is forecast to slow to ≈4.5% in 2026, with the property sector still declining and the IMF urging fiscal stimulus "until deflationary pressures subside durably." More alarmingly, China has now run ≈10 consecutive quarters of deflation, and Eurasia Group ranks this deflation trap as a top geopolitical risk for 2026, arguing Beijing will not aggressively counter it. China's record trade surplus (≈$1.2T in 2025) is its primary growth lever — and that lever is directly in the US tariff crosshairs.
- China Q2 GDP (mid-July 2026). The first big data test of whether 4.5% growth and deflation are improving or worsening. A miss sends EEM toward the lower implied move band.
Taiwan / Semiconductor Concentration — The Fat Tail
Taiwan Semiconductor and Samsung are EEM's top individual holdings. At the May 14, 2026 Trump-Xi summit, Xi placed Taiwan "at the center," calling it "the most important issue" and warning of "clashes and even conflicts" if not handled properly — also confirmed by CBS News reporting. Modeling of a chip-supply disruption from a Taiwan-Strait conflict puts the global GDP hit above 15%. This is a low-probability but catastrophic scenario — precisely the kind of risk that 18-month OTM puts are designed to cover cheaply.
Trade / Tariffs
US-China tariffs briefly exceeded 100% before both sides pulled back; analysts now expect "stabilization," but the truce is fragile. Export-driven Korea, Taiwan, and China remain directly in the tariff crosshairs, and Lazard's EM Outlook 2026 notes that tariff uncertainty remains a structural EM headwind.
Forward Macro Calendar
| Date | Event | EM Relevance |
|---|---|---|
| Jun 16-17, 2026 | FOMC (Warsh debut) | Dollar, rates, EM FX |
| Jun 18, 2026 | MSCI Market Accessibility Review | EEM composition |
| Jun 23, 2026 | MSCI Annual Market Classification | Country reclassifications |
| Mid-Jul 2026 | China Q2 GDP | ≈25% of EEM |
| Jul 28-29, 2026 | FOMC | Rate path |
| Sep 15-16, 2026 | FOMC + Dot Plot | First full projections under Warsh |
| Oct 27-28, 2026 | FOMC | Rate path |
| Nov 2026 | MSCI Semiannual Index Review | EM rebalance |
What This Means for Four Types of Readers
🎯 YOLO / Near-Term Trader
This block cross is NOT a signal to pile into near-term EEM puts. The institution bought Dec-2027 expiry for a reason — they need time. Short-dated puts are expensive after any volatility spike, and a desk with an ≈18-month hedge is not forecasting an imminent crash. If you chase this with weekly or monthly puts, you're paying elevated vol for a thesis that may take a year to play out. The near-term gamma setup actually favors EEM staying rangebound between $65 and $70 (both are dominant gamma walls). Risk of theta bleed is high on short-dated puts here.
📊 Swing / Multi-Week Trader
The more actionable read is the gamma map. EEM faces a very strong gamma resistance wall at $70 — ≈1.9% above spot — that dealer hedging actively suppresses. A failed breakout above $70 near the FOMC decision (June 17) would be consistent with the gamma structure and could set up a pullback toward $68 (nearest support wall, ≈1.0% down) or $67 (≈2.5% down). The block-cross hedge adds context: institutional conviction that EEM may struggle over 18 months. A swing put position targeting $67-$66 on a FOMC disappointment has a more grounded risk/reward than trying to front-run an 18-month hedge.
💰 Premium Collector / Covered-Call Writer
The $70 call strike is the single biggest gamma wall in the chain (≈228 units total). If you own EEM shares and are looking to collect premium, selling covered calls at $70 aligns with the structural resistance the gamma map is already providing. Dealers who are short gamma at $70 will be selling into any rally toward that level — that's your mechanical ally. Note that the implied move for this week is ±3.52%, which captures FOMC and the MSCI review; weekly premium sellers should be aware the vol surface reflects those events.
🔰 Beginner
An institution just paid $7.5 million for the right to sell EEM shares at $65 anytime before December 2027. EEM is at ≈$69.49 today, so that price ($65) is about 6.5% below current levels — it's like buying insurance that pays off if EEM falls more than 6.5% and stays down over the next year and a half. The fact that a KNOWN counterparty took the other side (it was a negotiated, off-market deal) means this is NOT a panic trade. Think of it as a large fund manager saying: "I own a lot of emerging market stocks. I'm going to pay $7.5 million now so that if the whole EM trade blows up over the next 18 months, I'm protected." The fund manager may still be bullish on EM — they just want a safety net.
Risk & Honest Limits
What this analysis CANNOT prove:
- Identity and motive: We cannot see the underlying portfolio being hedged. The $7.5M put could theoretically be a standalone directional bet rather than a portfolio hedge — the tape does not distinguish these.
- Hedge ratio: We do not know how many dollars of EM exposure this put covers. $7.5M of puts hedging a $500M EM book is modest protection; hedging a $50M book would be extreme over-hedging.
- Counterparty direction: A block cross has a known counterparty, but that counterparty may be a dealer facilitating the trade, not a natural seller with an opposing view. We cannot infer from a cross that a sophisticated seller thinks EEM is going up.
- The bull case is real: Lazard's 2026 EM outlook and Capital Group's 2026 EM analysis both present a credible case for continued EM outperformance if the dollar weakens and China stabilizes. Buying a hedge does not mean the hedger is right — EEM could rally another 20% and the put expires worthless.
- Confidence on open/close: HIGH — prior OI was 0, so the position is confirmed as a new opening trade. The only caveat is a same-day cancellation; next-morning OI is the definitive confirmation.
Key risks to the hedge trade:
- EEM rallies above $70 (gamma resistance) and sustains — the put loses value on the vol and delta path.
- The dollar resumes its downtrend — EM outperforms; the put decays at ≈$0.014/day in theta at current implied vol.
- China surprises with stimulus that breaks the deflation cycle — the single biggest fundamental risk to the put.
- FOMC is perceived as dovish despite Warsh — a "higher-for-longer but not higher" read that rebounds EM.
Bottom Line
A single desk crossed a 10,000-contract block of December-2027 $65 EEM puts today for ≈$7.5M — a fresh open (prior OI was zero) via a negotiated block cross with a known counterparty. The structure, mechanism, and timing (FOMC day, after a ≈33% EM rally) all point to a large institution buying multi-year tail insurance on an existing emerging-markets allocation rather than making a speculative directional bet. The hedge pays off if EEM falls below ≈$57.55 at expiry (accounting for the $7.45 premium cost), or rises in value on any sharp EM risk-off move well before then.
The gamma structure (dominant resistance wall at $70, very strong support at $65 — the hedge strike itself) and the macro calendar (FOMC hawkish risk today/tomorrow, China GDP in July, Taiwan/tariff headlines continuously) frame exactly why a patient desk would pay for this protection now rather than waiting.
Block cross, known counterparty, negotiated off-market — weigh the hedge framing heavily, and do not read urgency or panic into the premium size. A $7.5M hedge on an extended EM book is prudent risk management, not a call for imminent collapse.
✅ RESOLVED (2026-06-17): The Dec-2027 $65 put OI rose 0 → 10,000 (Δ +10,000 = the size traded). The opening is fully confirmed as a fresh long-put hedge.
Last updated: 2026-06-17 — next-day OPRA OI confirmed a clean fresh open (+10,000).
Options trading involves substantial risk of loss and is not suitable for all investors. This article is for informational and educational purposes only and does not constitute investment advice. Past unusual options activity does not predict future price direction. Always consult a qualified financial professional before making investment decisions.