🛡️ EEM $25M Call-Selling "Whale" Is Actually a Fully Hedged Premium Trade — Not a Bearish EM Bet
📅 2026-08-04 | 🔥 Unusual Activity Detected — $25.09M Net Credit
🎯 The Quick Take
A desk sold 62,500 December 2026 $68 calls on EEM across five clips this morning — and bought 3,000,000 shares of EEM stock at the same moment, in sizes that match the options' delta to within 1.4%, every single time. That is not a bet against emerging markets. It's a desk harvesting rich option premium while staying close to market-neutral. Two smaller, still-unproven pieces round out the day: another 4,498 Dec $70 calls sold, and a Jan-2027 risk reversal (short $70 call, long $65 put) that leans mildly bearish on a much smaller scale. Total net premium collected across all eight legs: $25,089,360 credit.
🏢 What Is EEM, Really?
EEM is the iShares MSCI Emerging Markets ETF — a ≈$28–30B fund tracking the MSCI Emerging Markets Index, 1,322 holdings, charging a 0.72% expense ratio, running since 2003.
Here's the part most retail traders get wrong: EEM is not really a China fund. It's a semiconductor fund that happens to carry an "emerging markets" label. Information Technology is 45.26% of the index, and just three chip names — TSMC, Samsung, and SK hynix — are ≈30.9% of the whole thing. Country-wise, Taiwan (27.34%) is the single largest weight, South Korea is second (23.72%), and China is only third (19.03%). Tencent and Alibaba combined are just 4.33% of the index — smaller than TSMC alone. If you're trading EEM as a China proxy, you're trading the wrong 20 points of the fund.
EEM is +20.27% YTD and +35.11% over the past year, sitting roughly 8% below its 52-week high, in a rally that's almost entirely a Taiwan/Korea semiconductor earnings story rather than a currency or China-stimulus story.
💰 The Option Flow Breakdown
📊 What Just Happened — The Full Trade Table
| Time (ET) | Buy/Sell | Call/Put | Expiration | Strike | Option Price | Size | Volume | Prior OI | Spot | Premium | Option Symbol |
|---|---|---|---|---|---|---|---|---|---|---|---|
| 10:11:42 | SELL | CALL | 2026-12-18 | $70 | $3.20 | 4,498 | 7,500 | 63,014 | $65.56 | $1,439,360 | EEM20261218C70 |
| 10:16:38 | SELL | CALL | 2026-12-18 | $68 | $3.88 | 30,000 | 30,000 | 17,098 | $65.60 | $11,640,000 | EEM20261218C68 |
| 10:17:37 | SELL | CALL | 2026-12-18 | $68 | $3.88 | 5,000 | 35,000 | 17,098 | $65.57 | $1,940,000 | EEM20261218C68 |
| 10:18:30 | SELL | CALL | 2026-12-18 | $68 | $3.88 | 15,000 | 50,000 | 17,098 | $65.54 | $5,820,000 | EEM20261218C68 |
| 10:44:36 | SELL | CALL | 2027-01-15 | $70 | $3.55 | 5,000 | 5,000 | 41,223 | $65.51 | $1,775,000 | EEM20270115C70 |
| 10:44:36 | BUY | PUT | 2027-01-15 | $65 | $4.75 | 5,000 | 5,100 | 28,481 | $65.51 | $2,375,000 | EEM20270115P65 |
| 10:45:05 | SELL | CALL | 2026-12-18 | $68 | $3.88 | 7,500 | 58,000 | 17,098 | $65.54 | $2,910,000 | EEM20261218C68 |
| 10:45:19 | SELL | CALL | 2026-12-18 | $68 | $3.88 | 5,000 | 63,000 | 17,098 | $65.55 | $1,940,000 | EEM20261218C68 |
Net across all eight legs: $25,089,360 CREDIT. (Credits from the six SELL legs: $1,439,360 + $11,640,000 + $1,940,000 + $5,820,000 + $2,910,000 + $1,940,000 + $1,775,000 = $27,464,360; minus the $2,375,000 debit on the bought put = $25,089,360.)
The five $68-call prints worked at the same $3.88 price across roughly 29 minutes — the mark of a single order being worked through the book by a desk, not five unrelated traders happening to hit the same strike.
🔗 The Equity Tape Is the Real Story — Every Clip Was Delta-Hedged
This is the evidence that flips the read from "someone is bearish on EM" to "someone is selling volatility, hedged." Each of the five $68-call prints has a matching EEM stock block trading within the same second, and the size-to-delta match is remarkably tight (computed at a delta of ≈0.4866 per contract):
| Option print | Contracts sold | Delta-implied shares | Matching stock block | Match |
|---|---|---|---|---|
| 10:16:38 | 30,000 | 1,459,800 | 1,440,000 shares @ $65.40 | 1.4% |
| 10:17:37 | 5,000 | 243,250 | 240,000 shares @ $65.40 | 1.3% |
| 10:18:30 | 15,000 | 729,900 | 720,000 shares @ $65.40 | 1.4% |
| 10:45:05 | 7,500 | 364,950 | 360,000 shares @ $65.40 | 1.4% |
| 10:45:19 | 5,000 | 243,300 | 240,000 shares @ $65.40 | 1.4% |
| Total | 62,500 | 3,041,200 | 3,000,000 shares | 1.4% |
Five clips, five matches, all within 1.4% of the theoretical hedge ratio. That's not a coincidence — that's a desk buying just enough stock to offset the delta of the calls it's selling, in real time, as it sells them.
The 4,498-lot Dec $70 call and the Jan-2027 risk reversal did NOT show this same clean stock-block match (no confirmed paired equity block was found for either), so they carry more directional residual risk than the hedged $68C package — though the notes show the whole package's leftover delta is still only about −650,000 shares, a modest tilt, not a real bearish position.
✅ RESOLVED — The Next-Day OI Snapshot Is In: All Four Legs Opened
Updated 2026-08-05 pre-market. The ≈06:30 ET OPRA open-interest snapshot (which reflects the August 4 close) has published. Every leg that was ⏳ provisional yesterday is now settled — and all four resolved the same way: opening.
| Leg | Baseline OI (Aug-4 snap) | Resolving OI (Aug-5 snap) | Δ | Print size | Δ as % of print | Verdict |
|---|---|---|---|---|---|---|
| Dec-18-2026 $68 C (sold) | 17,098 | 79,844 | +62,746 | 62,500 | ≈100.4% | ✅ OPEN (STO) — as published |
| Dec-18-2026 $70 C (sold) | 63,014 | 68,765 | +5,751 | 4,498 | ≈127.9% | ✅ OPEN (STO) — was ⏳ provisional |
| Jan-15-2027 $70 C (sold) | 41,223 | 45,071 | +3,848 | 5,000 | ≈77.0% | ✅ OPEN (STO) — was ⏳ provisional |
| Jan-15-2027 $65 P (bought) | 28,481 | 32,274 | +3,793 | 5,000 | ≈75.9% | ✅ OPEN (BTO) — was ⏳ provisional |
What this settles. The big $68 overwrite landed within 0.4% of a perfect one-for-one open — 62,746 new contracts against a 62,500-contract print. The $70 call, which yesterday could have been a fresh short or a partial close, gained more open interest than the print itself (other sellers joined at the same strike), so it is unambiguously new short call inventory, not an unwind.
The two Jan-2027 risk-reversal legs both opened, but only about three quarters of each print created new contracts (≈77% on the call, ≈76% on the put). The remaining ≈23% changed hands with existing holders rather than creating fresh open interest — worth naming plainly: the risk reversal is a genuine new position, just modestly smaller in net-new terms than the headline 5,000-lot suggests.
Nothing inverted. The article's read — a delta-hedged call-overwrite program plus a smaller directional risk reversal, all opening — held on every leg.
🤓 What This Actually Means — Plain English
STO (Sell-to-Open) is what this mostly is — the desk is collecting cash premium up front in exchange for taking on an obligation (to sell EEM at $68 if it's called away before December 2026). Selling a call for cash is the opposite of buying one to bet on a stock going up — it's a bet that EEM either doesn't rally much past $68, or that whatever premium was collected is worth more than giving up the upside.
Here's the twist that makes this NOT a normal covered call. A textbook covered call sells 1 contract against 100 shares you already own. This desk didn't buy 100 shares per contract — they bought about 48 shares per contract (the option's delta, ≈0.4866, times 100). That's a delta hedge, not a full covered write. Delta-hedging means: instead of fully owning the stock underneath the calls, you own just enough of it that a small move in EEM's price barely changes what you're worth, because the loss (or gain) on the stock roughly offsets the gain (or loss) on the short calls. As EEM moves and time passes, that hedge ratio drifts, and a desk running this kind of trade typically re-adjusts it — buying or selling more shares to stay close to neutral. This is a volatility-selling trade, not a directional stock trade, and not a simple buy-and-hold overwrite either.
The Jan-2027 risk reversal is a different animal. Selling the $70 call and buying the $65 put with the same expiration is a structure that profits if EEM falls, loses a small fixed amount ($1.20/share, or $600,000 total across 5,000 contracts) if EEM sits between $65 and $70 at expiration, and loses more the higher EEM goes above $70 with the short call now uncovered. On its own, this leg reads mildly bearish/defensive — but it's a fraction of the size of the hedged $68C package (5,000 contracts vs. 62,500), and both legs printed as a stock-plus-options cross, meaning an equity component was very likely bundled into the same execution even though we can't independently verify its exact size the way we could for the $68C clips.
Bottom line on intent: this reads as a desk monetizing rich option premium in EEM — collecting cash for calls while staying close to delta-neutral with stock — layered with a smaller, more directional hedge/bet via the risk reversal. It is not "smart money betting against emerging markets," and any headline that frames $25M of call-selling as bearish is missing the equity tape.
📈 Technical Setup / Chart Check-Up
YTD Chart
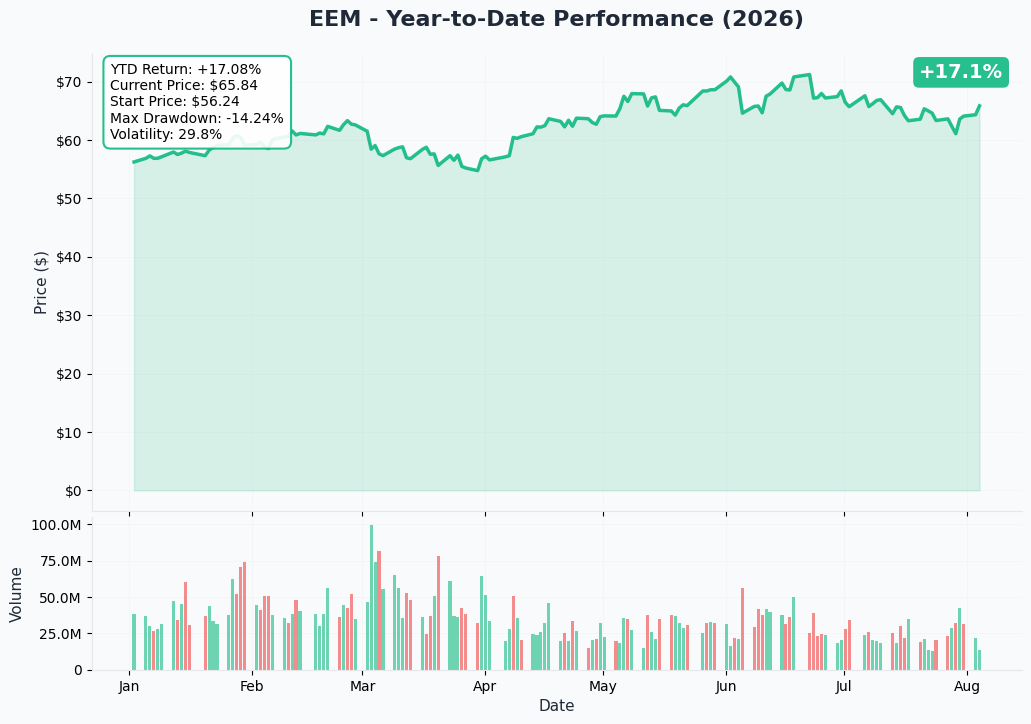
The 1-year chart shows EEM +17.1% over the trailing year, consistent with the broader rally the catalyst research also documents (+20.27% YTD, +35.11% over one year, per StockAnalysis and Finviz — small differences reflect different snapshot dates and total-return-vs-price-return methodology).
Gamma-Based Support & Resistance
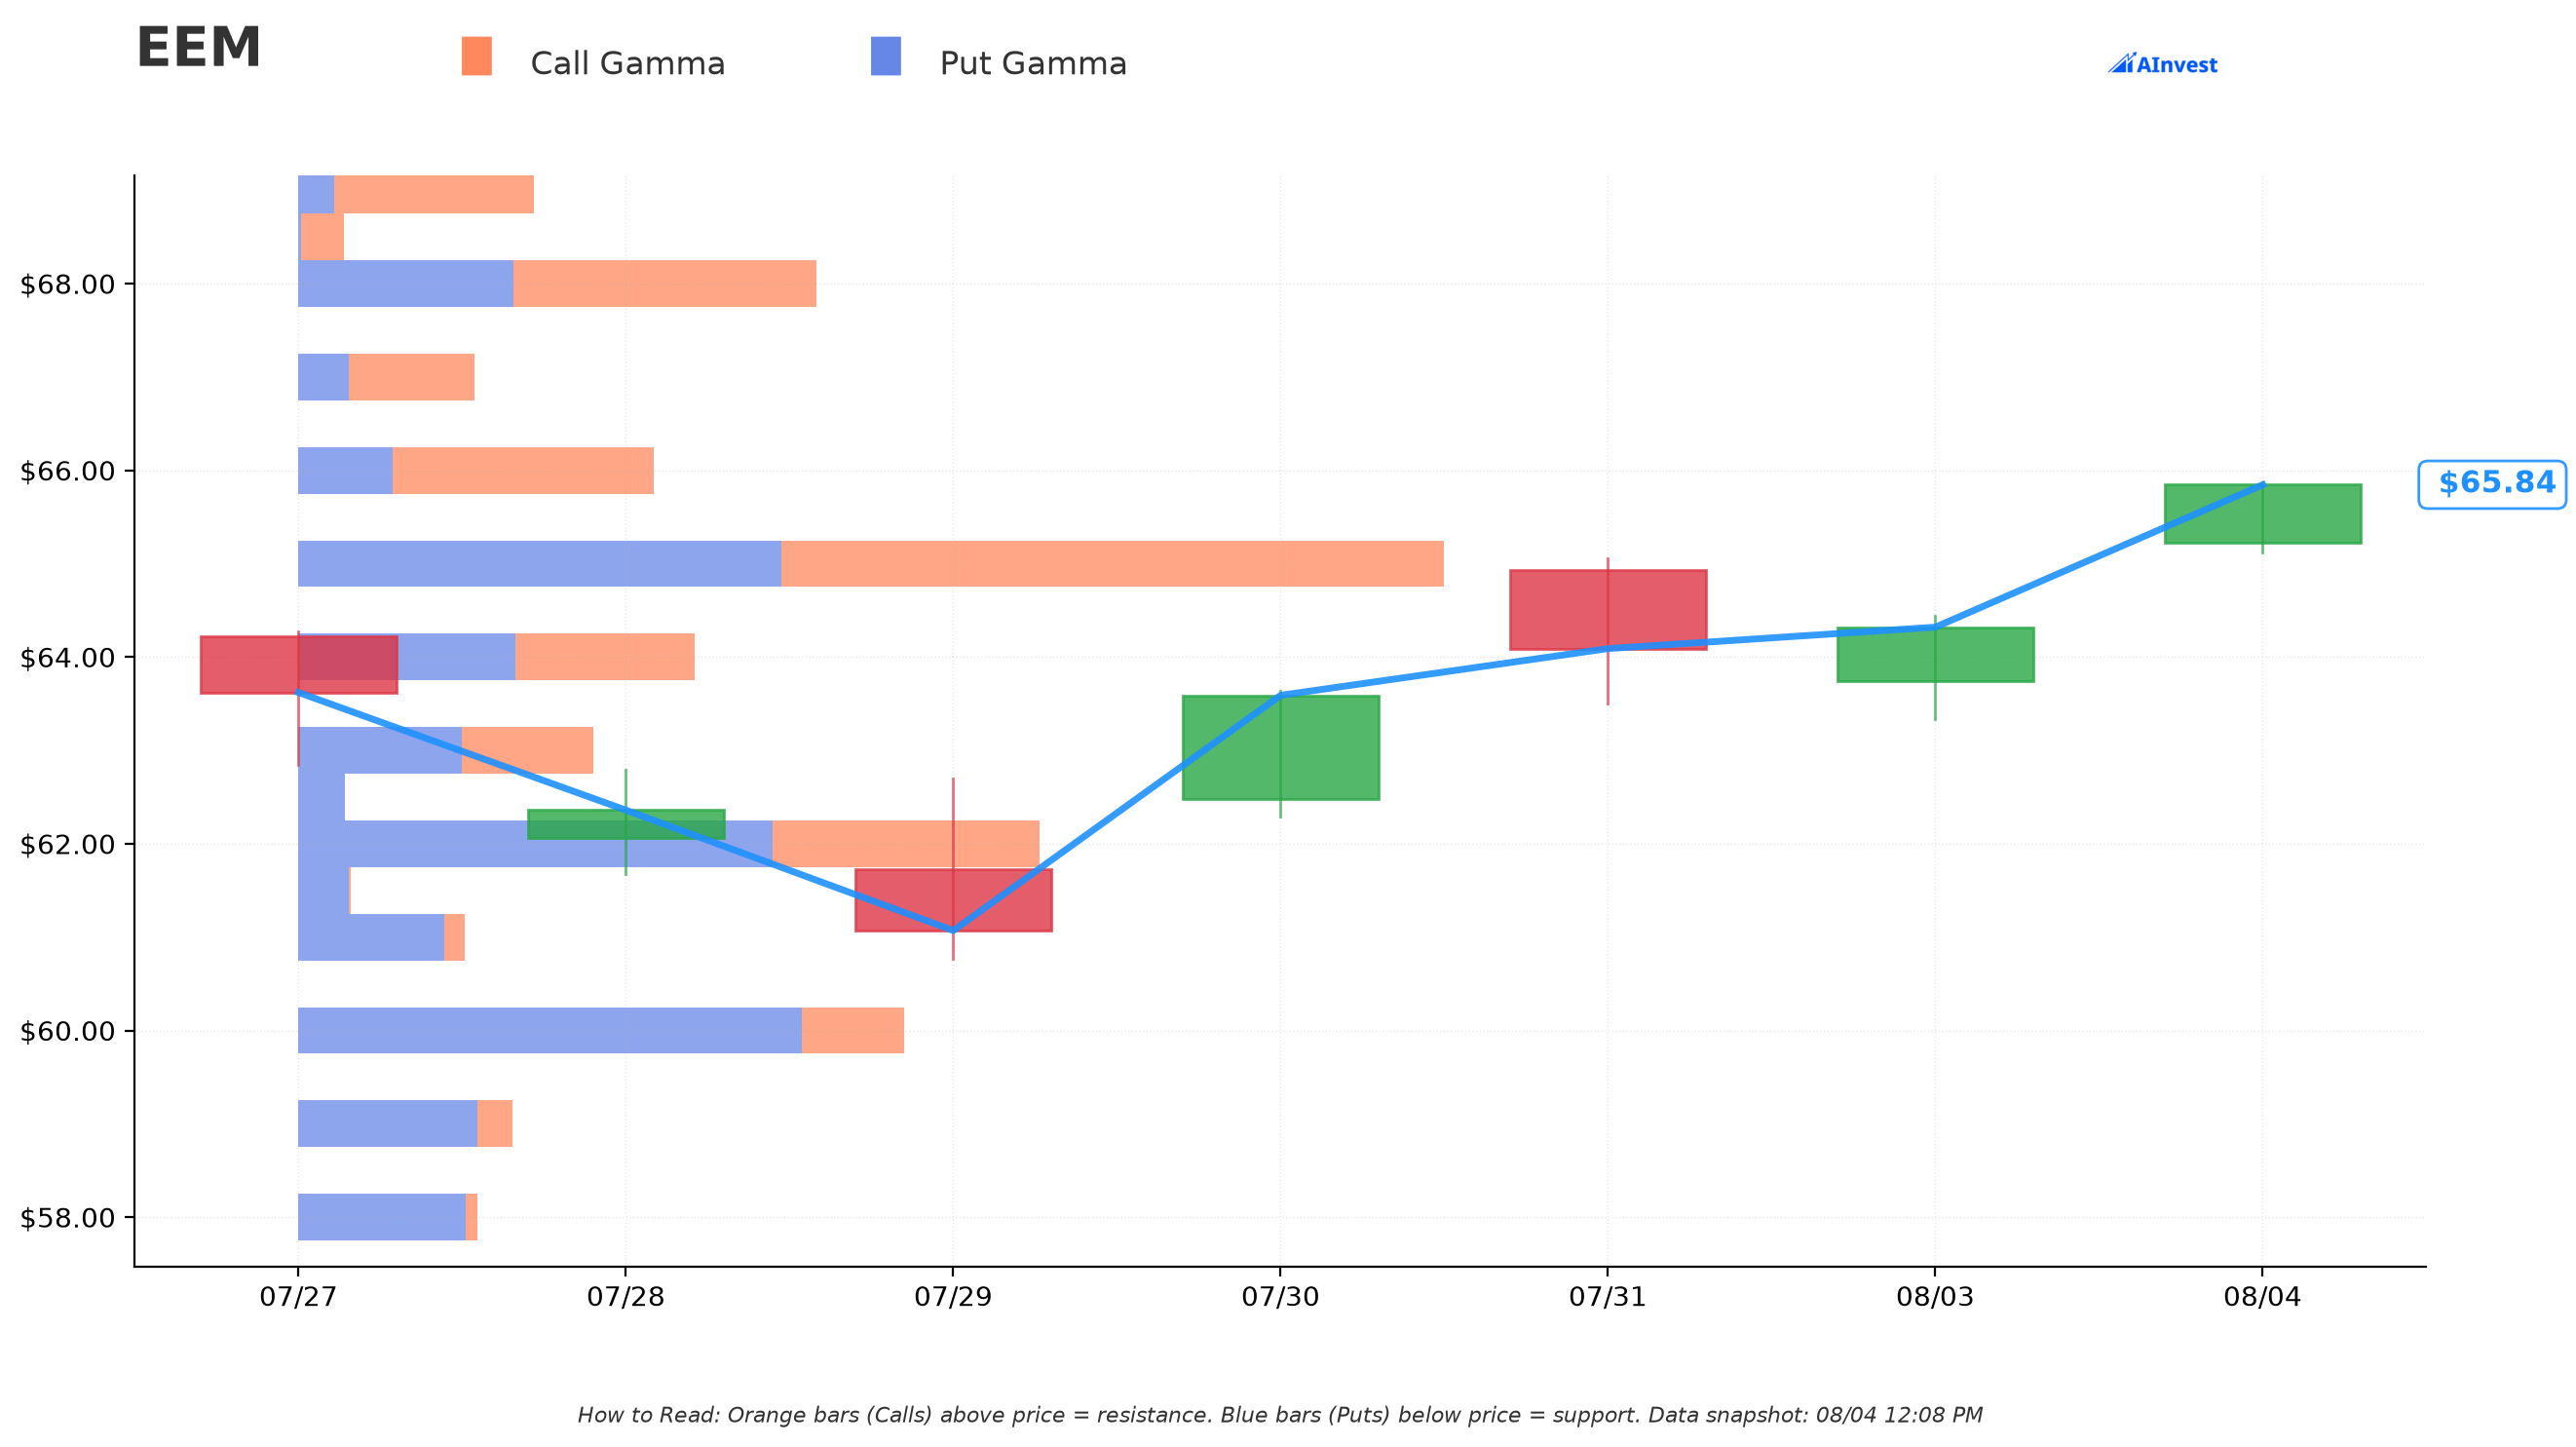
Reading gex.json with spot at $65.84:
- 🔵 Support wall at $65 — "Very Strong," only 1.28% below spot, the single largest gamma concentration on the board (total gamma exposure ≈113.4). This is the nearest hard floor from dealer hedging.
- 🟠 Resistance wall at $70 — "Very Strong," 6.32% above spot (total gamma exposure ≈73.9, almost all of it call gamma). Notably, $70 is exactly one of the strikes this desk just sold calls at (both the Dec-18 and Jan-2027 legs) — they're writing calls right into the fund's strongest overhead gamma resistance.
- 🟠 A secondary resistance wall sits at $68 (total gamma ≈51.3, 3.28% above spot) — again, exactly the strike carrying the bulk of today's flow (62,500 contracts).
- Additional support layers stack up at $64, $62 and $60 (all "Support Wall" tagged), giving the setup a step-ladder floor beneath current price.
In plain terms: dealers who are short these calls have to buy stock as EEM rises toward $68–$70 and sell it as EEM falls — that hedging flow tends to slow moves down near those strikes, which is exactly where today's sold calls sit.
Implied Move
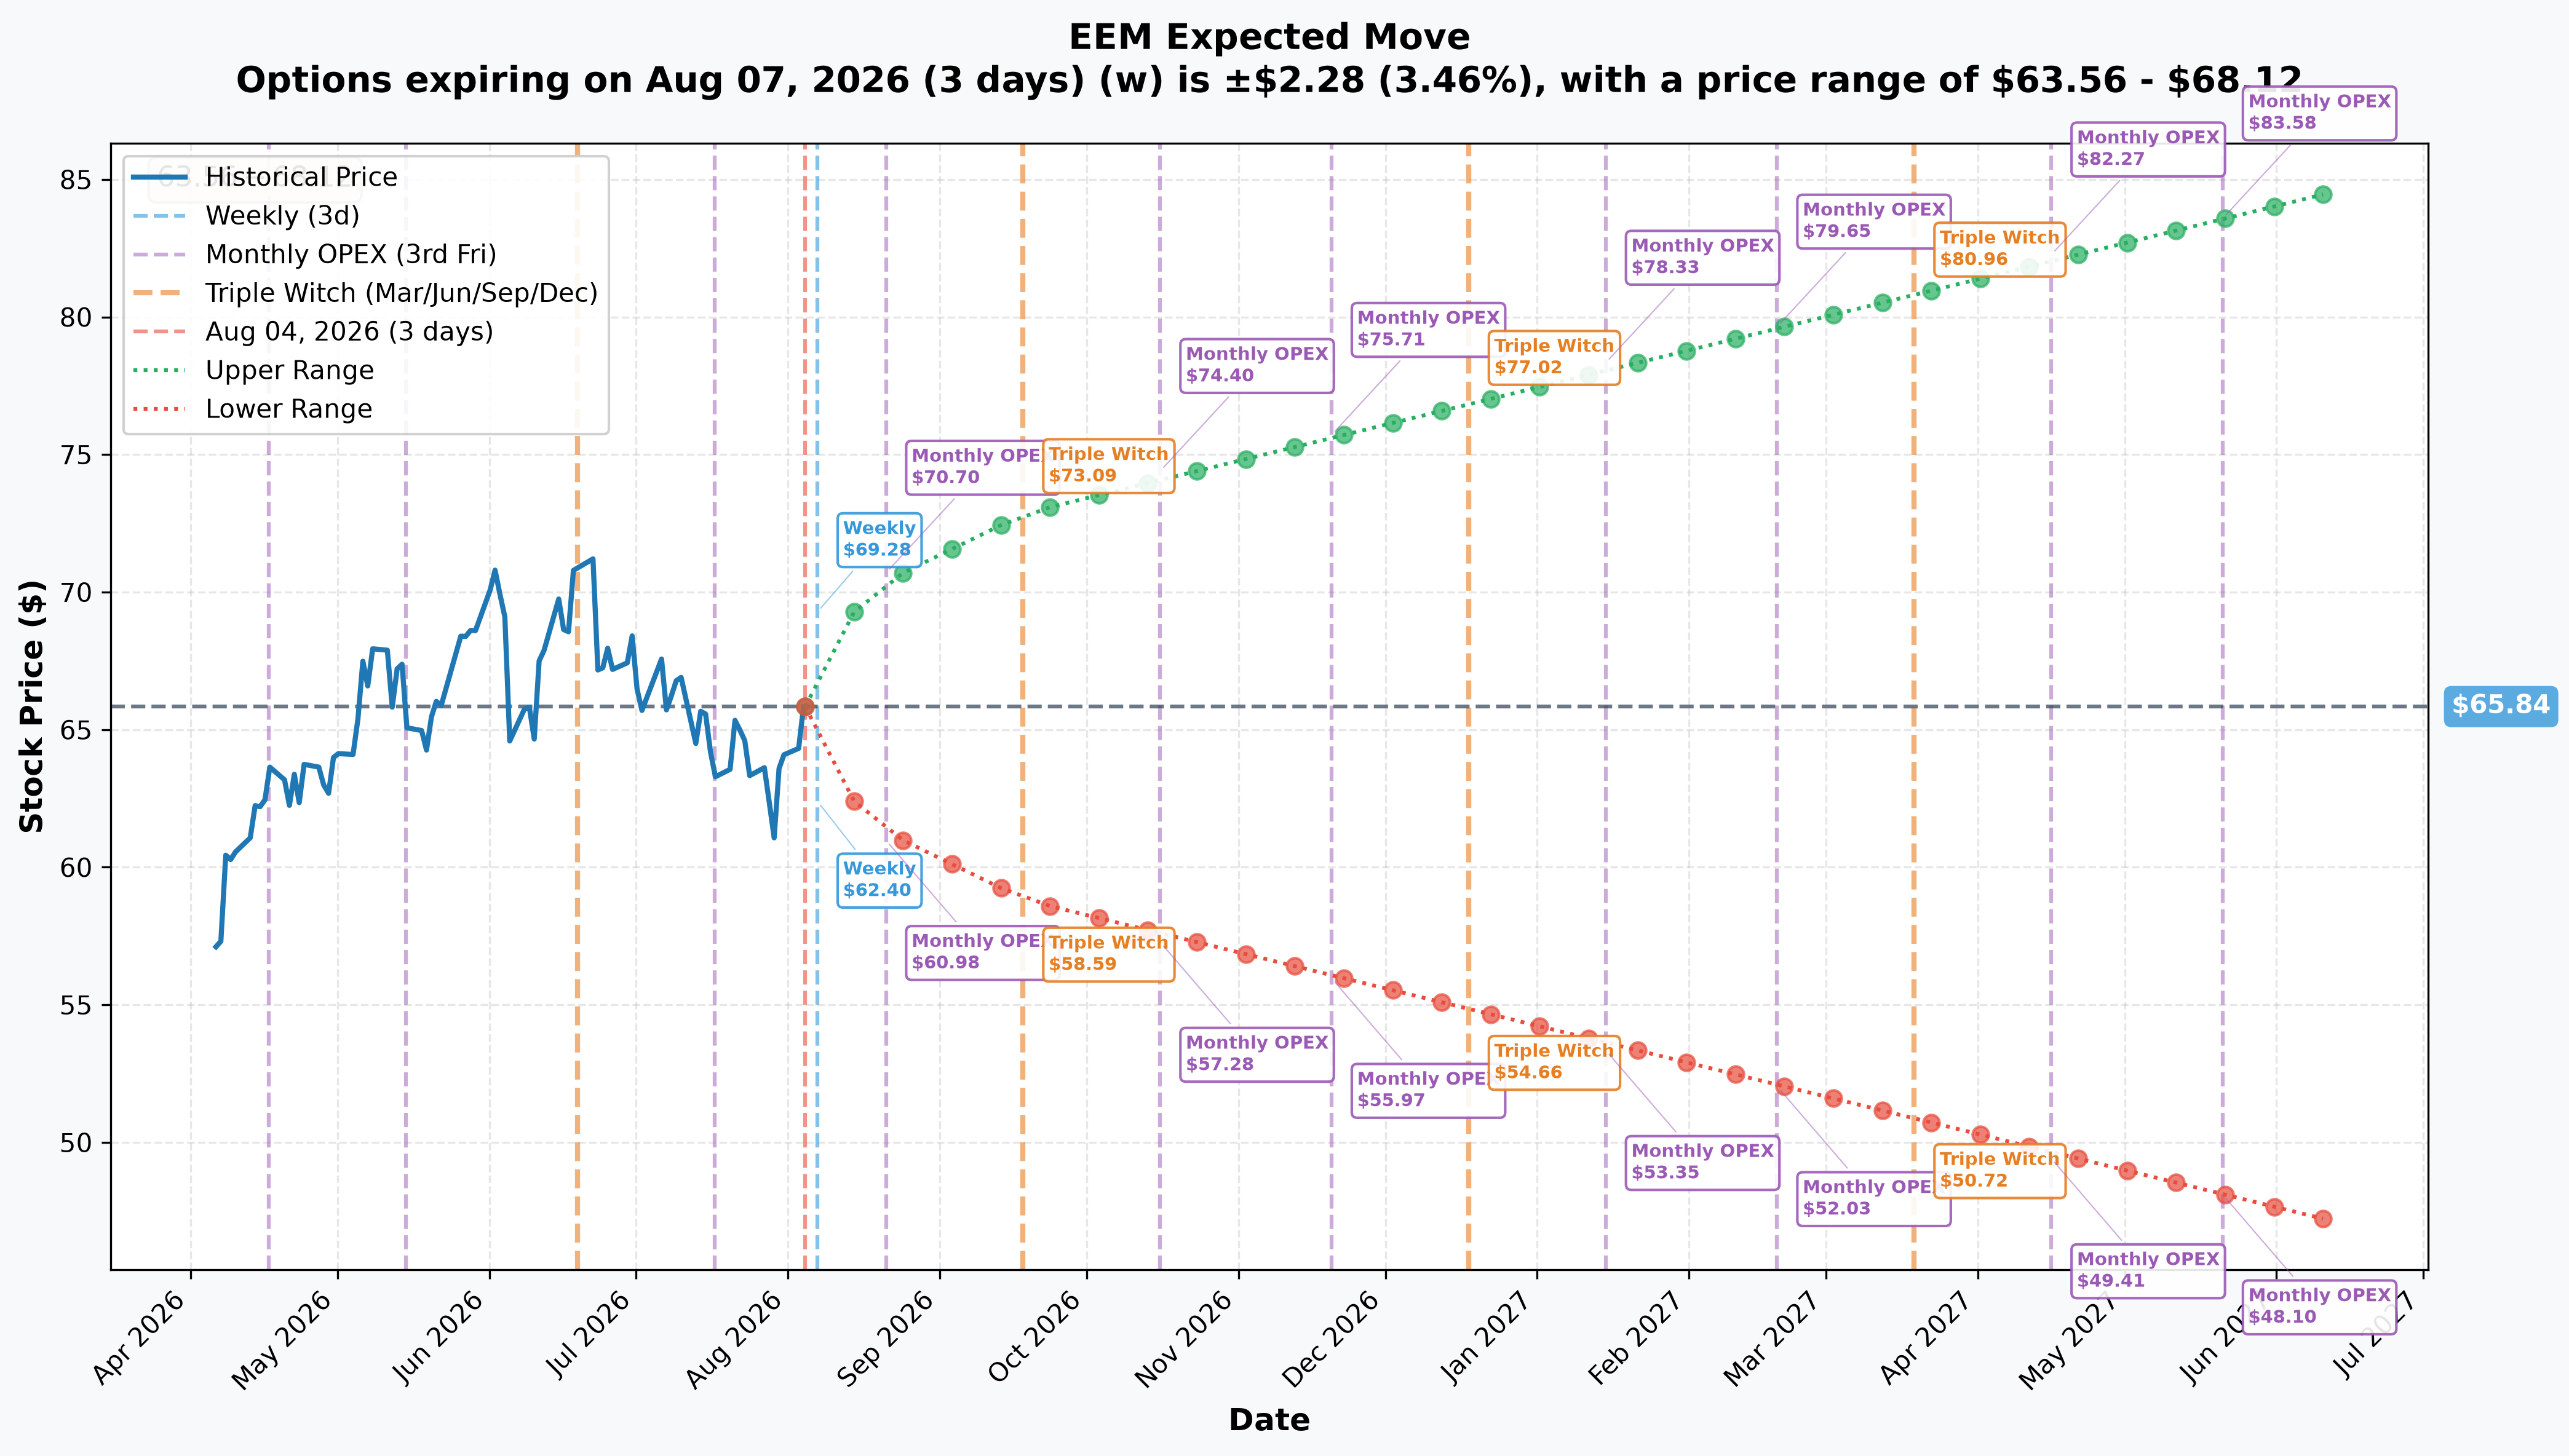
From EEM_implied_move.json (spot $65.84):
| Expiry | DTE | Implied Move | Range |
|---|---|---|---|
| Weekly (Aug 7, 2026) | 3 | ±3.46% ($2.28) | $63.56 – $68.12 |
| Monthly OPEX (Aug 21, 2026) | 17 | ±6.99% ($4.60) | $61.24 – $70.44 |
| Quarterly / Triple Witch (Sep 18, 2026) | 45 | ±10.67% ($7.03) | $58.81 – $72.87 |
| Yearly LEAPS (Jun 17, 2027) | 317 | ±28.73% ($18.92) | $46.92 – $84.76 |
The Dec-18-2026 and Jan-15-2027 strikes traded today sit between the quarterly and yearly readings. By the quarterly (Sep 18) window alone, the market is already pricing an upper bound of $72.87 — above both the $68 and $70 strikes the desk sold calls at. That's the honest read on how much room the market itself thinks EEM has to run before December: plenty, if the semiconductor rally continues.
🎪 Catalysts
Important framing: EEM has no earnings date of its own. Everything below is macro — Fed policy, China policy, currency, and the underlying semiconductor cycle in Taiwan and Korea.
Already Happened
- July 29, 2026 — the Fed held rates at 3½–3¾%, on a 9–3 vote, with three members (Hammack, Kashkari, Logan) dissenting in favor of a 25bp hike (Federal Reserve). This was a hawkish hold, not a cutting cycle — do not confuse it with easing.
- July 30, 2026 — China's Politburo pledged increased macro policy support and set October 2026 for the fifth plenum of the Central Committee (SCMP).
- July 31, 2026 — China's manufacturing PMI unexpectedly contracted to 49.2, a day after the stimulus pledge — the timing makes the pledge look reactive rather than pre-emptive (SCMP).
- July 31, 2026 — the offshore yuan hit a 3-year high on Beijing's policy-support signal (SCMP).
Upcoming
- August 12, 2026 — US July CPI (Federal Reserve calendar context via Kitco). This is the key input into September hike odds, and therefore the dollar — the single biggest lever on EEM's dollar-denominated returns.
- September 15–16, 2026 — FOMC with a Summary of Economic Projections and dot plot (Federal Reserve FOMC calendar). Markets currently price ≈60% odds of a 25bp hike, per Kitco — a genuine coin-flip event, and a hike is the clearest bearish catalyst for EM in the entire window.
- October 2026 — China's fifth plenum of the Central Committee (SCMP), setting the policy frame ahead of next year's party congress.
- October 27–28, 2026 — FOMC (no dot plot) (Federal Reserve calendar).
- December 8–9, 2026 — FOMC with a dot plot, setting the 2027 dollar/rate path (Federal Reserve calendar) — this lands right around the Dec-18 expiration on today's largest leg.
The Flow Nobody's Talking About
Foreign portfolio money has been leaving emerging markets for at least two straight months even as the index rallies. June 2026 saw −$17.8 billion in nonresident portfolio outflows, following −$25.2 billion in May — a sharp reversal from June 2025's +$51.1 billion inflow (IIF Capital Flows Tracker). This year's EM rally is being driven by domestic buyers and earnings re-rating (chip-cycle cash flow), not foreign inflows — which means there's no crowded foreign long to squeeze higher, but also no flow cushion if sentiment turns.
🎲 What The Levels Are Saying
Putting the gamma walls and implied move together with the catalyst calendar:
- Base case: EEM gravitates toward the $65 gamma support / current spot zone through the next couple of weeks, with the $68 wall capping quick upside attempts — consistent with dealers hedging into both the weekly ($63.56–$68.12) and monthly OPEX ($61.24–$70.44) implied-move ranges.
- Bull case: a clean break above $68–$70 — the exact strikes sold today — would need the semiconductor cycle (TSMC/Samsung/SK hynix earnings) to keep running and a Fed hold or dovish surprise at the September dot plot. The quarterly implied-move upper bound ($72.87) already prices real odds of that by mid-September.
- Bear case: a September hike, a soft China plenum, or a memory-cycle rollover (Chinese CXMT chips are already displacing Samsung/SK hynix at HP, Asus and Acer) pushes EEM back toward the $60–$62 support shelf, and eventually the $58.81 quarterly-move floor.
💡 Trading Ideas
🛡️ Conservative
Watch, don't chase. This flow is not a directional signal — it's a desk running a hedged premium trade. The one thing worth noting for a conservative account already holding EEM: the $68 and $70 strikes are legitimate resistance (gamma walls + where this flow is now short), so covered-call writers could look at similar strikes for their own December income trades, understanding they'd be capping upside there too.
⚖️ Balanced
The $65 gamma support (1.28% below spot, "Very Strong") is a reasonable line to define risk against for a swing long, with the $68 wall as a realistic near-term target rather than a stop-loss level. A defined-risk call spread (e.g., buying below $68 and selling near $70–72) respects both the technical setup and the fact that today's flow is fading the exact same strikes.
🚀 Aggressive
If you have a genuine view that the September FOMC surprises dovish and the chip cycle holds, the market is pricing meaningful room to $72.87 by the September quarterly expiry per the implied-move data — but recognize you'd be running directly against a desk that just sold calls at $68/$70 and is likely to keep supplying paper into strength given the delta-hedging behavior observed today.
⚠️ Risk Factors
- This is a semiconductor fund with an EM label. A memory-cycle rollover takes EEM down regardless of what the rest of the emerging-markets universe does — 45.26% of the index is Information Technology, and TSMC + Samsung + SK hynix alone are ≈30.9%.
- A Fed hike is close to a coin flip and it's the wrong side for EM. ≈60% September hike odds into a fund that's rallied largely without foreign inflow support.
- Foreign flows are already negative during the rally — two straight months of outflows. There's no flow cushion if sentiment sours.
- Chinese memory competitors are already displacing Samsung and SK hynix at major PC makers — a live, ongoing threat to roughly 13.7% of the fund.
- Taiwan Strait tail risk sits on 27.34% of NAV, and it isn't diversifiable within this fund.
🔍 Honest Risk & Limits — What the Tape Cannot Prove
- The tape and the equity-block match are strong evidence of a delta-hedged premium sale, but we cannot see the broker, the market-maker ID, or the actual trader's stated intent. "Looks delta-hedged" is an inference from size and timing, not a disclosed motive.
- We cannot confirm the Dec-18 $70C or either leg of the Jan-2027 risk reversal opened new positions — size sits below prior open interest on all three, so tomorrow's OI print is the only real test.
- We do not know whether this hedge will be actively maintained (re-balanced as EEM's price moves) or was a one-time static trade — that materially changes the ongoing risk profile of the position from here.
- The risk reversal's stock-plus-options cross mechanism strongly suggests a bundled equity leg exists, but we cannot independently verify its size the way we could for the $68C clips, so its true net delta is uncertain.
- None of this tells us the position's exit plan or target price — only what was put on today.
Options trading involves substantial risk and may not be suitable for all investors. This analysis describes observed order flow and is not a recommendation to buy or sell any security. Size positions responsibly.
Last updated: 2026-08-05 — next-day OPRA open-interest resolution added: all four legs confirmed OPEN (two Jan-2027 legs ≈76% net-new).