📅 EQIX $1,000 Put Calendar — ≈$8.6M Net Credit Bet on a Post-Earnings Drift, Not a Crash
📅 July 30, 2026 | 🔀 Unusual Multi-Leg Activity Detected
✅ UPDATE — July 31, 2026 pre-market: both legs confirmed OPENING. The November $1,000 put went 1 → 2,501 (+2,500, an exact match) and the ambiguous August $1,000 put went 3,181 → 6,022 (+2,841 against a 3,000-lot print). The close/roll scenario on the near leg is ruled out — this calendar was built, not adjusted. See the ✅ RESOLVED box below.
🎯 The Quick Take
The morning after Equinix beat Q2 earnings but spooked the Street with a soft Q3 guide (stock down ≈3.5%), someone ran a $1,000-strike put calendar through a multi-leg auction: sold 2,500 Nov-20 $1,000 puts for $53.95 while buying 3,000 Aug-21 $1,000 puts for $16.20, taking in roughly $8.6M net credit upfront. This is NOT a crash bet — the near-dated leg doesn't even span EQIX's next earnings report, so it reads as tactical drift/term-structure positioning around the round $1,000 level, leaning neutral-to-mildly-bullish (net short puts) rather than aggressively bearish.
📊 Company Overview
Equinix (NASDAQ: EQIX) is the world's largest digital-infrastructure REIT — colocation, interconnection, and xScale hyperscale data centers across 270+ facilities in 36 countries and 77 metros:
- 🏢 Sector: Real Estate — Specialized REITs (data centers), and a core AI-infrastructure supply-chain name
- 💰 Market Cap: ≈$102B
- 🤖 AI positioning: Hosts 8 of the top 10 AI model providers and 8 of the top 10 neo-clouds; ≈60% of large Q1 2026 contracts were AI-related
- 📈 Moat: Interconnection revenue (high-margin, sticky) plus supply-constrained metros (Frankfurt, Amsterdam) that support pricing power
- 💵 Dividend: ≈$20.64/share annually (≈1.97% yield) — a growth-REIT profile where capital appreciation, not yield, drives total return
💰 The Option Flow Breakdown
📊 What Just Happened (July 30, 2026 @ 13:07:09 ET)
Both legs printed at the same moment through a multi-leg auction (a facilitated, price-improvement worked order — not a lit sweep, not a negotiated block cross) at the identical $1,000 strike, with spot at $1,046.67:
| Time | Buy/Sell | Call/Put | Expiration | Strike | Option Price | Volume | Prior OI | Size | Premium | Spot | Option Symbol |
|---|---|---|---|---|---|---|---|---|---|---|---|
| 13:07:09 | SELL | PUT | 2026-11-20 | $1,000 | $53.95 | 2,500 | 1 | 2,500 | ≈$13.5M | $1,046.67 | EQIX20261120P1000 |
| 13:07:09 | BUY | PUT | 2026-08-21 | $1,000 | $16.20 | 3,000 | 3,200 | 3,000 | ≈$4.9M | $1,046.67 | EQIX20260821P1000 |
🔀 Flow tag: MULTI-LEG AUCTION — Put Calendar. Sell the far, buy the near, same strike. Doing the math ourselves: $13.5M collected (2,500 × $53.95 × 100) minus $4.9M paid (3,000 × $16.20 × 100) = ≈$8.6M net credit collected upfront. Note the leg sizes aren't matched 1-for-1 — 3,000 near puts against only 2,500 far puts sold means ≈500 of the near-dated puts sit outside the calendar as a standalone long put, so this isn't a textbook, fully-hedged calendar; there's a small net long-put tail below $1,000 into August.
✅ RESOLVED — Both Legs Opened. The Ambiguous Near Leg Came Back BTO.
The two legs were in very different confidence buckets: the far short was near-certain, but the near leg's size (3,000) sat below its prior open interest (3,181), so we could not prove it opened rather than partly closed a pre-existing long put. We predicted the November OI would rise to ≈2,500 and warned that if August OI "barely moves or falls, that leg was more of a close/roll than a fresh calendar buy." The July 31 pre-market OPRA snapshot resolves both — and both opened:
| Leg | Baseline OI (Jul 30 snap) | Resolving OI (Jul 31 snap) | Δ | Print size | Δ as % of print | Verdict |
|---|---|---|---|---|---|---|
| Nov-20-2026 $1,000 Put (sold) | 1 | 2,501 | +2,500 | 2,500 | 100.0% | ✅ OPEN (STO) |
| Aug-21-2026 $1,000 Put (bought) | 3,181 | 6,022 | +2,841 | 3,000 | ≈95% | ✅ OPEN (BTO) |
The far leg is a perfect match — 2,500 contracts printed, open interest rose by exactly 2,500, off a base of a single contract. Every contract sold created a new one; there is nothing to interpret.
The near leg is the one that mattered, and the close/roll scenario is dead. August open interest rose by 2,841 against a 3,000-lot print (≈95%) — it did not stay flat and it did not fall. Almost the whole print was a genuine fresh long-put purchase. The classifier's MEDIUM-confidence BTO lean was correct, and it can now be stated as fact rather than inference. The ≈5% shortfall is ordinary two-sided trading, not a meaningful partial close; the strike's entire session volume was 3,002 contracts and open interest absorbed 2,841 of them. No cancellations appeared on either leg's tape.
What this confirms: the put calendar was built, not adjusted. Both legs are new positions established on the same day, so the ≈$8.6M net credit reflects fresh risk being put on rather than an existing structure being shuffled. The size mismatch noted above still stands — 3,000 near against 2,500 far means ≈500 near-dated puts sit outside the calendar as a standalone long, and that tail is now confirmed to be newly opened too.
🤓 What This Actually Means — Plain English
A put calendar is a term-structure trade: you buy and sell puts at the same strike but different expirations, betting on how time and volatility decay differently between the two dates — not a straight-up bet that the stock crashes or rallies.
Here, the trader sold the expensive, far-dated Nov-20 put ($53.95 — it has 113 days to bake in more time value and volatility) and bought the cheaper, near-dated Aug-21 put ($16.20 — only 22 days, much less time value). Selling the pricier leg and buying the cheaper leg at the same strike is how you collect a net credit ($8.6M here) instead of paying one.
Two things make this read as tactical, not a doomsday hedge:
- The near leg does NOT span an earnings event. Equinix already reported Q2 on July 29; its next report is expected in late October — well past the Aug-21 expiration. That rules out this being a classic earnings-straddle-style structure. It's positioning for near-term technical drift, not a binary earnings gamble.
- The structure is net short volatility/downside on the far end. By selling far-dated puts (naked to the downside past Nov-20) and only owning near-dated protection through Aug-21, the trader is effectively betting Equinix drifts toward or holds the $1,000 level over the next few weeks, while being willing to be short downside risk further out — a mildly bullish-to-neutral stance, the opposite of a crash bet. Think of it less like "insurance" and more like "getting paid to bet the stock doesn't collapse through November, while keeping a small near-term hedge in case the post-earnings wobble continues into August."
📈 Technical Setup / Chart Check-Up
YTD Performance Chart
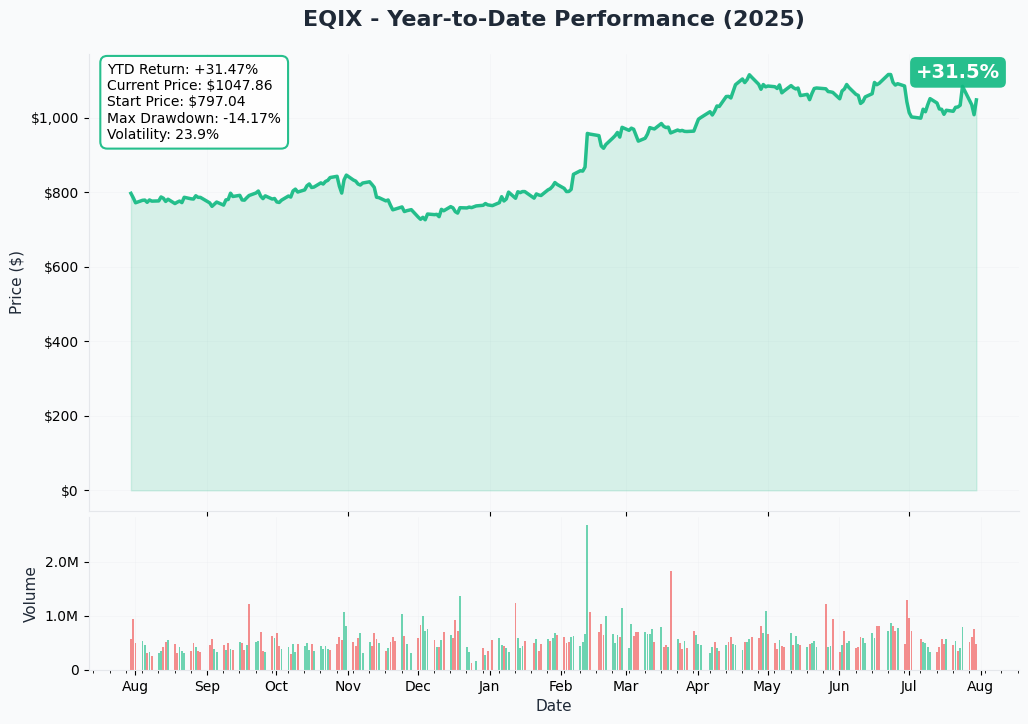
Equinix is up ≈41% YTD, rocketing from the low $700s in mid-2025 to a June 2026 high near $1,089, before the ≈3.5% post-earnings pullback brought it to today's ≈$1,047. This is a stock that's had almost no bad news all year — the Q3 guidance wobble is the first real crack in an otherwise relentless AI-infrastructure re-rating.
Gamma-Based Support & Resistance Analysis
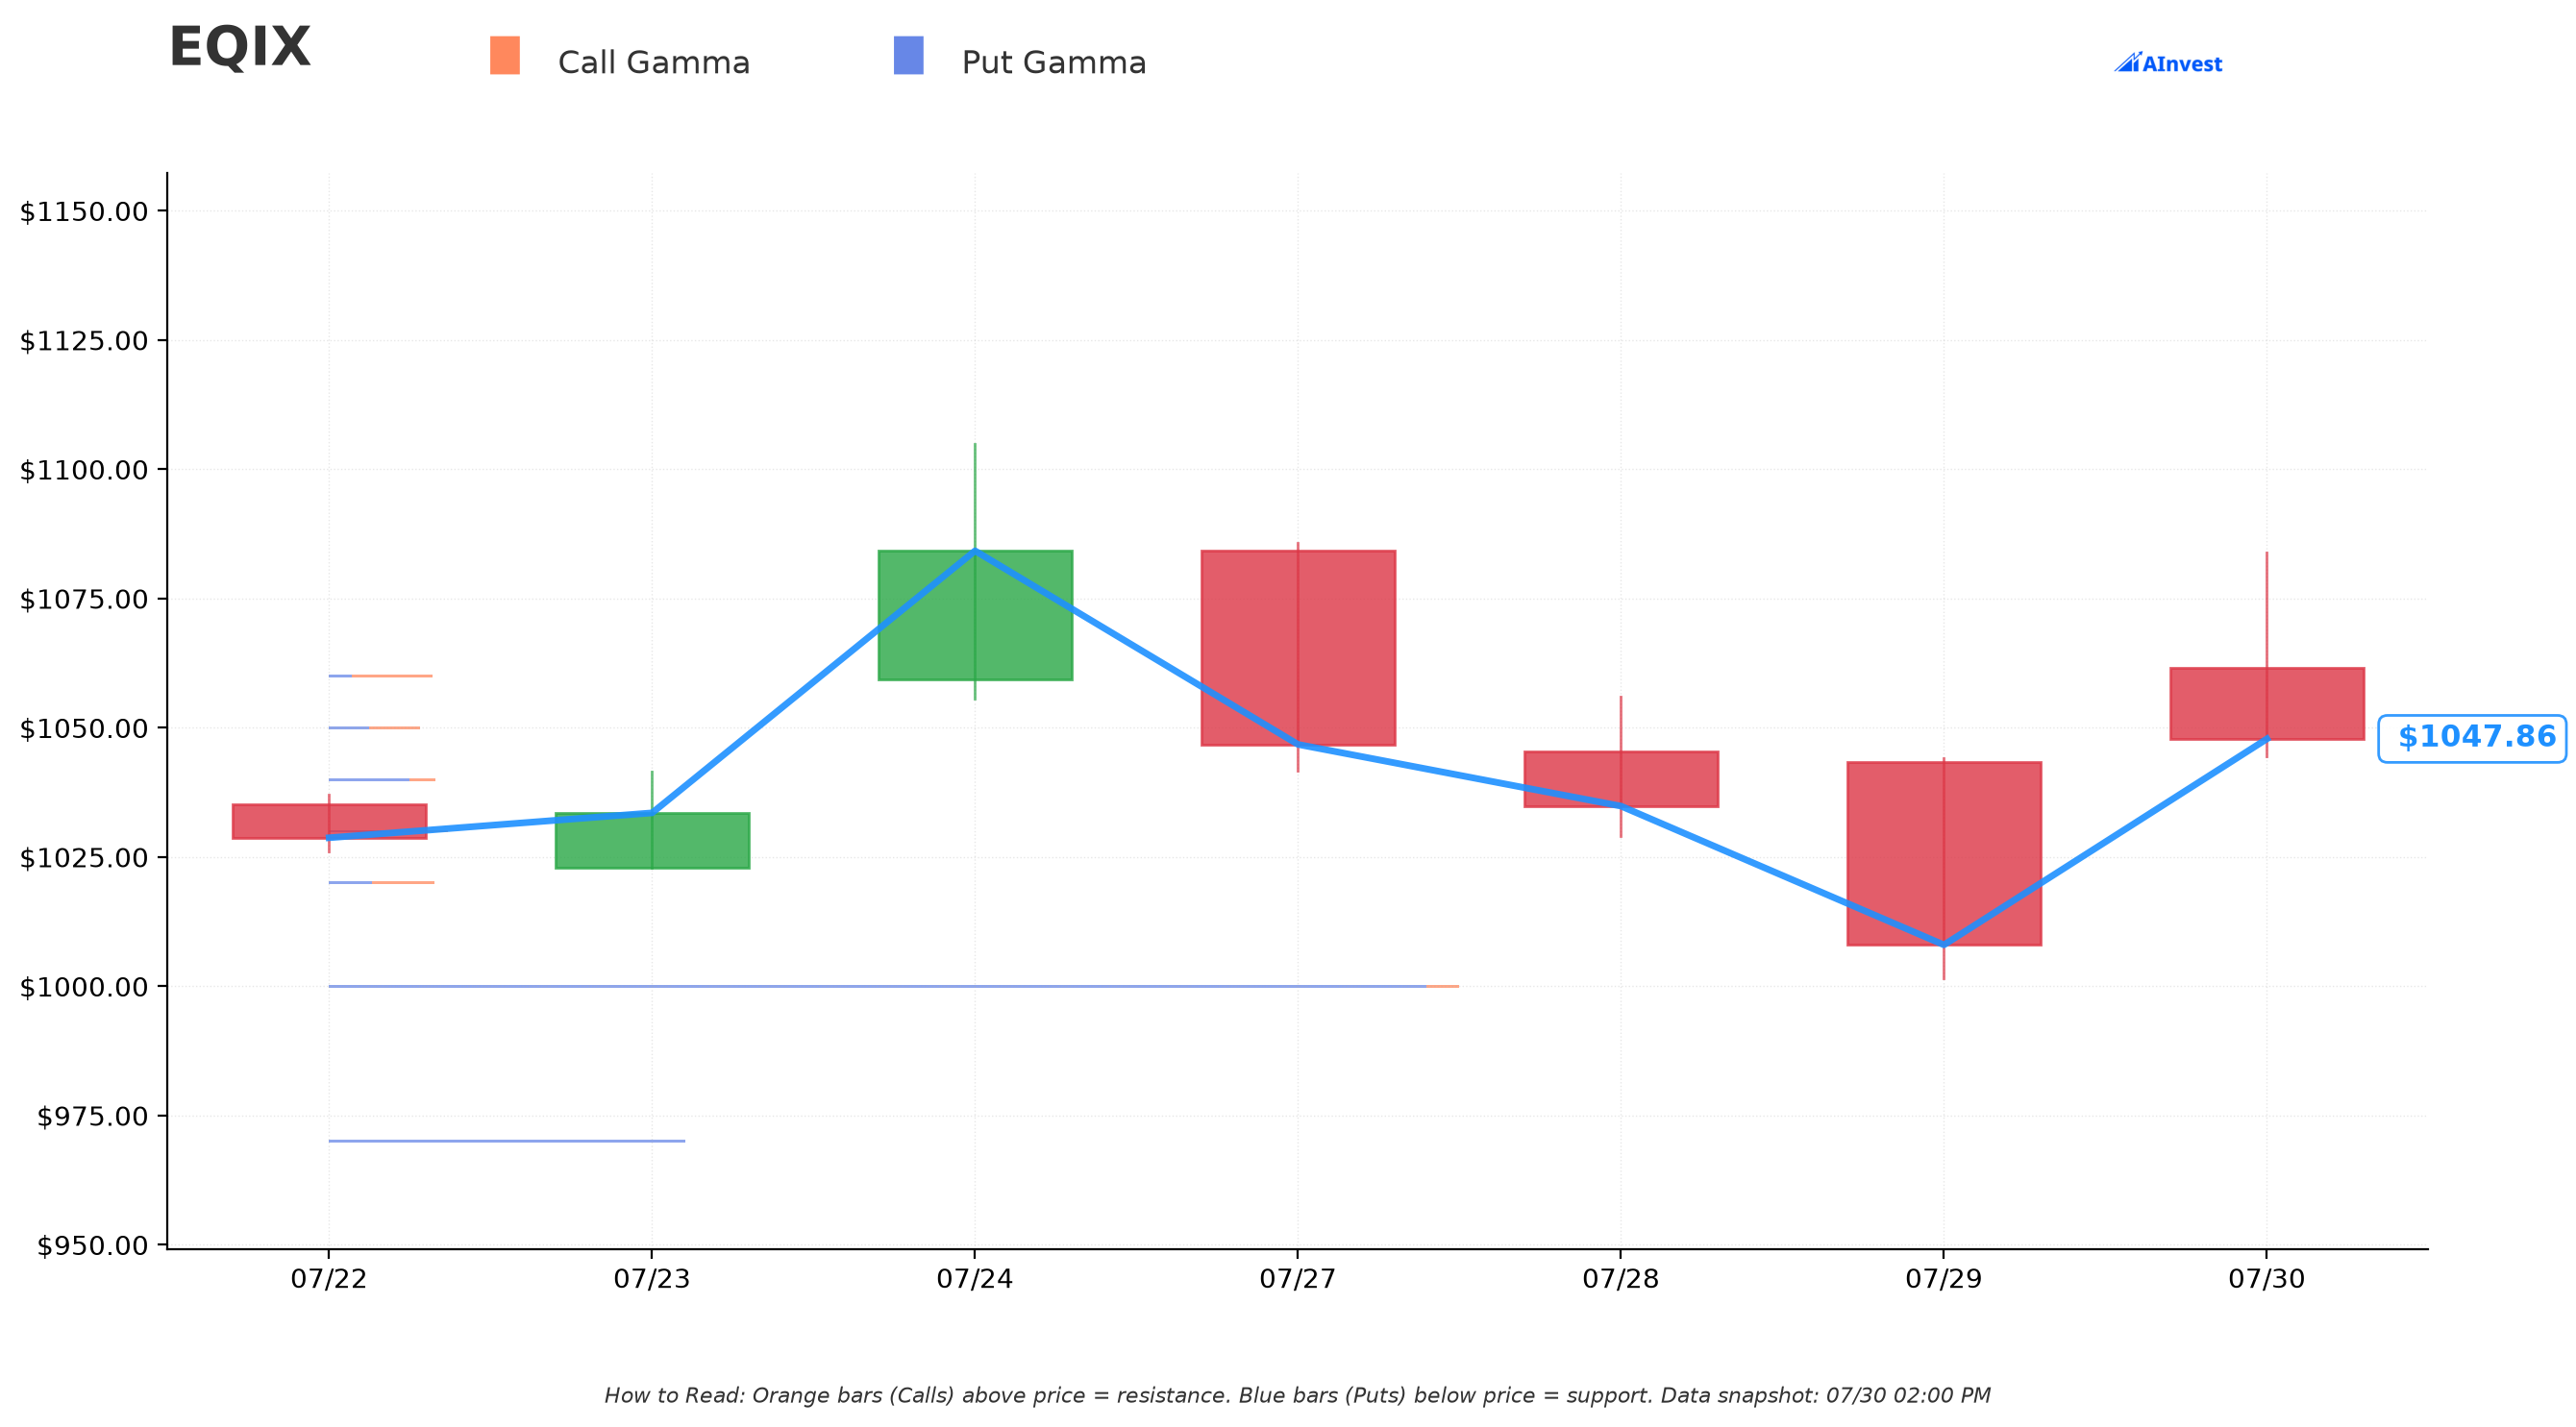
Current Price: ≈$1,047.86
Heads up: today's gamma dataset is thin (only a handful of visible strikes, no computed support/resistance zone yet), so treat this as directional color rather than a precise map — lean on the implied-move cone below for firmer targets.
That said, one thing stands out: the $1,000 strike carries the single largest total gamma concentration in the visible chain (≈1.27 total gamma units, almost entirely on the put side — net gamma ≈ −1.19). That's exactly the strike this put calendar is struck at. When dealers are heavily short gamma on the put side at a round number like $1,000, it can act as a magnet/pressure point on the way down — reinforcing why $1,000 (≈4.6% below spot) is the strike smart money picked for this structure. Smaller call-side gamma pockets sit at $1,020, $1,030, $1,050, and $1,060 — modest overhead resistance, nothing dominant.
Implied Move Analysis
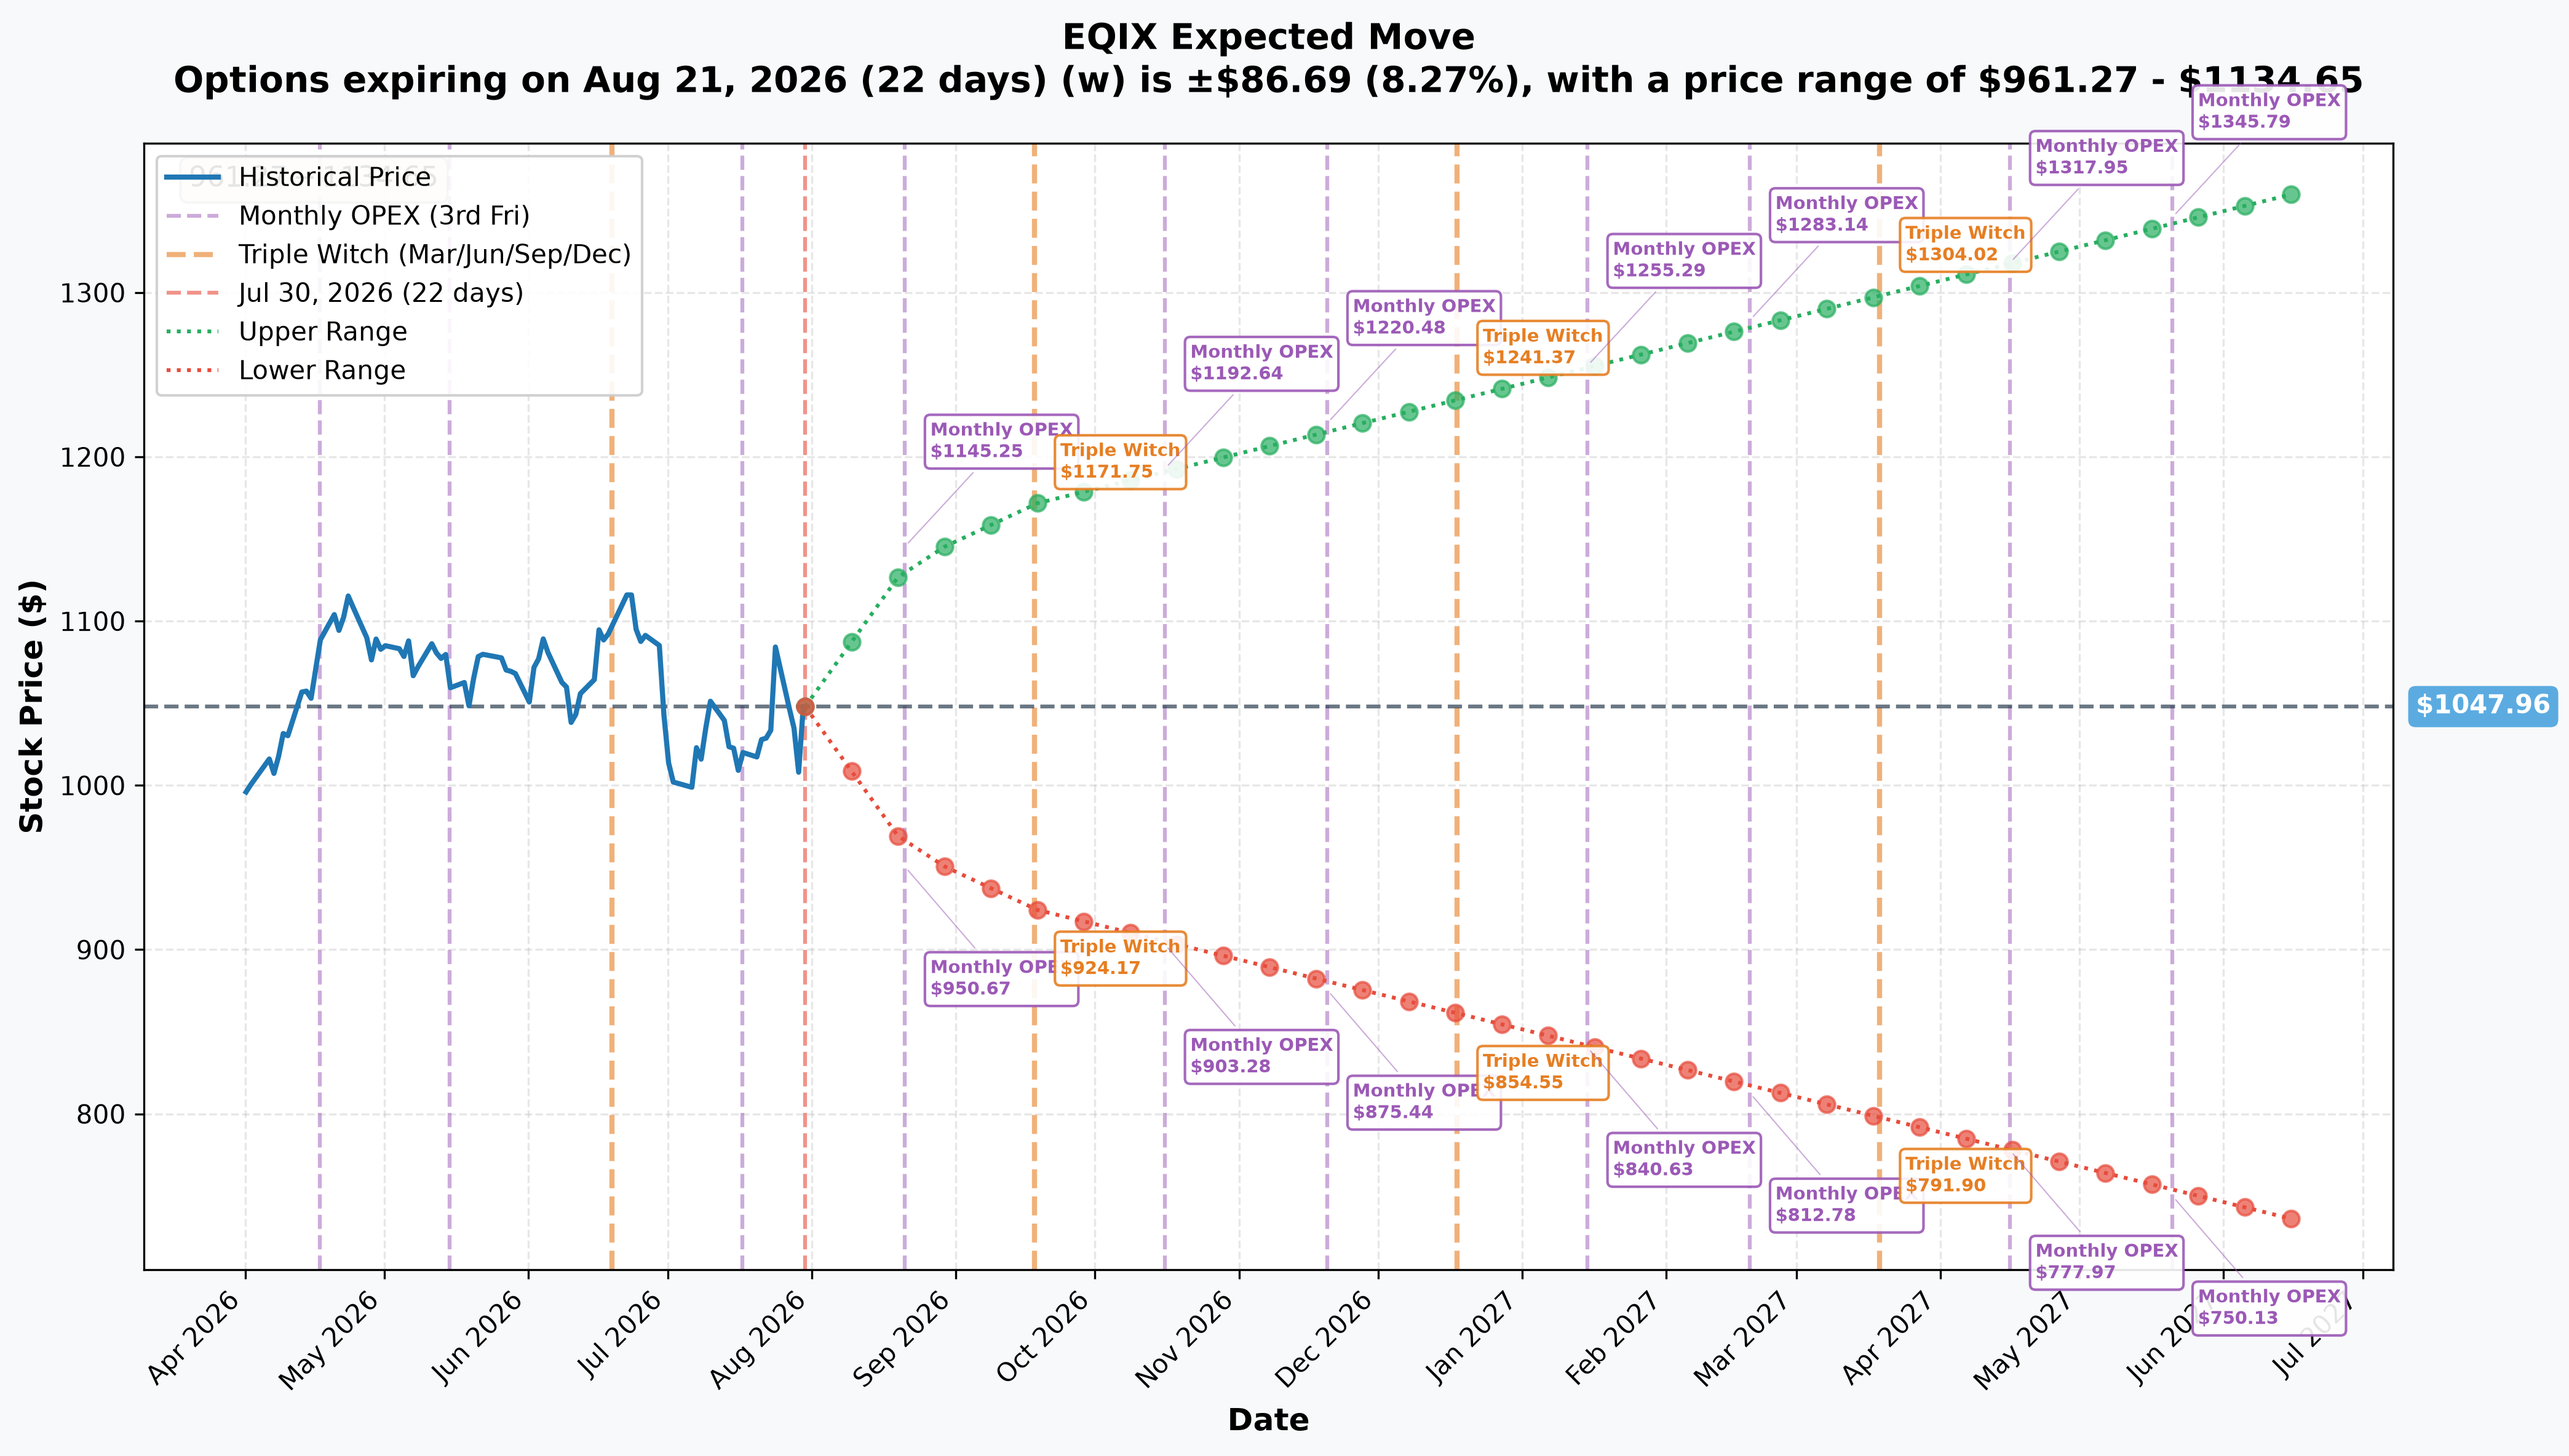
What the options market is pricing in (from spot ≈$1,047.96):
- 📅 Aug-21 (22 days — the near leg's expiration): ±8.27% (±$86.69) → range $961.27 – $1,134.65
- 📅 Sep-18 Triple Witch (50 days): ±11.81% (±$123.79) → range $924.17 – $1,171.75
- 📅 Nov-20 (the far leg's expiration): implied range roughly $875.44 – $1,220.48
- 📅 Jun-2027 LEAP horizon (322 days): ±29.88% (±$313.15) → range $734.81 – $1,361.11
Translation: the options market itself is pricing the $1,000 strike as sitting comfortably inside the expected Aug-21 range ($961–$1,135) — meaning a move down to $1,000 by August is well within normal variance, not a tail event. That's consistent with this being a term-structure/drift trade rather than a bet on something extreme.
🎪 Catalysts
✅ Just Happened
Q2 2026 Earnings — Reported July 29, 2026, After Close
Equinix delivered a genuinely strong quarter: revenue of $2.625B, +16% YoY, AFFO per share of $11.78 (+19% YoY), net income +30% YoY, and a record 53% adjusted EBITDA margin. Bookings hit $424M annualized, +23% YoY — the second-highest in company history — with a record 9,700 net new interconnections added. Management called this "the largest single guidance raise in the history of the company," lifting FY2026 revenue guidance to $10.205–$10.285B and AFFO/share to $42.69–$43.29, plus raising the 2027-2029 long-term outlook (revenue growth to 10-13%).
The catch: Q3 2026 revenue guidance came in at $2.525–$2.575B, with the midpoint below the ≈$2.58B analyst estimate — the disappointment that overshadowed the strong full-year raise, in part because a one-time ≈$120M xScale lease fee that boosted Q2 won't recur. Shares fell ≈3% on the print and were down ≈3.5% into today's session — the proximate driver of today's put calendar.
🔮 Upcoming (Next 3–6 Months)
Next Earnings — Q3 2026, Expected Late October 2026. This is the next hard catalyst, and — critically — it sits outside the window of the near-dated Aug-21 leg in this trade, reinforcing the read that the calendar is technical/drift positioning rather than an earnings play.
AI-driven bookings durability. Management flagged four demand vectors driving the largest deals: private AI stacks, sovereign AI, AI-factory batch inference (liquid cooling), and latency-sensitive metro inference — a structural tailwind if it holds up through the next few quarters.
Capex ramp. FY2026 capex was raised to $5.0–$6.0B, rising to $5–$7B annually 2027-2029, with ≈80% targeting the top 25 supply-constrained metros. That's a funding requirement worth watching for a REIT sensitive to capital costs.
Analyst backdrop. Consensus stays "Buy" with an average price target ≈$1,199–$1,213 (≈16-18% upside from here); Citi's target is $1,260 while Barclays sits lower at $1,130, per stockanalysis.com.
🎲 Price Targets & Probabilities
Combining the gamma concentration at $1,000, the implied-move cone, and the earnings calendar:
📈 Bull Case (≈30% probability) — Target: $1,135–$1,200+
AI bookings durability confirms through the fall, no fresh capex-funding scare, and the stock reclaims its June highs on the way toward analyst target territory ($1,199–$1,260). This sits right at the top of the Aug-21 implied-move range and into the Sep-18/Nov-20 ranges.
🎯 Base Case (≈45% probability) — Target: $980–$1,090 (chop around $1,000)
The most likely scenario given where the flow is struck: EQIX digests the guidance wobble, grinds sideways-to-slightly-lower toward the psychologically important $1,000 level (where the heaviest gamma concentration sits) before stabilizing ahead of the late-October Q3 print. This is exactly the zone the put-calendar seller is positioned to profit from — the far short put decaying while the stock hovers near, but doesn't decisively break, $1,000.
📉 Bear Case (≈25% probability) — Target: $875–$960
A broader REIT/rate scare, a deceleration in AI-capex commentary industry-wide, or valuation compression (the stock still trades above GuruFocus's ≈$922 fair-value estimate even after the pullback) sends the stock through $1,000 and toward the lower end of the Nov-20 implied range. This is the scenario the near-dated Aug-21 long put and — more painfully — the naked far-dated Nov-20 short put are exposed to.
💡 Trading Ideas
🛡️ Conservative: Watch the OI, Don't Chase the Structure
This is an institutional relative-value trade — not a clean, easy-to-copy directional signal. The near leg's ambiguity has since been resolved (confirmed a fresh buy), but if you want simple exposure, consider a single small protective put (e.g., a modest OTM Aug or Sep put) sized to your own portfolio rather than mirroring an $8.6M multi-leg structure you can't fully verify. Risk level: Minimal | Skill level: Beginner-friendly.
⚖️ Balanced: Sell Premium Near the Gamma Wall (Copy the Vol-Harvest Idea, Not the Exact Trade)
If you're comfortable being short volatility, a defined-risk credit put spread around the $1,000 gamma concentration (e.g., sell a $980 put, buy a $940 put, September expiration) captures a similar "the stock probably doesn't crash through $1,000 in the next few weeks" thesis with capped, known risk — unlike the trader's naked far-dated short put. Risk level: Moderate | Skill level: Intermediate.
🚀 Aggressive: Own the Term-Structure Read (Advanced Only)
Replicate a scaled-down version of the actual structure — sell a small clip of Nov-20 $1,000 puts, buy a matched (1-for-1, not 3-for-2.5) clip of Aug-21 $1,000 puts — to isolate the same term-structure/time-decay view. This still carries undefined risk on the short far put if EQIX gaps hard lower on a capex-funding or rate scare before November. Only for traders who fully understand naked short-put margin and tail risk. Risk level: Extreme (undefined loss on the short leg) | Skill level: Advanced only.
👥 What This Means for Different Traders
🎰 YOLO Trader: This isn't your trade. It's a low-drama, net-credit, term-structure play — no fireworks, no lottery-ticket payoff. If you want action, the $1,000 gamma level and the Aug-21 implied-move edges ($961/$1,135) are at least worth watching for a fast scalp, but don't mistake this flow for a directional signal to YOLO into.
📈 Swing Trader: Watch $1,000 as the pivot the market (and this trade) is centered on. A clean break and hold below it into August — with the near-put leg now confirmed as a genuine fresh open — would validate near-term downside continuation toward $961–$924. A bounce and hold above $1,050 argues the post-earnings dip is done.
💰 Premium Collector: This trade is basically a professional-scale version of what you already do — selling the expensive, farther-dated option and using a cheaper near-dated option to manage the trade. Note the risk they're taking on (naked short far put, uneven leg sizes) before sizing your own version smaller and with defined risk (spread it, don't go naked).
🌱 Beginner: Don't try to replicate this exact structure — it involves two different expirations, uneven contract sizes, and undefined risk on one leg. The lesson to take away instead: not every big options trade you see in the news is a directional bet. This one is closer to "getting paid for time," a completely different (and generally lower-drama) strategy than buying calls or puts outright.
⚠️ Risk Factors — What the Tape Can and Cannot Prove
- ✅ Near-leg open/close is RESOLVED — confirmed a fresh buy (BTO). August $1,000 put OI rose 3,181 → 6,022 (+2,841 against a 3,000-lot print, ≈95%), so the partial-close/roll scenario is ruled out. That risk is retired.
- 🔓 The far leg is a naked, undefined-risk short put past Nov-20 for roughly 500 contracts beyond what's covered by the near leg — if EQIX gaps sharply lower on a capex-funding scare, rate shock, or broader REIT selloff, that side of the trade can lose significantly more than the $8.6M credit collected.
- 🕵️ No equity hedge block was found paired with this trade — this looks like a pure options-only volatility/term-structure position, not a delta-hedged package, but we cannot see the trader's other holdings (stock, other options, or positions at other brokers).
- 📊 Gamma data was thin today — only a handful of strikes populated with real support/resistance zones, so treat the gamma read as directional color, not a precise price map; the implied-move cone is the more reliable near-term guide here.
- 🙈 OPRA cannot tell us: who placed this trade, their broker, their full portfolio, or their true motive (income, view, or something else entirely). We can only read size, price, and OI — never intent with certainty.
🎯 The Bottom Line
Real talk: A $1,000-strike put calendar collecting ≈$8.6M net credit isn't a bet that Equinix crashes — it's closer to a bet that the post-earnings dust settles somewhere near the round-number $1,000 level over the next several weeks, with the trader getting paid up front for taking on downside risk further out into November. The soft Q3 guide gave the market a reason to test $1,000; this flow reads as positioning for (and profiting from) exactly that kind of drift, not a doomsday hedge.
If you own EQIX: the fundamentals (record AFFO growth, record guidance raise, AI-bookings momentum) remain intact — the pullback is a guidance-cadence story, not a broken thesis. Watching $1,000 as a level worth defending is reasonable; a clean hold there sets up a run back toward the $1,135–$1,200 analyst-target zone into Q3 earnings in late October.
If you're watching from the sidelines: don't read this trade as a bearish signal to short — it's structurally closer to neutral-to-mildly-bullish. The OI confirmation is now in (July 31 pre-market) and both legs opened, so the calendar was genuinely built rather than adjusted.
Mark your calendar:
- ✅ July 31, ≈06:30 ET — next-day OI snapshot (done — both legs confirmed OPENING)
- 📅 August 21, 2026 — near leg (Aug $1,000 put) expiration
- 📅 Late October 2026 — Q3 2026 earnings, the next hard catalyst (outside this trade's near-dated window)
- 📅 November 20, 2026 — far leg (Nov $1,000 put) expiration
Disclaimer: Options trading involves substantial risk of loss and is not suitable for all investors. This analysis is for educational purposes only and is not financial advice. The open/close status of both legs has been confirmed by the July 31 next-day open-interest snapshot: both opened. What the tape still cannot reveal is the desk's identity, motive, or any offsetting position held elsewhere. Past performance doesn't guarantee future results. Always do your own research and consider consulting a licensed financial advisor before trading.
Last updated: 2026-07-31 — next-day OPRA open-interest confirmed BOTH legs as OPENING (Nov-20-2026 $1,000P +2,500, an exact match; Aug-21-2026 $1,000P +2,841 vs a 3,000-lot print).