🔄 ETN's Put Package Was a Bearish ROLL, Not a Two-Leg Diagonal — Confirmed: Only the $3.5M September Leg Is New
📅 July 29, 2026 | 🔥 Unusual Activity Detected
🔄 Updated July 30, 2026 — the next-day OI snapshot inverted part of this read. The September $310 put opened cleanly (+5,718 contracts). The July-31 $350 put's open interest fell, which means it created nothing — it was the closing leg of a bearish roll down and out, not a second fresh long put. Only the ≈$3.5M September leg is genuinely new money. Direction is unchanged (still bearish/hedging), but the size of the new bet is roughly half what the headline premium implied. Full detail in the ✅ RESOLVED box below.
🎯 The Quick Take
A worked complex order on Eaton (ETN) hit the tape at 11:01:29 ET with the stock at $365.12 — 5,668 September $310 puts and 5,668 July-31 $350 puts, printed together as a multi-leg price-improvement auction (a facilitated, worked order — not a cross, not a lit sweep), just two days before Eaton reports Q2 earnings on Friday, July 31, before the open.
Next-day open interest has now settled what the tape could not: this was a bearish roll, not a two-layer bet. The September $310 leg is a confirmed fresh open — ≈5,718 brand-new contracts. The July-31 $350 leg retired open interest rather than creating it, so it was the exit side: the desk let go of its near-dated $350 exposure on the eve of expiry and moved the position down in strike and out in time, past the earnings print. Eaton ran ≈30% YTD on the AI-data-center power buildout, then gave back part of that gain into the print. Translation: someone is still paying real money to be positioned for a disappointing Friday — but they re-priced an existing bet rather than doubling it, and the genuinely new capital is ≈$3.5M, not ≈$6.2M.
📊 Company Overview
Eaton Corporation plc (ETN) is a global power-management company — the "grid-to-chip" name behind the electrical distribution equipment (switchgear, busway, UPS systems, transformers) that AI data centers need to actually get power from the grid to the racks.
- Market Cap: ≈$154.8 billion (as of July 27, 2026)
- Sector: Electrical Equipment / Industrials — Power Management
- Segments: Electrical (Americas + Global) and Aerospace, with a Mobility Group spin-off (Vehicle + eMobility, ≈$5B in sales) planned to complete by end-Q1 2027, leaving Eaton a focused Electrical + Aerospace pure-play
- Current Price: ≈$365.12 (July 29), down from a 52-week high near ≈$415.52 hit mid-July
Eaton's core thesis right now is the AI data-center supercycle: data-center orders up ≈240% year-over-year and a total data-center backlog reported at 228 GW as of Q1 2026 — call it roughly 12 years of demand at 2025 build rates.
💰 The Option Flow Breakdown
📊 What Just Happened
📐 MULTI-LEG AUCTION — BEARISH PUT ROLL (down & out) (facilitated, price-improvement order; both legs printed together at the same second — not a negotiated block cross, not aggressive lit sweeping)
| Time | Buy/Sell | Call/Put | Expiration | Premium | Strike | Volume | OI | Size | Spot | Option Price | Option Symbol |
|---|---|---|---|---|---|---|---|---|---|---|---|
| 11:01:29 | BUY (ROLL OPEN ✅) | PUT | 2026-09-18 | $3.5M | $310 | 6,085 | 3,165 | 5,668 | $365.12 | $6.26 | ETN20260918P310 |
| 11:01:29 | ROLL CLOSE 🔄 | PUT | 2026-07-31 | $2.7M | $350 | 5,733 | 5,770 | 5,668 | $365.12 | $4.70 | ETN20260731P350 |
Genuinely new money: ≈$3.5M (the September $310 leg). The ≈$2.7M attributed to the July-31 $350 leg funded an exit, not a position — next-day open interest proves that leg created nothing. Both legs printed at the same size (5,668 contracts) in the same second as one worked combo order; the structure is a roll, not a diagonal: the same bearish thesis moved to a lower strike and a later expiration.
✅ RESOLVED — Next-Day OI Settled This (July 30, 2026, ≈06:30 ET)
The OPRA open-interest snapshot timestamped 2026-07-30 (reflecting the EOD July 29 close) is in, and it separates the two legs decisively:
| Leg | Baseline OI (Jul 29 snap) | Resolving OI (Jul 30 snap) | Δ | Print size | Strike day-vol | Verdict |
|---|---|---|---|---|---|---|
| Sep-18-2026 $310 P | 3,165 | 8,883 | +5,718 | 5,668 | 6,085 | ✅ OPEN (BTO) — Δ is ≈101% of the print and ≈94% of the strike's entire session volume |
| Jul-31-2026 $350 P | 5,770 | 5,191 | −579 | 5,668 | 5,733 | 🔄 NOT AN OPEN — open interest fell; roll-close / transfer |
Why the falling number is decisive: open interest rises only when contracts are created and falls only when they are retired. A 5,668-lot print landing on a shrinking strike therefore cannot have opened new July-31 exposure. Roughly 5,089 contracts changed owners and ≈579 were retired outright.
- The "fresh second long put" reading is dead. No new July-31 $350 exposure exists.
- The "bearish roll" reading is confirmed. The desk released its near-dated $350 position on the eve of expiry and put on ≈5,718 fresh September $310 puts that outlive the earnings print by ≈7 weeks — a textbook roll down and out.
- Money re-cut: only the ≈$3.5M September leg is new risk capital. If the near leg was sold rather than bought — the geometry the OI now implies — the package's true net debit is nearer ≈$0.9M ($6.26 paid minus $4.70 collected, times 5,668) than ≈$6.2M.
- Direction is unchanged, and arguably cleaner. The desk now holds ≈5,718 September $310 puts and zero July-31 exposure. Still bearish/hedging into the print, with the runway now extending past it. What was never true is that they layered two bets.
- Residual uncertainty: OPRA does not reveal which party retired the 579 versus which merely transferred, so we cannot say whether the near leg was a sell-to-close of a long put or a buy-to-close of a short one. Both are exits and both leave the identical forward position. Both legs also filled at the NBBO midpoint (≈50% across on each), so per-leg aggressor was — and remains — unreadable, exactly as originally disclosed. Identity, motive, and any stock hedge stay invisible.
- Tape re-verified: no cancellation codes (the 40-44 family) appear on either leg. Attribution is clean.
🤓 What This Actually Means — Plain English
Let's decode this one piece at a time, because a roll confuses a lot of people — and because the tape and the open interest tell two different halves of the story.
What's a roll? It's one order that does two things at once: close an existing option position and open a replacement at a different strike, a different expiration, or both. You are not changing your mind about direction — you are re-pricing the same view for a different runway. Rolling down and out on puts means moving to a lower strike (cheaper, further from the money) and a later expiration (more time). That is exactly what happened here.
What actually happened, now that open interest has resolved it:
- 🟢 September $310 put — BTO, ROLL OPEN (confirmed). ≈5,718 brand-new contracts were created. This is the position the desk now owns: a strike ≈15% below spot that stays alive for ≈7 weeks after the earnings print, covering both the immediate reaction and any continued valuation de-rating drift afterward.
- 🔄 July-31 $350 put — ROLL CLOSE (confirmed). Open interest fell by 579 on a 5,668-lot print. Nothing was created. This leg was the desk letting go of its near-dated $350 exposure — a strike ≈4% below spot, expiring in 2 days, on the same morning Eaton reports.
Why a trader would do exactly this, two days before earnings: the July-31 $350 put was about to become a pure binary — expire worthless or pay off, with essentially zero time value left to cushion a wrong guess. Rolling it into the September $310 converts a coin-flip on one morning's reaction into a position that survives the print. You give up strike proximity (you now need a ≈15% decline instead of ≈4%) to buy runway. That is a de-risking move within a bearish thesis, not an escalation of it.
The one thing that never changed: this is downside positioning, not a bullish trade. But the honest size is smaller than the headline. A trader did not spend ≈$6.2M on two layers of puts here; they spent ≈$3.5M on one September layer and recycled a near-dated position to help pay for it.
Order type — now settled:
- September $310 leg: BTO (Buy to Open) — confirmed by a ΔOI of +5,718 on a 5,668-lot print.
- July-31 $350 leg: ROLL CLOSE — the classifier's default BTO label is wrong and has been corrected. Open interest retired rather than grew, which is only possible on a closing trade. Whether it was a sell-to-close (of a long put) or a buy-to-close (of a short put) is not visible on OPRA; both are exits and both leave the same forward position.
Separating the catalyst from the expirations — don't mix these up:
- The catalyst is one single event: Eaton's Q2 2026 earnings, reported Friday, July 31, 2026, before the market open.
- The July-31 $350 put expires on that exact same day — a direct, leveraged, binary bet on the earnings reaction itself, with essentially zero time value left to cushion a wrong guess. This desk exited that exposure rather than carrying it into the print, which is the single most informative thing about the trade.
- The September $310 put is the position that survives. It stays alive for ≈7 more weeks after the print, so it is protection (or a bet) against BOTH the immediate earnings reaction AND any continued valuation de-rating drift afterward — the same slow bleed that has already knocked Eaton down ≈4% over the past month.
- Read the swap, not the legs: trading a 2-day $350 strike for a 51-day $310 strike says "I want to stay short Eaton, but I do not want my thesis to live or die on one morning's headline." That is a risk-management decision layered on top of a bearish view.
📈 Technical Setup / Chart Check-Up
YTD Performance Chart
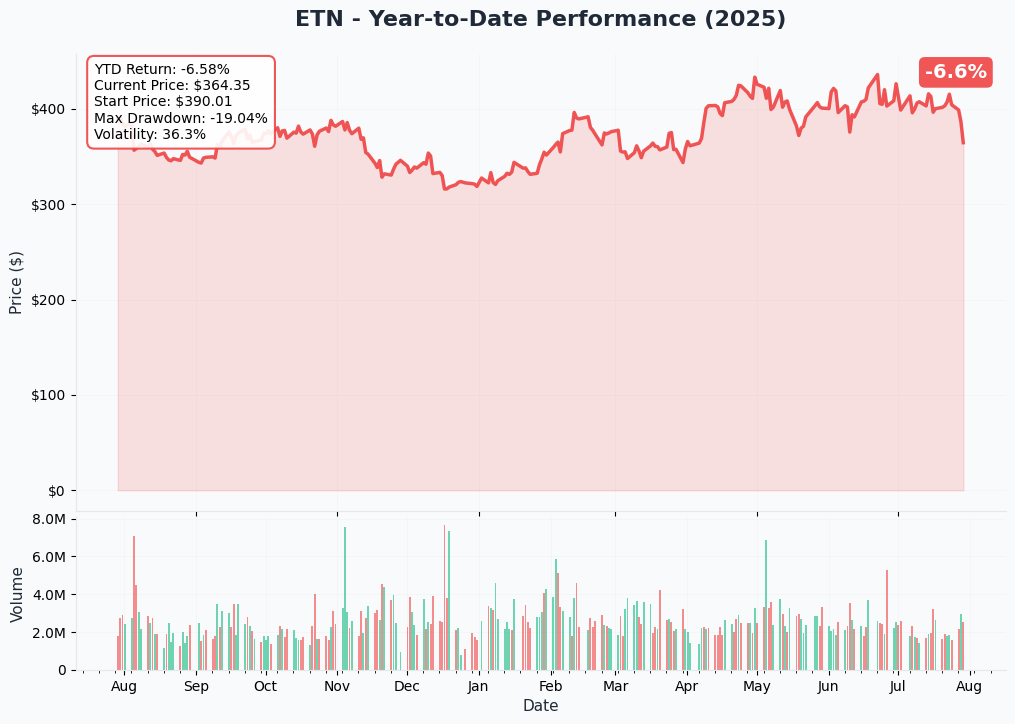
Eaton has been one of the poster children of the AI-power trade — up ≈30% YTD at its mid-July highs near $415.52, riding the data-center electrification supercycle. But the stock has cooled off hard into earnings: down ≈4.1% over the past month, including two separate ≈−3% sessions (July 24 and July 28), as the AI-power trade got hit by higher yields and at least one model-portfolio removal on valuation grounds. Spot on July 29 sits at ≈$365, roughly 12% off the July highs.
Gamma-Based Support & Resistance Analysis
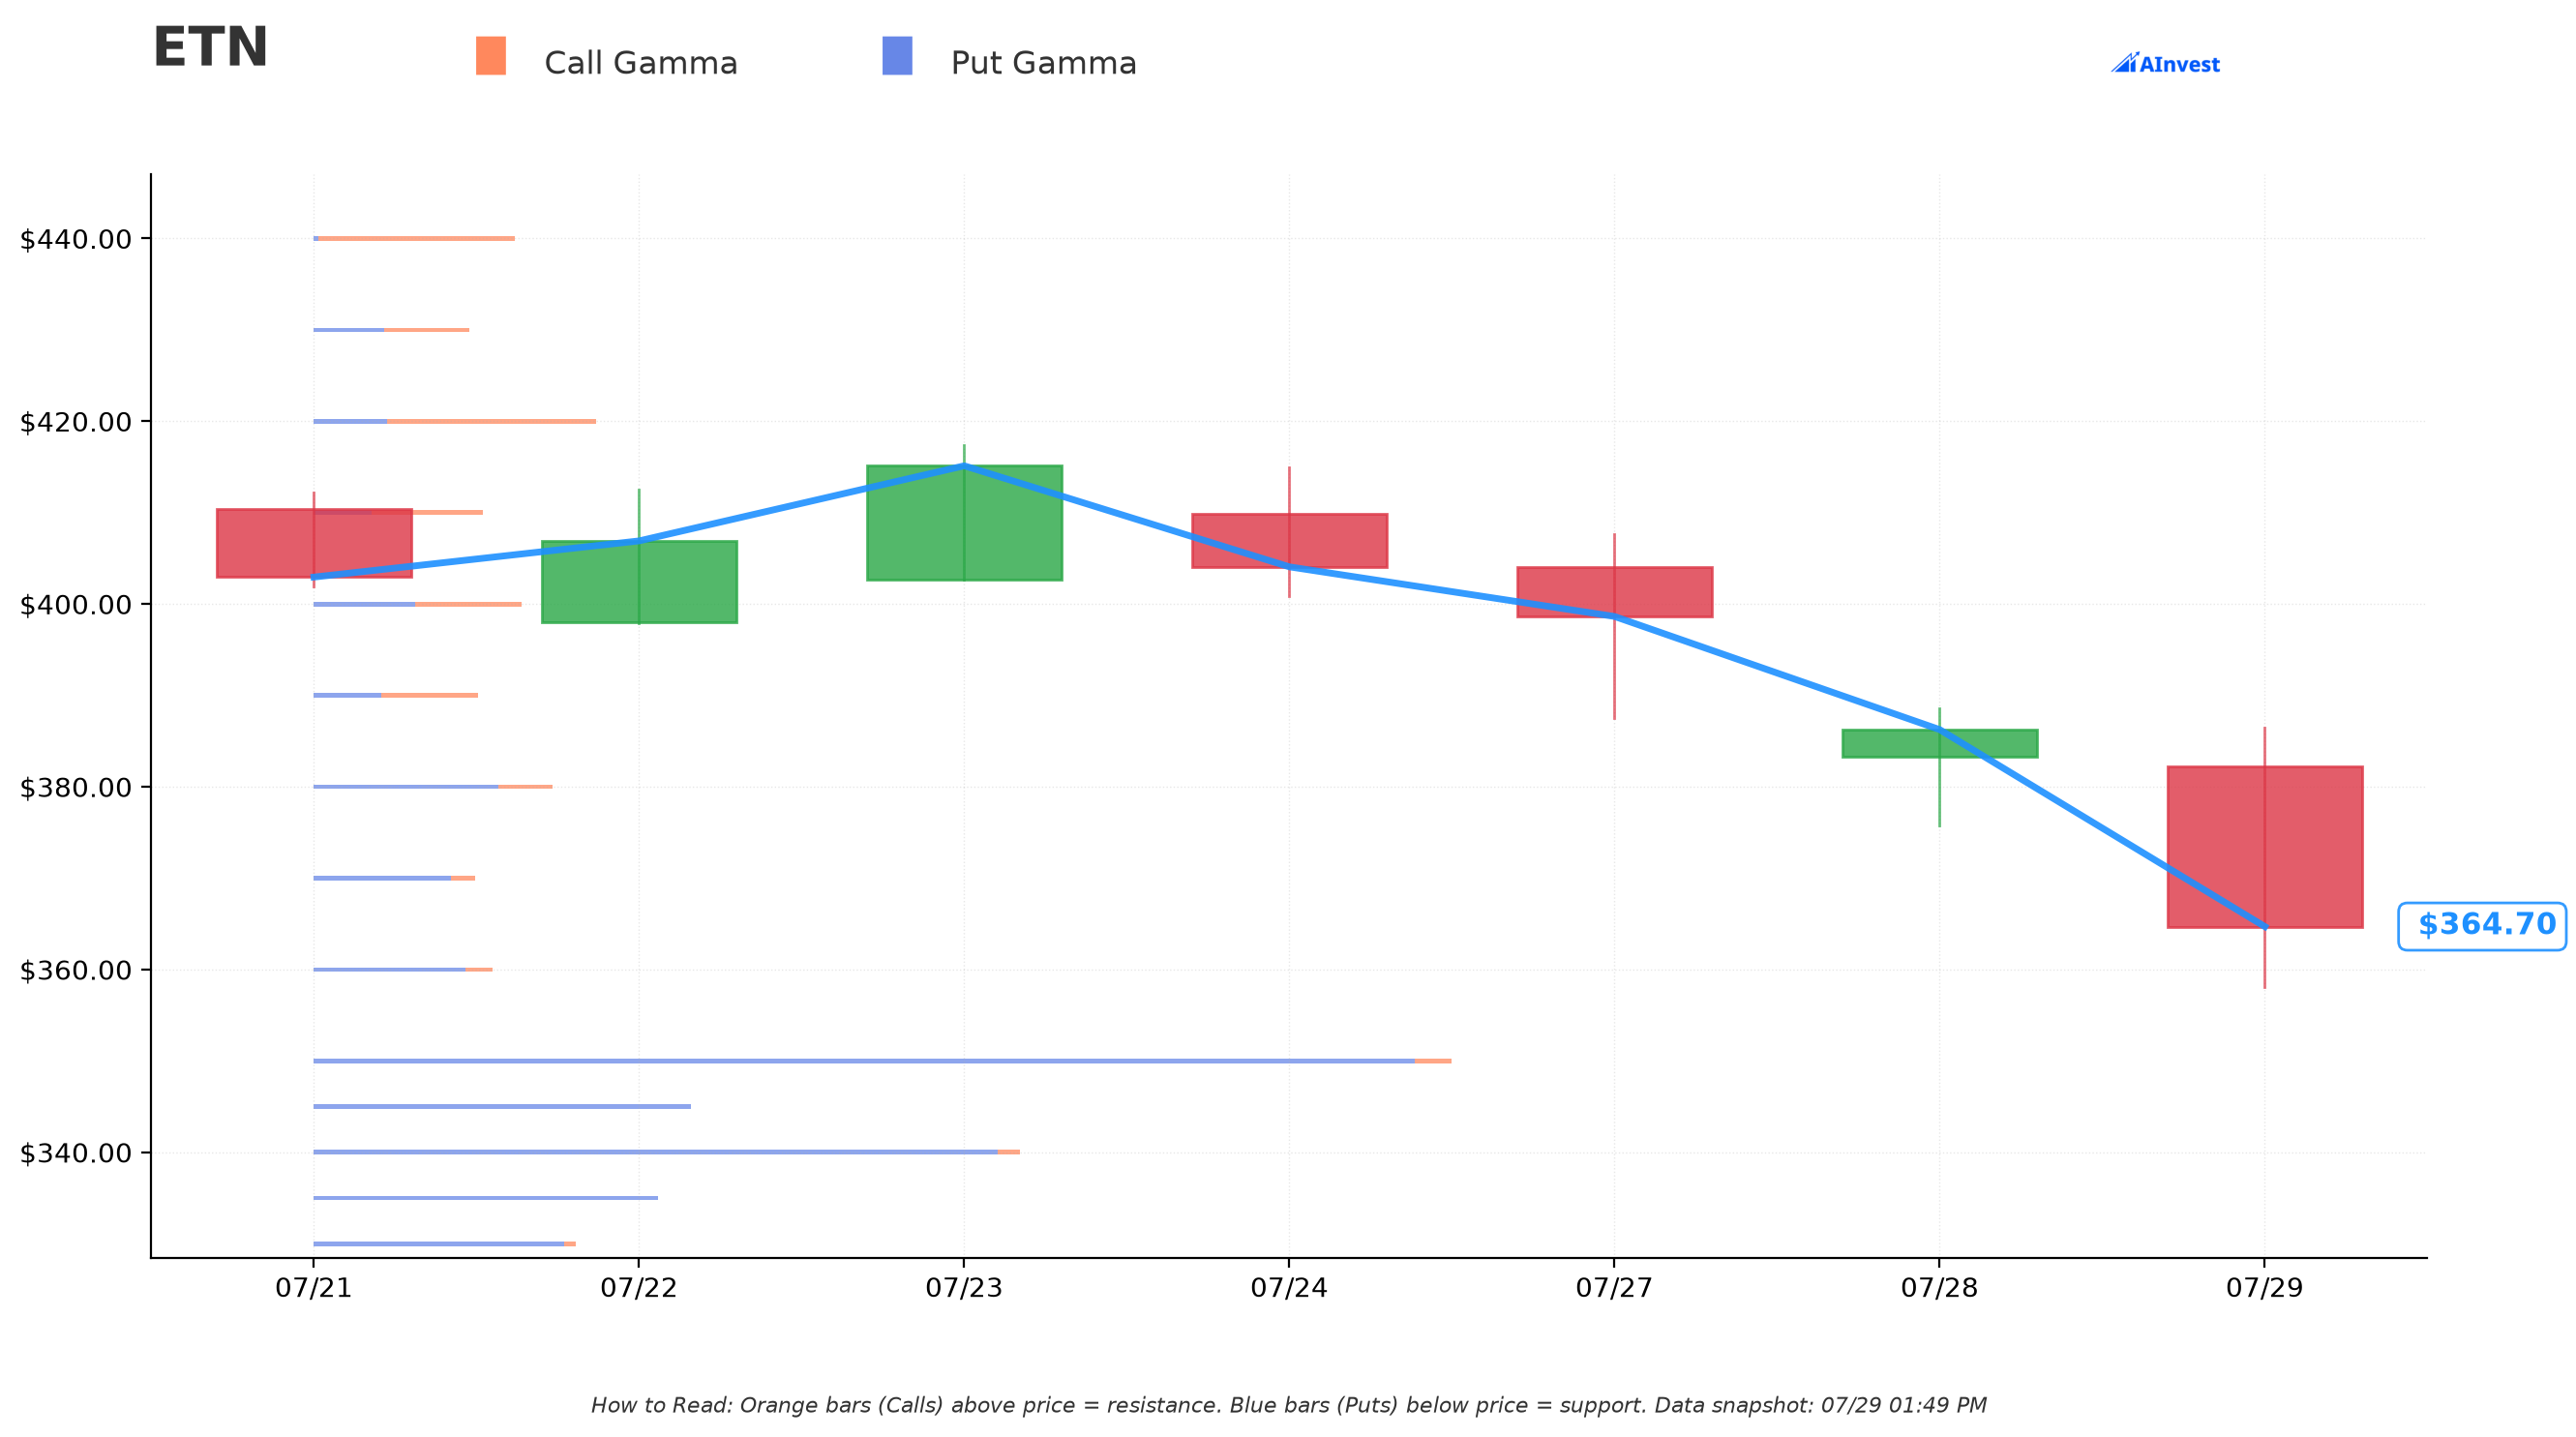
Current Price: $364.87
- 🔵 $350 — the single strongest support level on the board (total gamma exposure ≈$2.91B, of which ≈$2.82B is put gamma — 96% put-dominated), sitting ≈4.1% below spot, flagged "Moderate" strength. This is exactly where the July-31 $350 put is struck — the trader positioned right at the level where dealer hedging flows are already concentrated.
- 🔵 $340 — the deepest put-gamma bar on the chain (≈$1.81B total, ≈$1.75B put), ≈6.8% below spot.
- 🔵 $330 — secondary support (≈$0.67B total), ≈9.6% below spot.
- 🔵 $310 — the September put strike itself: ≈$0.46B total gamma (≈$0.44B put), ≈15% below spot — a real, if secondary, gamma pocket. The longer-dated leg is also struck at a level with actual dealer positioning behind it, not a random number.
- 🟠 No major call-gamma ceiling directly overhead. The strikes above spot ($380, $390, $400, $420, $440) each carry only $0.14B–$0.53B in call gamma — thin and scattered compared to the $350 put wall. That means dealers aren't defending a nearby resistance level, so if Eaton rallies on a beat, there's less mechanical selling pressure to slow it down near-term (the first real concentration doesn't show up until $420–$440).
What this means for traders: the market's dealer positioning is heavily loaded with puts below spot, concentrated right around $335–$350. If Eaton sells off on the print, that's the zone where hedging flows are thickest — it can act either as a magnet (price gravitates there) or a speed bump, depending on how dealers are positioned. Both put legs in this trade sit directly inside real gamma structure, not at arbitrary strikes.
Implied Move Analysis
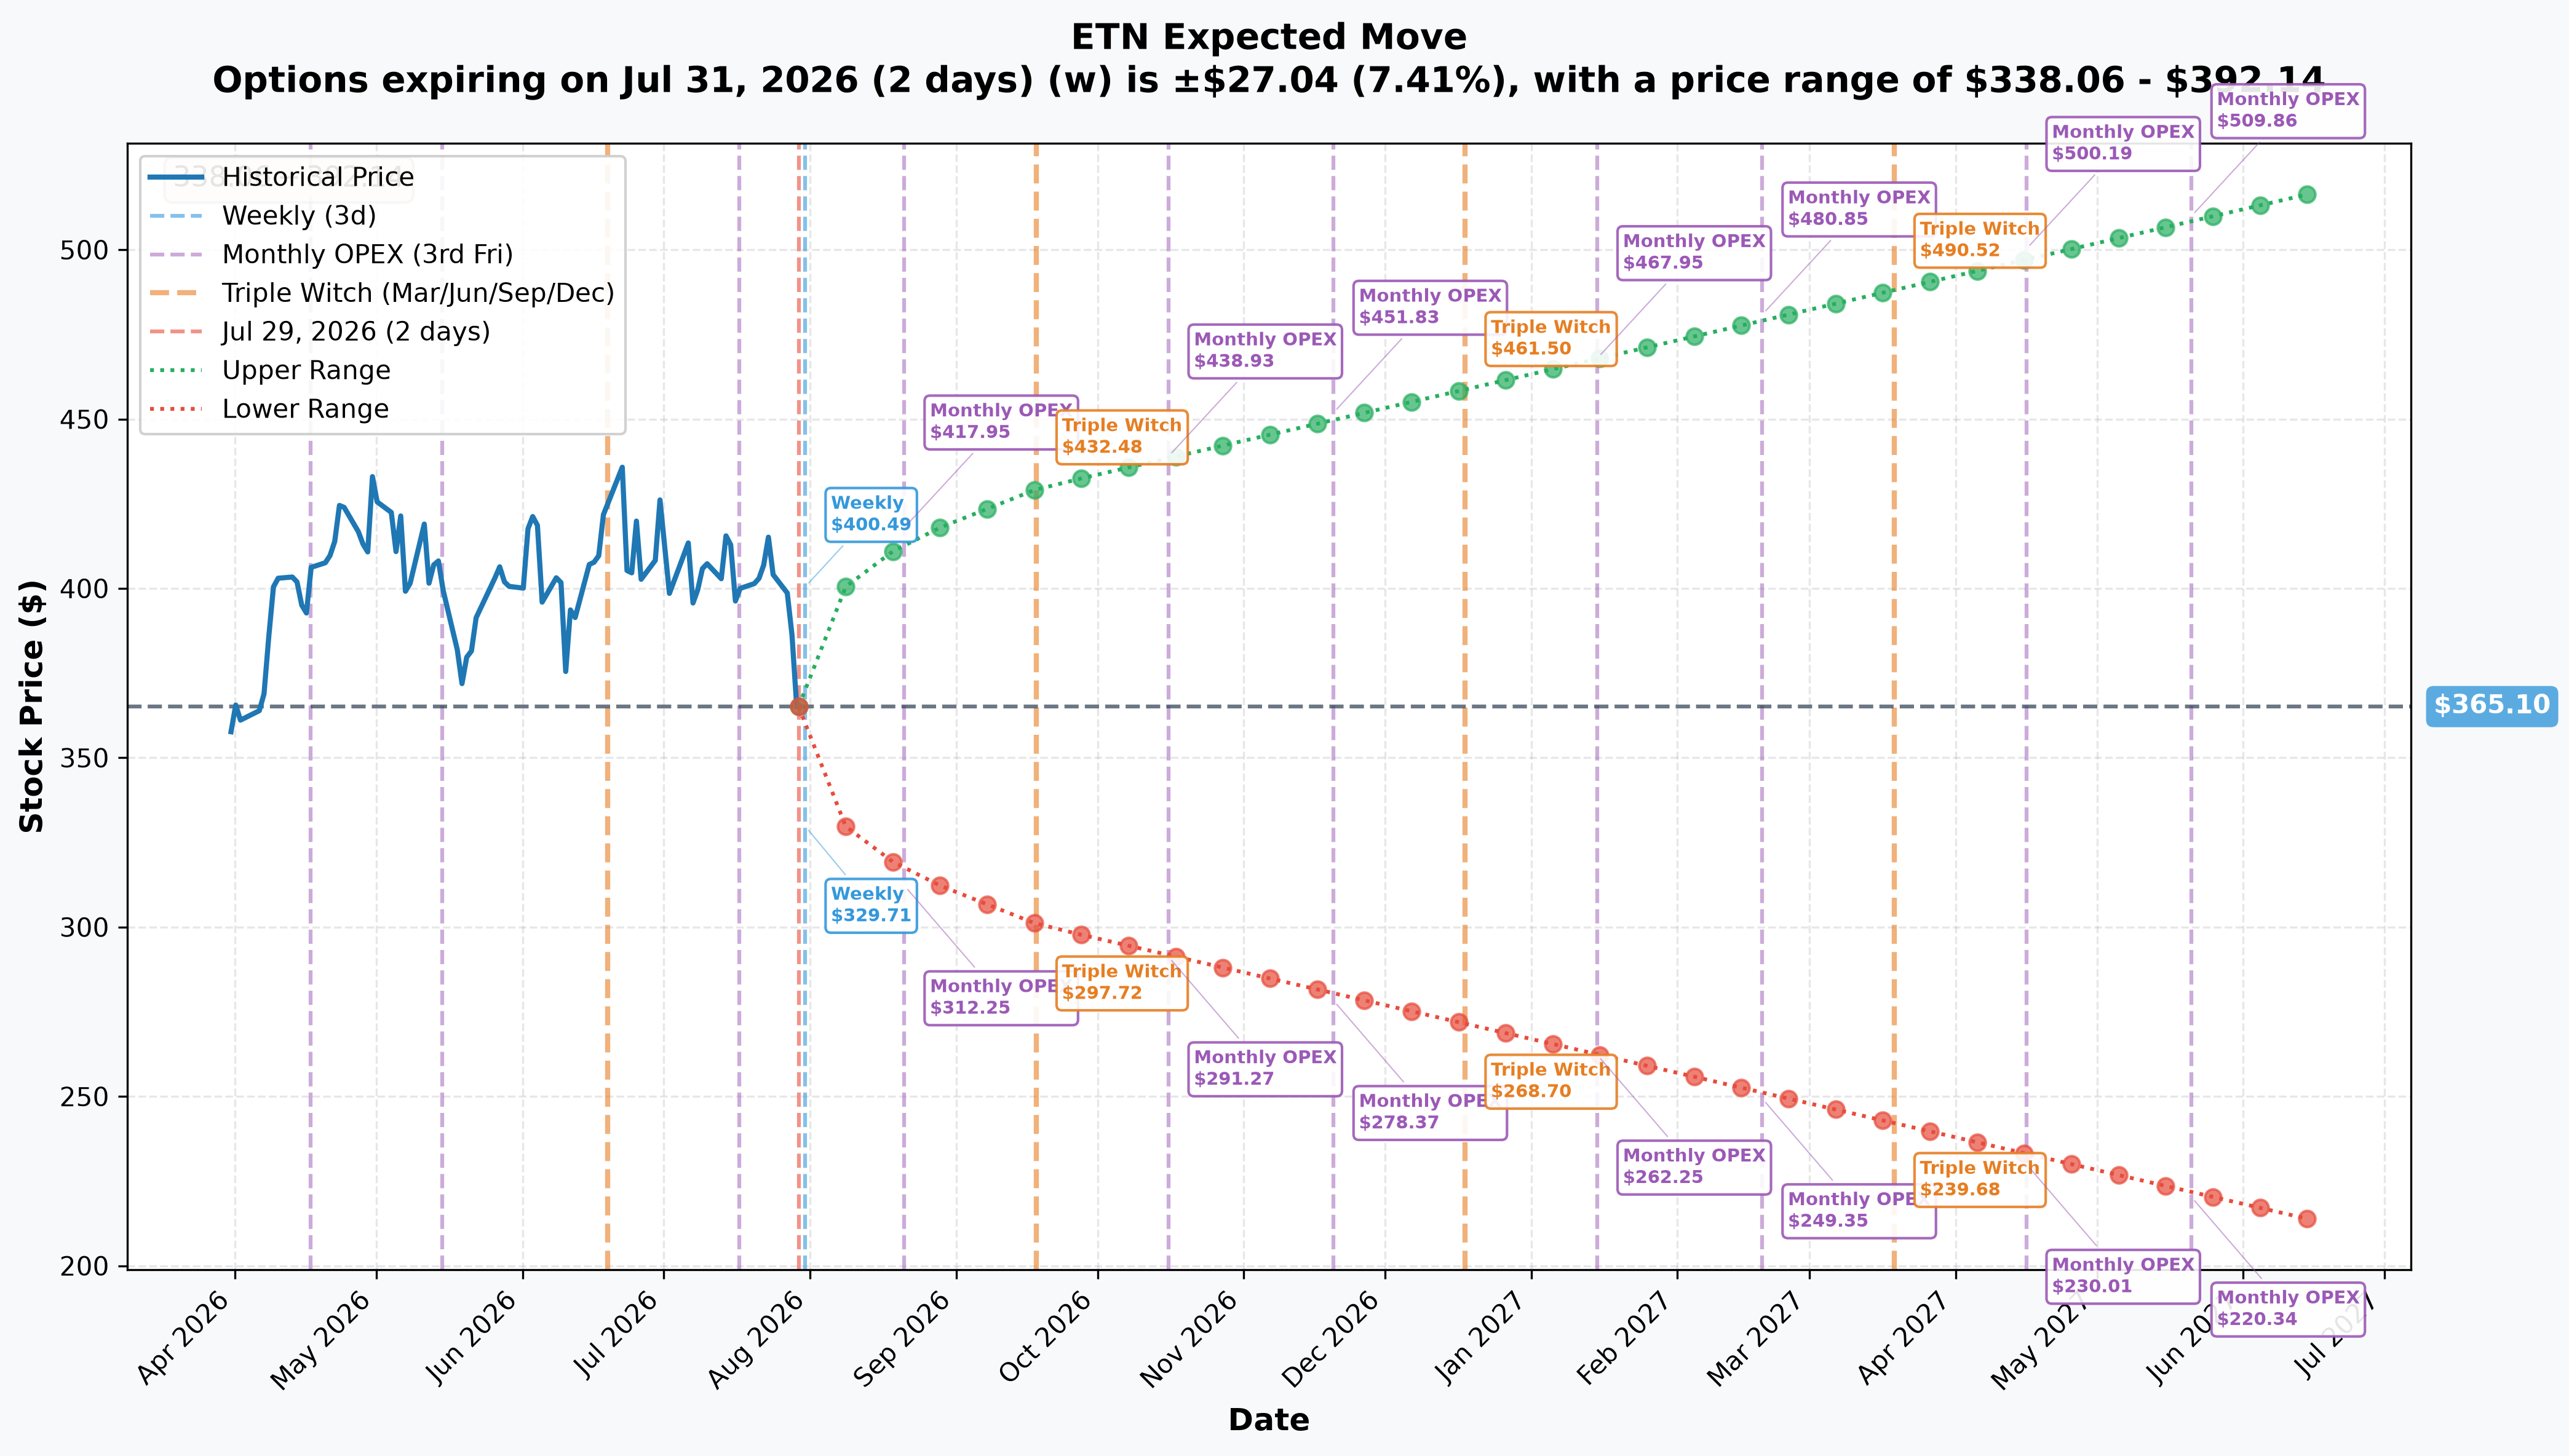
- 📅 Weekly (July 31 — 2 days, the earnings print AND the $350 put's expiration): ±7.41% (±$27.04) → range $338.06 – $392.14
- 📅 Monthly OPEX (August 21 — 23 days): ±13.41% (±$48.97) → range $316.13 – $414.07
- 📅 Quarterly Triple Witch (September 18 — 51 days, the exact expiration of the Sep $310 put): ±17.66% (±$64.48) → range $300.62 – $429.58
Translation for regular folks: options are pricing a ±7.4% swing around Friday's earnings alone — meaningfully MORE than the ≈4.1% distance from spot down to the $350 strike. That means the $350 put isn't a moonshot; the market itself thinks a move that size is well within reach on earnings day. Go out to September 18, and the implied-move floor sits at $300.62 — just below the $310 strike on the longer-dated leg. In other words, the market is pricing almost exactly enough movement, by the Sep expiration, for this position's deeper strike to matter. Neither leg is priced for an unrealistic move; both sit inside what the options market itself considers plausible.
🎪 Catalysts
✅ Recent Catalysts (Last 3 Months)
Q1 2026 Earnings (reported May 5, 2026) — the setup for this print:
- Record Q1 revenue of $7.451B, +17% YoY, beating consensus of ≈$7.09–7.13B, with adjusted EPS of $2.81 (a Q1 record) topping the ≈$2.73–2.74 estimate (Tickeron, BigGo)
- Organic sales growth accelerated to 10%, beating prior 5–7% guidance, and full-year guidance was raised: organic growth to 9–11%, adjusted EPS to $13.05–$13.50 (Alphastreet)
- The bearish tell already visible in Q1: segment operating margin contracted 120 bps to 22.7% as the cost of scaling production pressured profitability — the company guided to a ≈150 bps sequential Electrical Americas margin recovery in Q2, which is now the number to watch (Investing.com)
- Data-center orders +≈240% YoY, Electrical backlog +48% YoY, total backlog climbing to ≈$14.5B (+44% YoY), and management's data-center pipeline now stands at 228 GW (BigGo, Globe and Mail)
- Mobility Group spin-off announced January 26, 2026 — Eaton plans to separate its ≈$5B Vehicle + eMobility segments into an independent, tax-free public company, targeted for completion by end-Q1 2027, leaving Eaton a focused Electrical + Aerospace pure-play (Eaton)
- De-rating into the print: Eaton was removed from at least one major model portfolio on the view that shares already trade at a rich multiple, a trigger for late-July profit-taking, compounded by rising Treasury yields pressuring high-multiple electrification names (Parameter, QuiverQuant)
- Shares fell −3.05% on July 24 and −3.1% on July 28 on consecutive risk-off sessions (TradingKey, GuruFocus)
🔥 Upcoming Catalysts (Next 6 Months)
Q2 2026 Earnings — Friday, July 31, 2026, before market open (11 a.m. ET call) — THIS IS THE EVENT (Eaton IR, StockTitan)
- Consensus adjusted EPS ≈$3.08, up ≈4.4% from $2.95 a year ago (Yahoo Finance preview)
- Watch for: (1) whether the ≈240% data-center order growth pace holds or decelerates; (2) whether Electrical Americas margin actually recovers the guided ≈150 bps; (3) any FY2026 EPS guide raise beyond $13.05–$13.50; (4) book-to-bill/backlog trajectory
- This is the exact event the July-31 $350 put is positioned against — a direct earnings-day bet with a strike ≈4% below spot
Beyond the print:
- Q3 2026 earnings — expected late October / early November 2026 (typical cadence, not yet dated)
- Mobility Group spin-off progress — Form 10 filing and structural milestones expected through 2026, ahead of the end-Q1-2027 completion target (Eaton)
- Continued data-center capacity ramp and potential new hyperscaler/utility award announcements tied to the 228 GW pipeline (Globe and Mail)
- Analyst backdrop: consensus rating is Buy (18 analysts), median price target ≈$471, though at least one house has trimmed its target on a lower assumed ≈26x forward P/E (MarketBeat, Yahoo/valuation)
🎲 Price Targets & Probabilities
Using the gamma structure, implied-move ranges, and earnings setup above, here's how this could play out through the September $310 put's expiration (September 18):
📈 Bull Case (≈25% probability)
Target: $390–$414 (weekly and monthly implied-move upper bounds)
Eaton beats the $3.08 EPS consensus, data-center order growth holds near the ≈240% pace, Electrical Americas margin delivers the guided ≈150 bps recovery, and management raises the FY2026 EPS guide beyond $13.50. With no real call-gamma wall until $420–$440, a genuine beat-and-raise has room to run without much dealer-hedging resistance in the way. Both put legs in this trade would likely expire worthless or near-worthless.
🎯 Base Case (≈45% probability)
Range: $345–$380 (chops between the $350 put wall and the implied-move envelope)
Eaton delivers a solid-not-spectacular quarter: EPS roughly in line, margin recovery on track but not dramatic, guidance reaffirmed rather than raised. Shares consolidate in a range bounded below by the $350 gamma wall and above by thinning resistance, digesting the ≈30% YTD run. This is the toughest outcome for a pure-directional read of the trade — the near leg could expire near the money either way.
📉 Bear Case (≈25–30% probability)
Target: $310–$340 (aligned with the $340/$330/$310 gamma pockets and the Sep 18 implied-move floor of $300.62)
Margin recovery disappoints, data-center order growth decelerates off its 240% pace, or guidance is merely reaffirmed against an elevated bar — any of these would validate the valuation-driven de-rating already underway. A break of the $350 support wall opens a path toward the $340 and $330 gamma pockets, with the September $310 put positioned almost exactly at the implied-move floor for that expiration. This is the scenario the ≈5,718-contract September $310 position — the confirmed-new ≈$3.5M leg of the roll — is designed to profit from or protect against.
💡 Trading Ideas
🛡️ Conservative: Let Earnings Clear First
Play: Stay on the sidelines through Friday's print; earnings in 2 days with a ±7.4% implied move is binary risk, and pre-earnings options are priced for that uncertainty.
Why this works: You avoid paying an elevated volatility premium for a coin-flip outcome. Post-earnings IV crush typically makes options meaningfully cheaper within a day or two, giving you a better entry whichever direction the stock goes.
Risk level: Minimal | Skill level: Beginner-friendly
⚖️ Balanced: Defined-Risk Put Spread, Post-Print
Play: After earnings clears and IV crushes, consider a defined-risk put spread around the same $350/$310 zone this trade used — for example buy the $350 put-equivalent strike in a later expiration, sell a lower strike against it.
Why this works: Defined maximum risk, targets the same gamma-supported zone the institutional flow is positioned around, and avoids paying full pre-earnings IV.
Risk level: Moderate (defined risk) | Skill level: Intermediate
🚀 Aggressive: Mirror the Longer Tail Hedge (Advanced Only)
Play: If you have a genuine bearish view on Eaton's valuation independent of the earnings print itself, consider a smaller-size version of the September $310 put — the longer-dated leg of this exact trade — rather than the binary July-31 leg.
Why this could work: 51 days of runway gives the thesis (margin miss, order deceleration, continued de-rating) time to play out beyond a single earnings reaction, and the strike sits inside a real gamma pocket and near the September implied-move floor.
Why this could blow up: If Eaton beats and re-asserts the AI-power narrative, this put loses value steadily to time decay with no single catalyst to bail it out quickly. Only risk capital you can afford to lose entirely.
Risk level: High | Skill level: Advanced only
⚠️ Risk Factors
Be honest about what the tape can and cannot prove here:
- Per-leg buy/sell direction is still not provable on this structure — and that limit survived the resolution. Both legs printed as a multi-leg auction combo at the NBBO midpoint (≈50% across on each), and the exchange's price-improvement mechanism allocates a net price across both legs, so per-leg aggressor reads are unreliable. Open interest proves the September leg opened and the July-31 leg closed; it cannot tell us whether that close was a sell-to-close of a long put or a buy-to-close of a short one.
- The July-31 $350 leg's open-vs-close status is now RESOLVED — as a close. ✅ Open interest fell 5,770 → 5,191 (−579) against a 5,668-lot print, so no new exposure was created. The classifier's provisional BTO label was wrong and is corrected above. What remains unknowable is which party retired the 579 contracts versus which merely took over the other 5,089.
- The ≈$6.2M headline overstated the risk capital. Only the ≈$3.5M September leg is new. Treat any premium figure on a multi-leg package as gross until open interest separates the legs — this trade is a clean example of why.
- OPRA data cannot tell us who placed this trade, why, or what else is in their book. No broker/MMID, no customer identity, no order ID, no visibility into whether this trader already holds Eaton stock or calls that this position is hedging. It could be portfolio protection on a large existing long, a standalone bearish bet, or a spread against another position entirely.
- Earnings binary risk is real and imminent. Two days out with a ±7.4% implied move means Eaton could gap sharply in either direction Friday morning — this is not a slow-moving setup.
- Valuation cuts both ways. Eaton trades near or above several analyst fair-value estimates after its ≈30% YTD run; a beat-and-raise could still trigger a "sell the news" reaction even on good numbers, just as a modest miss against a high bar could trigger an outsized drop.
- Fundamentals remain genuinely strong. Record backlog, 228 GW data-center pipeline, and a Buy-consensus rating with a median target ≈$471 mean this bearish positioning is a near-term tactical bet, not necessarily a read on Eaton's multi-year story.
🎯 The Bottom Line
Real talk: The headline said ≈$6.2 million on a two-leg put diagonal. Next-day open interest says something more modest and more interesting: a desk rolled its Eaton downside down and out two days before earnings — releasing ≈5,668 contracts of July-31 $350 exposure that was about to become a pure coin-flip, and opening ≈5,718 fresh September $310 puts that outlive the print by ≈7 weeks. The genuinely new capital is ≈$3.5M, and the true net debit may be under ≈$1M. Still bearish positioning, still not a bullish signal — but a re-priced bet, not a doubled one.
If you own ETN:
- ✅ Know that $350 is the strongest identified gamma support below spot — a clean break of that level on a post-earnings selloff could accelerate toward $340/$330.
- 🛡️ Consider whether your own position needs earnings-week protection; this trade shows at least one large player thinks it does.
- ⏰ Don't overreact pre-earnings — the fundamentals (record backlog, 228 GW pipeline, Buy-consensus rating) haven't changed.
If you're watching from the sidelines:
- ⏰ Friday, July 31, before the open is the moment of truth — avoid initiating new directional positions until the print and the initial reaction are in.
- ✅ The OI question is settled: the $350 leg closed (OI fell 579 on a 5,668-lot print) and the $310 leg opened (+5,718). The live position to watch is the September $310 put, not the near-dated one — that exposure is gone.
- 🎯 A post-earnings pullback toward the $340–$350 gamma zone would be a logical spot to reassess entries either direction.
Mark your calendar:
- ✅ July 30, ≈06:30 ET — done. Next-day OI published and resolved the package: September $310 opened (+5,718), July-31 $350 closed (−579).
- 📅 July 31, before market open — Eaton Q2 2026 earnings (11 a.m. ET call). The July-31 $350 put expires the same day, but this desk no longer holds it.
- 📅 August 21 — Monthly OPEX
- 📅 September 18 — Triple Witch, expiration of the September $310 put — the leg that actually carries this position now
Final verdict: Eaton's long-term AI-power story remains intact — record backlog, a 228 GW pipeline, and a Buy-consensus rating with a ≈$471 median target. But a sophisticated desk rolled its downside down and out two days before a high-stakes print, with the stock already ≈12% off its highs — trading near-dated binary risk for ≈7 weeks of runway below $310. That is a considered bearish hedge being maintained past earnings, not a headline-grabbing new bet, and the ≈$3.5M of confirmed new money is the number that matters.
Disclaimer: Options trading involves substantial risk of loss and is not suitable for all investors. This analysis is for educational purposes only and is not financial advice. Past performance doesn't guarantee future results. This trade printed as a multi-leg auction (a facilitated, worked order) at the NBBO midpoint on both legs, so per-leg buy/sell direction is not readable from the print. Next-day open interest has resolved the open-vs-close question — September $310 opened, July-31 $350 closed — but it cannot reveal which counterparty retired versus transferred contracts, nor either party's identity, motive, or any offsetting stock position. Always do your own research and consider consulting a licensed financial advisor before trading. Earnings create binary event risk with potential for sharp gaps in either direction.
Last updated: July 30, 2026 — next-day OPRA open interest resolved this package as a bearish roll down and out. The September $310 put opened (+5,718 contracts, confirmed BTO); the July-31 $350 put's open interest fell 579, proving it was the closing leg, not a second fresh long. Title, premium attribution, order-type labels, structure classification and forward-looking guidance all revised accordingly. Original publication: July 29, 2026.