🤝 FDX: $9.76M Block Cross Sells the One FedEx Expiration With No Earnings Inside It
📅 2026-08-11 | 🔥 Unusual Activity Detected
🔄 Updated 2026-08-12 pre-market — the next-day OPRA open interest confirmed the open, above the published prediction. Open interest on the September $330 call went 640 → 10,669 (+10,029) against a 10,000-lot sale, versus the ≈10,640 we published. The delta slightly exceeds the block, so none of this was absorbed as transfer — it is genuinely new short-call obligation. See the ✅ RESOLVED box.
🎯 The Quick Take
A single 10,000-lot block crossed at 10:32:19 ET, selling the September 18, 2026 $330 calls for $9.76 each — ≈$9.76M of premium collected. The strike sits only ≈1.5% above the $325.26 flow-time spot, but the reason this trade is genuinely unusual has nothing to do with the strike: the September 18 expiration contains no FedEx earnings report, because FedEx changed its fiscal year end and the customary mid-September print simply is not happening in 2026. Several public earnings calendars still say it is. That mismatch is the story.
🏢 Company Overview
FDX — FedEx Corporation — is an integrated transportation and logistics company headquartered in Memphis, Tennessee, with roughly 300,000 full-time employees. Two structural changes in the last three months matter more than anything else for reading this trade:
- 🚚 The business itself. Under the "One FedEx" consolidation, Express, Ground and FedEx Services now sit together inside a single Federal Express segment, which posted Q4 FY2026 revenue of $21.6 billion, up 14% year over year, and now makes up over 95% of total company revenue.
- ✂️ FedEx Freight is spun off — completed, not planned. The separation closed on June 1, 2026: one FedEx Freight share for every two FDX shares, with FedEx Freight now trading independently as FDXF. FedEx kept a 19.9% stake it has committed to unwind within 24 months. This spin-off caused a mechanical ≈17.8% reset in the raw FDX price series — that's shareholder value leaving the FDX quote, not a loss.
- 📅 The fiscal year itself changed. FedEx moved its fiscal year end from May 31 to December 31, effective June 1, 2026, with a seven-month Transition 10-K covering June–December 2026. This is the fact that makes today's trade interesting — more on it in Catalysts below.
Market cap: ≈$76–77 billion (≈$76.1B at the $321.86 last price, ≈$77.0B at the $325.26 flow spot). Sector: Industrials → Transportation → Air Freight & Logistics.
💰 The Trade — Plain English
Someone sold 10,000 September 18 call options at the $330 strike and collected roughly $9.76 million in premium. This printed as a negotiated block cross — a broker matched a known buyer and seller off the open order book. There's no urgency here and no aggressive sweep; a cross means both sides already agreed on price before it hit the tape.
| Field | Detail |
|---|---|
| Time | 10:32:19 ET |
| Buy/Sell | SELL |
| Call/Put | CALL |
| Expiration | 2026-09-18 |
| Premium | $9.76M |
| Strike | $330 |
| Volume | 10,000 |
| Prior OI | 640 |
| Size | 10,000 |
| Spot | $325.26 |
| Option Price | $9.76 |
| Option Symbol | FDX20260918C330 |
| Order Type | STO |
| Strategy | Short OTM Call — Premium Collection |
| Mechanism | 🤝 BLOCK CROSS (negotiated, known counterparty) |
✅ RESOLVED — A Clean Open, +29 Contracts Above the Published Figure
Updated 2026-08-12 pre-market. Resolving OPRA snapshot timestamped August 12 (reflects the August 11 close, after this print); baseline is the August 11 snapshot (reflects the August 10 close, before this print).
| Leg | Baseline (Aug-11) | Resolving (Aug-12) | Δ | Print size | What we published | Verdict |
|---|---|---|---|---|---|---|
| Sep-18 $330 call (sold) | 640 | 10,669 | +10,029 | 10,000 | "rising from 640 toward ≈10,640" | ✅ OPEN (STO) — +29 above prediction |
We carried a caveat that even a clean size-over-OI open can partly resolve as transfer, and that the increase might land under the full 10,000. It did not — open interest rose by more than the block size, which means essentially all 10,000 contracts are net-new and a little additional flow followed the cross in. The short-call position described below is real, new, and outstanding.
Nothing in the analysis below needs revision.
🤓 What This Actually Means — Plain English
What the seller just did: sold someone else the right to buy 1,000,000 FedEx shares (10,000 contracts × 100) at $330 any time through September 18, and pocketed $9.76M today for taking on that obligation. This is a short call — a bet that FDX does not close meaningfully above $330 by expiration, or a yield play on shares the seller may already own.
What the seller is now on the hook for: if FDX is trading above $330 at expiration, the seller must deliver those shares at $330 — a strong price if the stock keeps running, or simply the trade-off for the $9.76M already banked if it does not. On a bare, uncovered basis the math is: max profit is the full $9.76M premium if FDX finishes at or below $330; the position starts losing money above ≈$339.76 (strike + premium collected per contract), and losses from there are theoretically open-ended if there's no stock underneath it. We cannot tell from the options tape alone whether this is a covered call against an existing stock position or a naked short — that distinction changes the risk picture completely, and it isn't visible in OPRA data.
Why an earnings-free window is exactly what a premium seller wants: selling calls means betting against a big move. A FedEx September expiration has historically straddled the company's fiscal Q1 earnings — one of its largest single-day-move catalysts of the year. The fiscal-year change removed that print from this cycle entirely (see Catalysts). A trader selling premium into a 38-day window with the company's biggest scheduled catalyst simply absent is collecting income against a quieter calendar than FedEx normally offers in September — that's the structural logic of this trade, whether or not it turns out to be right.
The ex-dividend wrinkle: FedEx's ex-dividend date is estimated to land ≈September 7–9, 2026 (≈$1.22/share, based on the two-year pattern — not yet declared as of today). If FDX is trading above $330 heading into that date, holders of the in-the-money call have a real incentive to exercise early to capture the dividend, which means the seller of this call could be assigned before expiration rather than at it. That's the one concrete calendar risk sitting inside this specific window, and it's worth watching regardless of which side of this trade you're on.
📊 Charts
1-Year Price Context
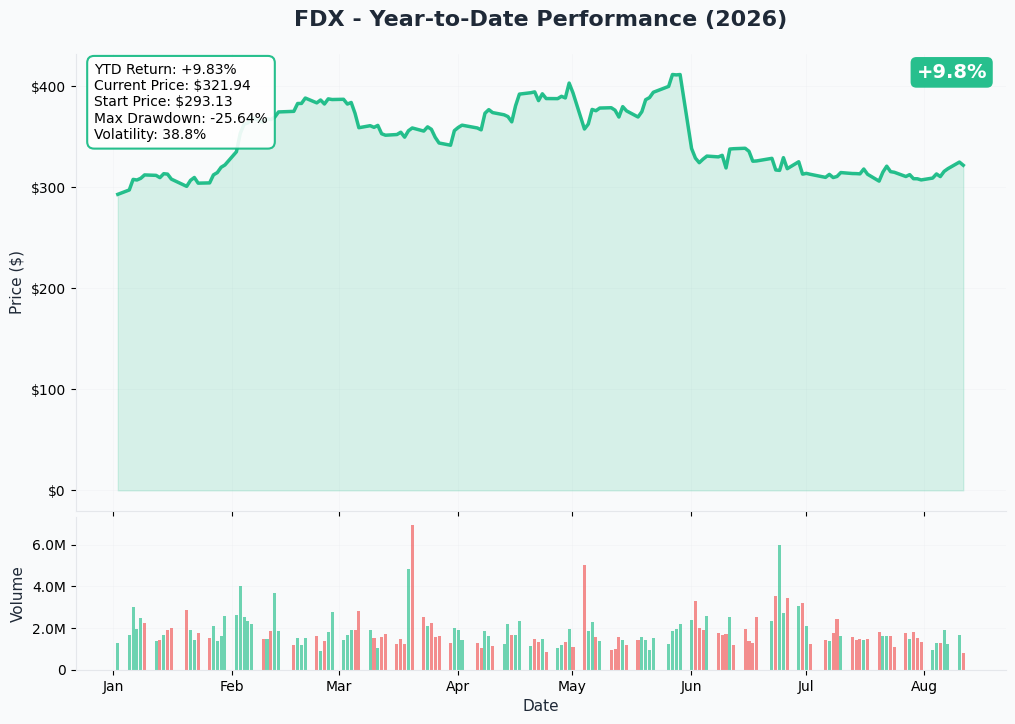
FDX has spent seven weeks chopping in a roughly $305–$325 band since the June 23 guidance-miss selloff, without reclaiming its spin-adjusted 2026 high of $345.37 set two weeks before that report. The $330 strike sits right at the top edge of that congestion shelf.
Gamma Support & Resistance
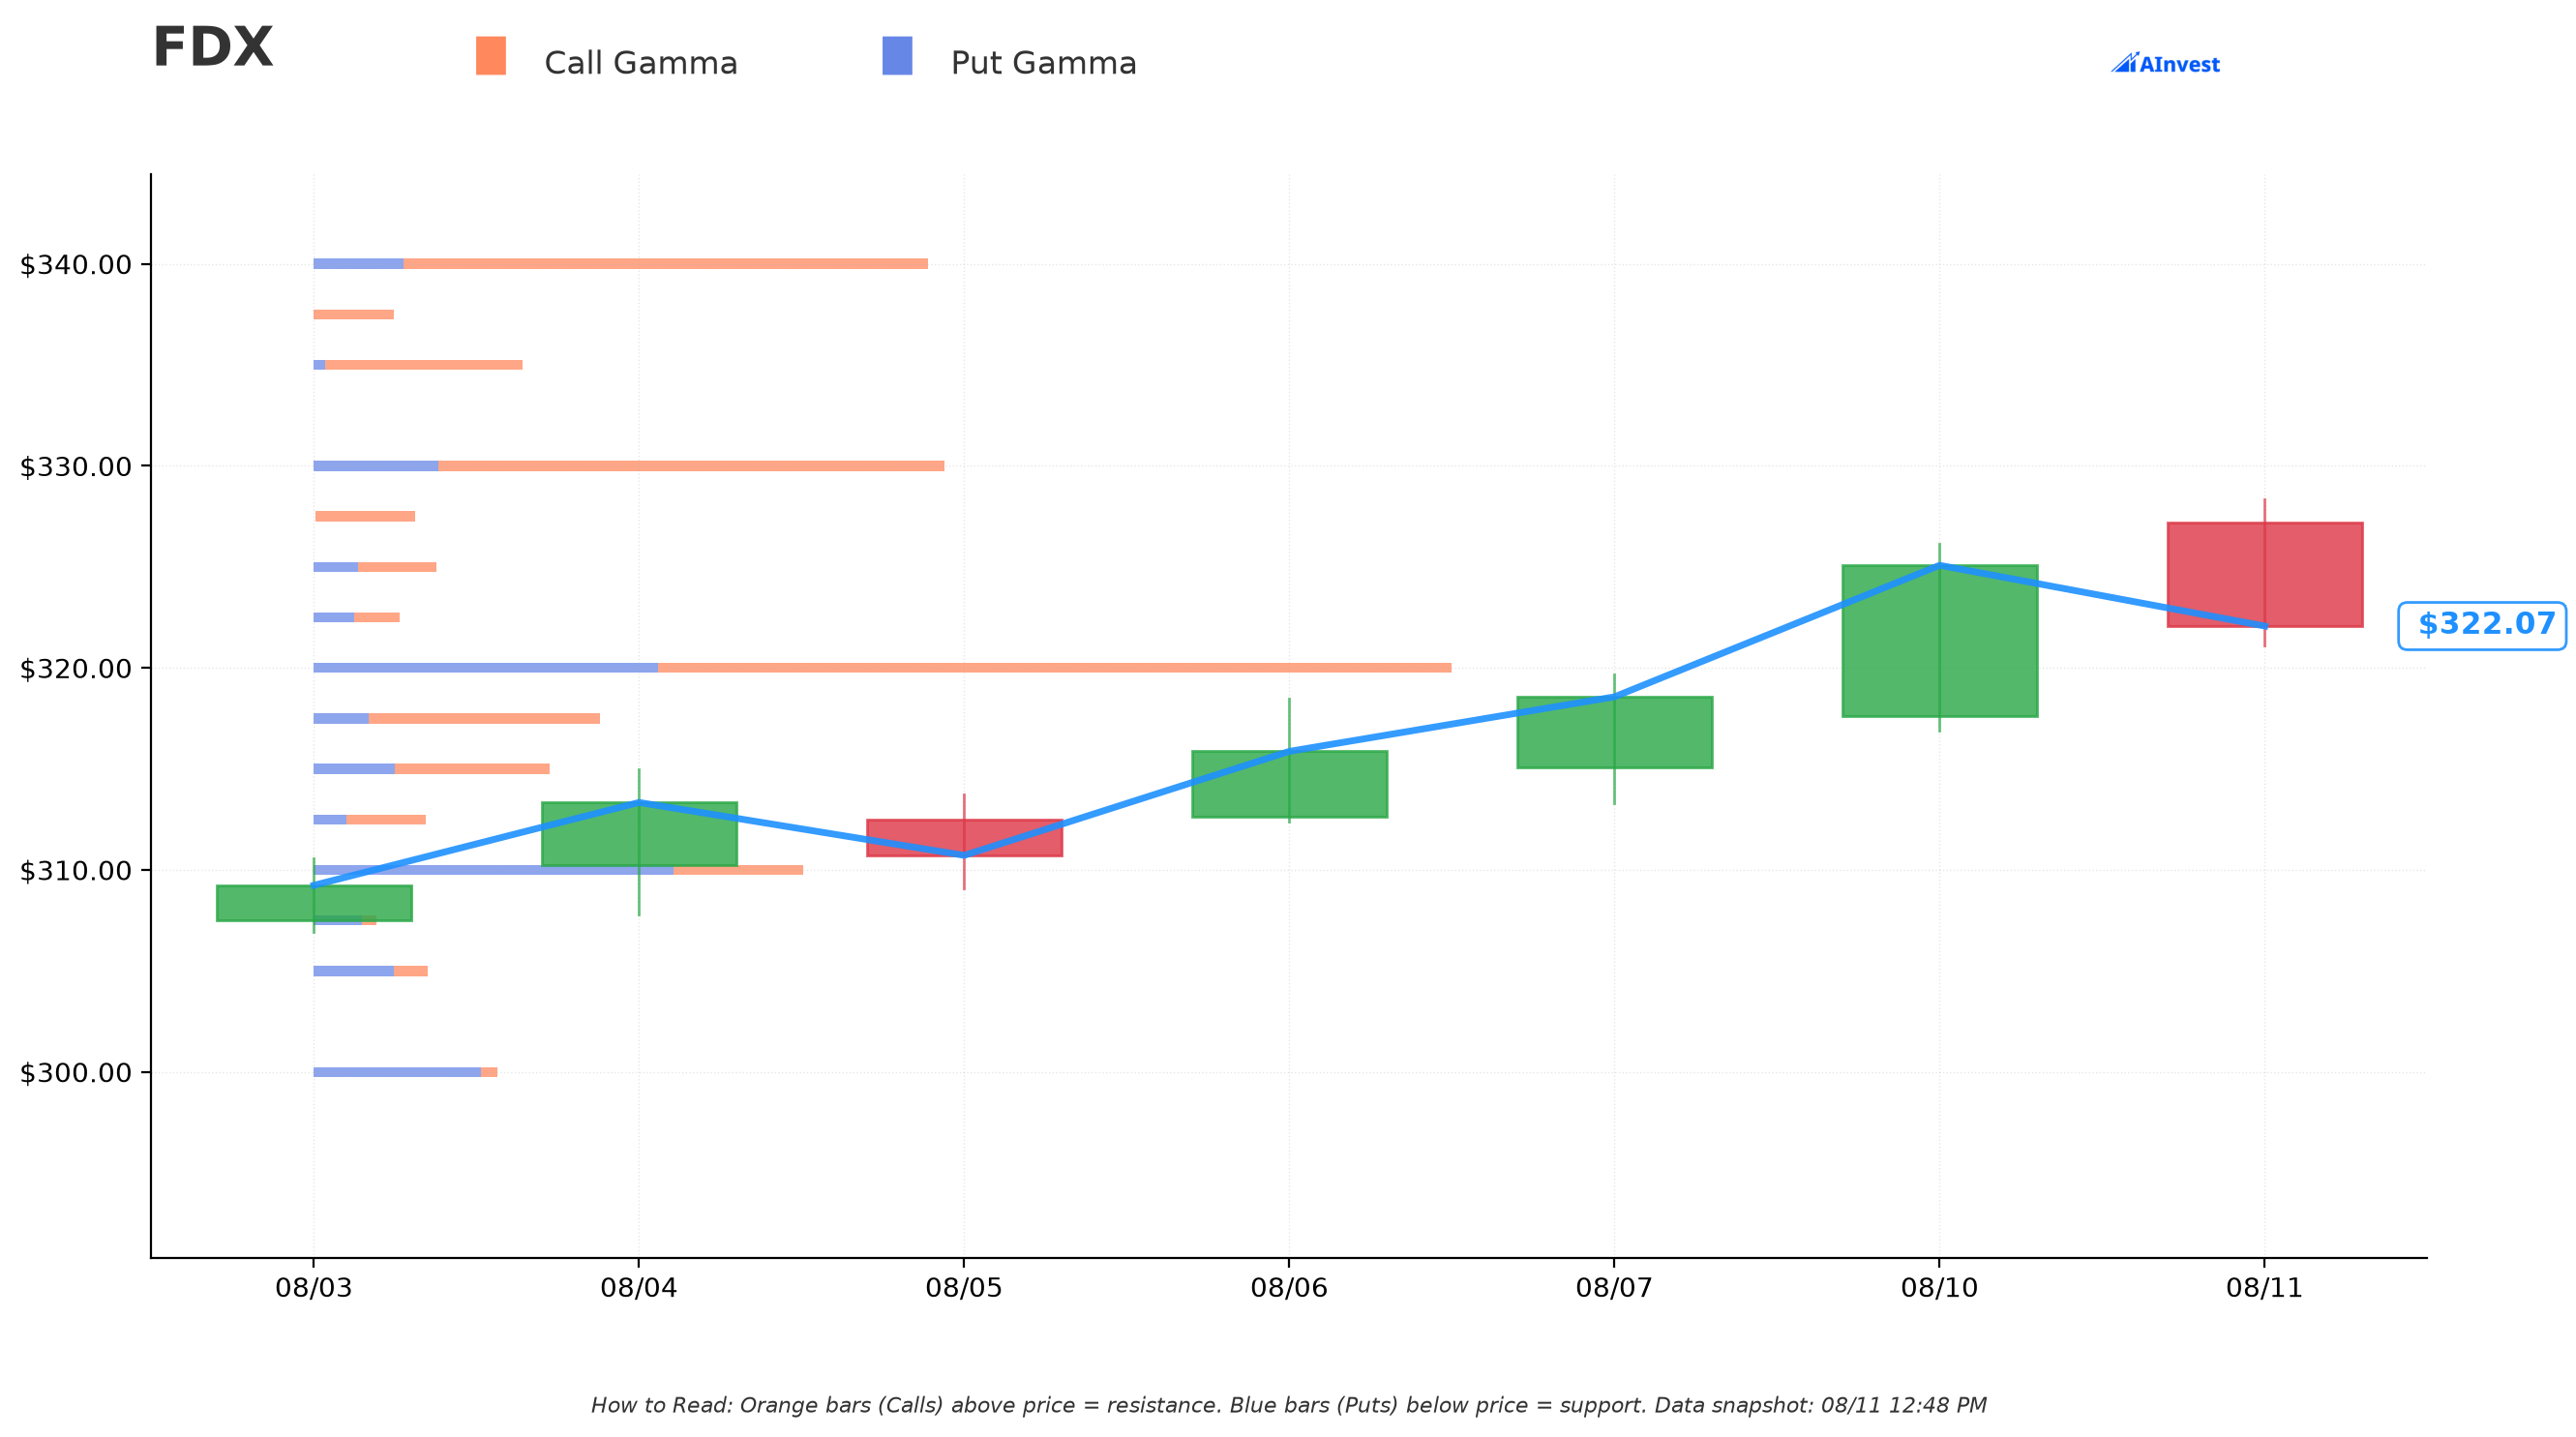
Reading the gamma exposure by strike (current spot ≈$322.09 at the time of the gamma snapshot):
- 🔵 Nearest support: $310 — total gamma ≈1.00, and it's put-dominant (put_gex 0.73 vs. call_gex 0.26), the clearest put wall below spot. A deeper floor sits at $300 (total gamma ≈0.37, also put-led).
- ⚪ The magnet: $320 — the single largest gamma concentration on the whole chain, total gamma ≈2.31, sitting essentially right on top of spot. That's the level price tends to gravitate toward absent a real catalyst.
- 🟠 Resistance exactly where this trade lives: $330 — total gamma ≈1.28, call-dominant (call_gex 1.03 vs. put_gex 0.25). This is meaningfully the second-largest gamma wall on the board, and it sits precisely at the strike this seller chose. Whether that's foresight or coincidence, it means dealer hedging flows are already building a real ceiling right where the short call needs price to stay under. A further wall sits at $340 (total gamma ≈1.24, also call-led).
Implied Move
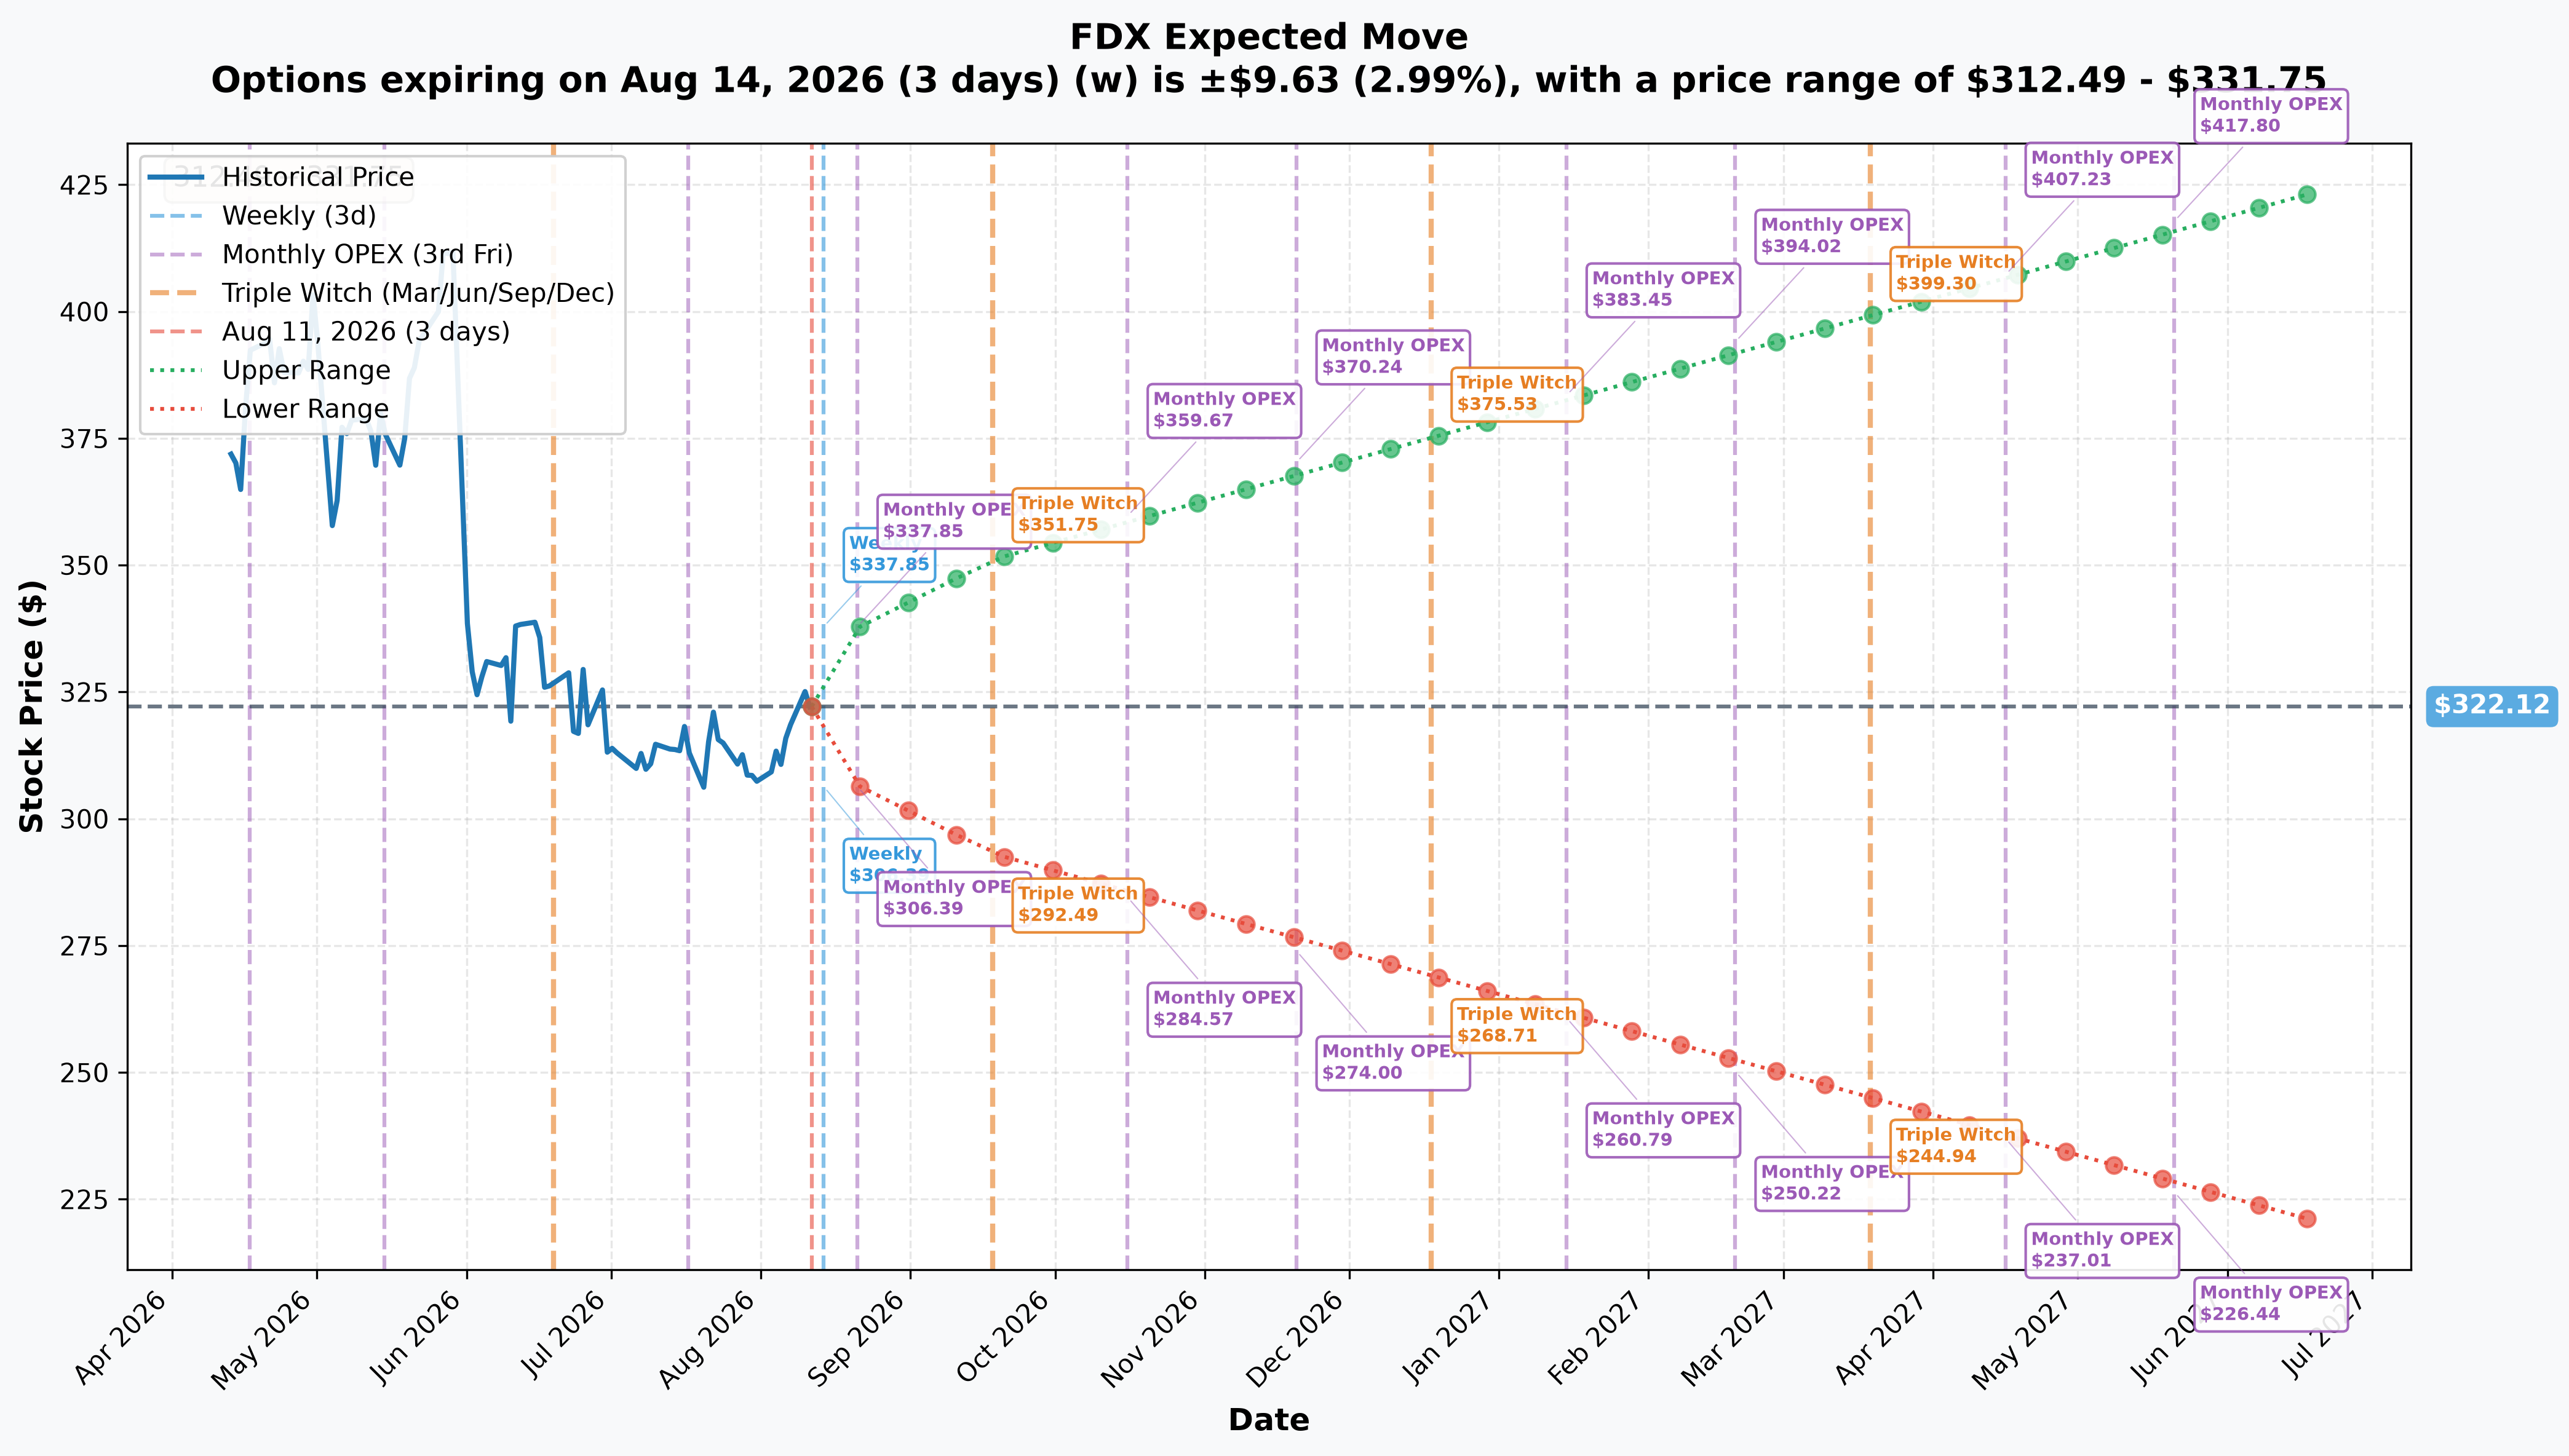
For the exact September 18, 2026 expiration this trade uses (38 days to expiry): implied move is ±9.03%, ±$29.10, putting the one-standard-deviation range at $293.02 – $351.22.
Worth sitting with: $330 is only $4.74 away from the $325.26 flow-time spot — just ≈16% of the full $29.10 implied move. That means this is not a deep, low-probability strike sold far outside the market's own expected range; it sits well inside the implied-move envelope, closer to the middle of the cone than the edge. A genuinely large FedEx move — the kind the market is already pricing as plausible over 38 days — would carry price straight through $330 and keep going. That's the honest risk math a premium seller (or anyone considering following this trade) needs to hold next to the "no earnings in this window" framing above.
For context, the nearer-dated implied moves: weekly (Aug 14, 3 DTE) ±2.99% / ±$9.63 ($312.49–$331.75); monthly OPEX (Aug 21, 10 DTE) ±4.88% / ±$15.73 ($306.39–$337.85).
🎪 Catalysts
🚩 Read this first — the September earnings date most calendars show is wrong
The September 18, 2026 expiration does not contain a FedEx earnings report, and this is the single most important fact for reading this trade. FedEx's board approved a change of its fiscal year end from May 31 to December 31, effective for the period beginning June 1, 2026 (Q4 FY2026 earnings release; Form 8-K). There is no June–August quarter report in the new schedule — FedEx's next quarterly earnings call is Wednesday, October 28, 2026, at 4:30 PM CT, company-confirmed on FedEx's own investor relations calendar and its IR home page, and corroborated by stockanalysis.com's statistics page. That's ≈40 days after this option expires.
Several widely used earnings calendars are still running FedEx's old May-fiscal pattern and get this wrong. MarketBeat's FDX earnings page, for example, shows "Next Earnings Date: Thursday, September 17, 2026 (estimated)" and separately mis-states the last report date — its underlying data is stale. Anyone treating this September expiration as an earnings play, in either direction, is pricing a risk that the fiscal-year change already removed for 2026.
Recent (last three months)
- June 1, 2026 — FedEx Freight spin-off completed. One FDXF share per two FDX shares; FedEx retained 19.9% (completion release).
- June 23, 2026 — Q4 FY2026 results. Revenue $25.0B beat, adjusted EPS $6.31 vs. ≈$5.92–$5.95 consensus — a beat. But calendar-2026 guidance of $16.90–$18.10 adjusted EPS landed well below the ≈$19.50 street number, and shares fell 3.63% in the regular session and a further 6.16% after hours (earnings release; reaction coverage).
- June 24–26, 2026 — analyst targets cut $100–$116, but every firm kept its Buy rating. Stifel ($442→$326), UBS ($445→$350), TD Cowen ($426→$354), Truist ($425→$365) all trimmed targets to reflect Freight leaving the earnings base; Bank of America actually raised its target ($376→$378) (MarketBeat price-target history).
- July 22–23, 2026 — 2026 peak-season surcharges announced, higher than 2025 across most categories, with the Ground Residential demand surcharge rising to $0.80/package from $0.65 (+23%) (Supply Chain Dive).
- July 29, 2026 — Weiss Ratings downgraded FDX from Buy (B−) to Hold (C+), the lone downgrade in the window.
In-window (before Sept 18, 2026 expiration)
- ≈September 7–9, 2026 — estimated quarterly ex-dividend, ≈$1.22. Not yet declared as of today; inferred from the September 8, 2025 and September 9, 2024 ex-dates (dividend history). This is the one concrete calendar event that plausibly falls inside this option's life, and it drives the early-assignment risk discussed above.
Just outside the window
- September 28, 2026 — annual meeting of stockholders (10 days after expiration).
- September 28, 2026 — first peak-surcharge effective date for Additional Handling, Oversize and Ground Unauthorized surcharges (10 days after expiration).
- October 28, 2026 — Q3 calendar-2026 earnings, ≈40 days after expiration, the real information event this trade is deliberately expiring ahead of.
🎲 Four Ways to Read This
🚀 YOLO Trader
Buying the same $330 calls this seller just sold would mean paying up to bet on a break above $330 inside a window with no earnings catalyst to force it — a much harder setup than betting on a name with a print in the window. If you want direct upside exposure into the strike zone, the $340 gamma wall (total gamma ≈1.24) is the next visible ceiling above $330, and the implied move already prices a plausible path to ≈$351 by expiration. This is a low-catalyst-density window; a pure momentum long here is betting on drift and macro/trade-policy headlines (tariffs, de minimis rulings, competitor news), not a scheduled event.
📈 Swing Trader
The stock has been range-bound $305–$325 for seven weeks with $320 acting as the dominant gamma magnet and $310 as the nearest real support. A swing approach here means trading the range rather than betting on a breakout: fade strength into the $320–$330 gamma-wall zone, respect $310 on the downside, and treat the $330 strike itself as the level that's now attracting real institutional hedging flow, not just a round number.
💰 Premium Collector
This is functionally the trade already on the tape, and the logic is legible: sell calls into a quiet 38-day window with no earnings, collect $9.76 per contract (≈2.96% of the $330 notional, which annualizes to roughly high-20s% if repeated — a number that only makes sense if you're comfortable being assigned). Two things temper the "easy income" framing: the strike sits well inside the implied-move envelope (only ≈16% of the full $29.10 expected move away), so this is not a deep, low-probability OTM sale — and the ≈September 7–9 ex-dividend creates real early-assignment risk if the stock is above $330 heading into it. If you're doing this against stock you already own, know your assignment price; if you're doing it naked, size for genuinely open-ended risk above ≈$339.76.
🌱 Beginner
A short call means someone collected money today in exchange for a promise: if FDX is above $330 by September 18, they may have to sell shares at $330 even if the stock is much higher. The $9.76M premium is the most they can make; the potential loss, if this is not backed by shares already owned, has no fixed ceiling. Before doing anything with this information, understand that selling options — especially uncovered — carries risk that can exceed the premium collected, and this kind of trade is generally not appropriate as a first options position. If you're newer to options, a defined-risk approach (like a call spread, where losses are capped) is a more forgiving way to express the same view.
⚠️ Honest Limits
- This was captured as a single-leg block cross. The dominant print (cond family: single-leg cross, 127-type) carries no paired option leg by definition. The full day's tape shows 11 separate crosses in this contract totaling 10,085 contracts of volume — our analysis anchors to the dominant 10,000-lot block at 10:32:19, which is the one that moves the open-interest math.
- Covered vs. naked cannot be determined from the options tape. OPRA does not show whether the seller holds the underlying shares. That single fact changes this from an income overlay to an open-ended short bet, and we cannot resolve it from the data available.
- A block cross has a known counterparty, but not a visible motive. Because it's negotiated off the lit book, there's no NBBO aggressor signal (%-across) to read direction from the way there would be on a lit sweep — the open/close read here comes entirely from size vs. prior OI, not from where it printed relative to the bid/ask.
- The ≈September 7–9 ex-dividend date is an estimate, not a declared date. FedEx had not announced its September 2026 dividend as of today.
- Broker identity, customer identity, and any hedge in the stock or elsewhere in the option chain are invisible to this data. What OPRA proves is size, price, timing, and open-interest change — nothing about who is on the other side or why.
- This is analysis of public options-market data, not investment advice. Options trading involves substantial risk, including the potential loss of more than the amount invested for uncovered short positions, and may not be suitable for every investor.
Last updated: 2026-08-12 (pre-market) — the next-day OPRA open-interest snapshot confirmed the open. Sep-18 $330C 640 → 10,669 (+10,029 against a 10,000-lot sale): OPEN (STO), 29 contracts above the published ≈10,640 and with no transfer absorption. No thesis, title or tone changes were required; the ⏳ callout was replaced with the ✅ RESOLVED box.