🛡️ GDX $18.2M Resolved: Not a Clean Debit Spread — the $75 Puts Opened, the $67 Shorts Never Did
📅 2026-08-05 | 🔥 Unusual Activity Detected
🔄 Updated 2026-08-06 pre-market — the two provisional legs resolved, and they took the branch this article flagged as the alternative. We wrote that if the $67 legs were new opening shorts, December $67 open interest would jump toward ≈92,432 and November toward ≈89,359 — and that if OI instead fell, "the package is really an unwind/roll on the $67 side layered under two fresh $75 longs, not a clean new spread." Both fell: December $67 −1,193 and November $67 −17,278. The opening-short reading is ruled out. What the desk is left holding is long $75 puts with an uncapped payout, not a defined-risk $8-wide spread. See the ✅ RESOLVED box below.
🎯 The Quick Take
Right in the middle of GDX's biggest single-day pop in a long time, one order routed four put legs across two expirations — November and December 2026 — for a $18,199,440 net debit. On the day it looked like two clean put debit spreads (buy the $75 put, sell the $67 put), a defined-risk hedge on VanEck Gold Miners ETF (GDX) capped at $8 of value per share.
The next-day open interest says it is not that. The two $75 put buys were confirmed as large fresh opens, exactly as expected. But the two $67 put sales created no new open interest at all — November's $67 line lost 17,278 contracts and December's lost 1,193. A leg that is opening a new short position makes open interest rise; these did the opposite or stayed flat.
Read together, this is far better described as a roll of protection upward — existing $67 puts being sold out of, with much larger $75 put positions opened above them. That is still a hedge, and it still costs $18.2M. But the surviving position is long $75 puts with an uncapped payout, which is a more bearish and more valuable shape than the $8-capped spread the day-of tape suggested.
🏢 What Is GDX?
GDX is the VanEck Gold Miners ETF — the largest, most liquid gold-and-silver-miner fund on the market. Quick stats:
- 💰 AUM: $23.66B, market cap $25.47B — MarketBeat
- 📊 Holdings: 67 companies, expense ratio 0.51% — StockAnalysis
- 🏆 Top weights: Newmont (NEM) 10.37%, Agnico Eagle (AEM) 10.12%, Barrick Mining (ABX) 8.01%, Wheaton Precious Metals (WPM) 5.56%, Franco-Nevada (FNV) 5.12% — StockAnalysis
- 🎯 Mandate: market-cap-weighted basket of global gold and silver mining companies — StockAnalysis
- ⭐ Analyst rating: Moderate Buy — MarketBeat
Top 10 holdings = 58.30% of the fund — this is a concentrated basket, not a diversified proxy for the gold price. NEM + AEM alone are ≈20.5% of the ETF, so a single mine outage or guidance cut at either name can move the whole thing.
💰 The Option Flow Breakdown
📊 What Just Happened
At 11:03:05 ET, with GDX trading at $83.84, one order worked through the tape as a multi-leg auction — a facilitated exchange price-improvement mechanism where a broker gets a complex, multi-leg order matched at a better price than the plain bid/ask. This is not a negotiated block cross and not a lit sweep taking the displayed book; it's a worked order across four legs and two expirations.
| Time (ET) | Buy/Sell | Call/Put | Expiration | Premium | Strike | Volume | Prior OI | Size | Spot | Option Price | Option Symbol |
|---|---|---|---|---|---|---|---|---|---|---|---|
| 11:03:05 | 🟢 BUY | PUT | 2026-12-18 | $19,135,494 | $75 | 45,000 | 10,712 | 44,919 | $83.84 | $4.26 | GDX20261218P75 |
| 11:03:05 | 🔴 SELL | PUT | 2026-12-18 | $8,804,124 | $67 | 45,000 | 47,513 | 44,919 | $83.84 | $1.96 | GDX20261218P67 |
| 11:03:05 | 🔴 SELL | PUT | 2026-11-20 | $6,737,850 | $67 | 44,000 | 45,889 | 43,470 | $83.84 | $1.55 | GDX20261120P67 |
| 11:03:05 | 🟢 BUY | PUT | 2026-11-20 | $14,605,920 | $75 | 44,000 | 4,243 | 40,572 | $83.84 | $3.60 | GDX20261120P75 |
🏷️ Flow tag: Multi-leg auction (facilitated, worked complex order — not a block cross, not a lit sweep)
The economics:
- Gross premium changing hands: $49.28M across all four legs
- Net debit paid: $18,199,440 — this is the real capital at risk, not the gross number
- Package delta: ≈−1,028,645 shares of GDX-equivalent exposure — a meaningfully bearish/hedging tilt
- December $75/$67 legs cost ≈$2.30 net per share; November ≈$2.05 net
- ⚠️ The "max value $8.00" figure originally shown here has been withdrawn. An $8.00 cap only exists if the $67 legs opened new short puts, and the resolving open interest shows they did not. See the ✅ RESOLVED section below.
✅ RESOLVED — the OI Double-Check Is In, and the Spread Reading Did Not Survive It
Updated 2026-08-06 pre-market. The ≈06:30 ET OPRA open-interest snapshot (reflecting the August 5 close) has published.
| Leg | Baseline OI (Aug-5 snap) | Resolving OI (Aug-6 snap) | Δ | Print size | Δ as % of print | Day vol | Verdict |
|---|---|---|---|---|---|---|---|
| Dec-18 $75 P (bought 44,919) | 10,712 | 53,051 | +42,339 | 44,919 | ≈+94.3% | 46,668 | ✅ OPEN (BTO) — as published |
| Nov-20 $75 P (bought 40,572) | 4,243 | 48,653 | +44,410 | 40,572 | ≈+109.5% | 45,129 | ✅ OPEN (BTO) — as published |
| Dec-18 $67 P (sold 44,919) | 47,513 | 46,320 | −1,193 | 44,919 | ≈−2.7% | 46,584 | ↔️ FLAT — opening-short ruled out |
| Nov-20 $67 P (sold 43,470) | 45,889 | 28,611 | −17,278 | 43,470 | ≈−39.7% | 45,077 | 🔄 NET CLOSE (≥40%) — INVERSION |
The $75 legs confirmed decisively. Both opened at or above the full print size — 42,339 new December contracts and 44,410 new November contracts. There is no ambiguity: this desk now owns roughly 85,000 long $75 puts across the two expirations that it did not own on August 4.
The $67 legs refute the spread reading. We published the exact numbers that would confirm opening shorts: December toward ≈92,432 and November toward ≈89,359. Neither happened, and neither came close. A short put being opened forces open interest up; November's fell by 17,278 and December's edged down 1,193. So whatever these sales were, they were not the creation of a new short-put position.
What the two $67 legs each do and don't prove:
- November ($67, −17,278) is a proven net close. At least 17,278 contracts were extinguished on both sides. Roughly 40% of that sale was demonstrably closing something that already existed.
- December ($67, −1,193) is a flat transfer, and genuinely ambiguous. Flat open interest means one side opened while the other closed, in equal measure. That is consistent with the desk opening a short against a departing long, and equally consistent with the desk selling out of a long it owned to an incoming buyer. Open interest cannot separate those two. What it does rule out is the clean both-sides-open case.
The structural consequence. The published framing — two put debit spreads, max value $8.00, defined risk — required the $67 legs to be new shorts. They are not, in November, and are unproven in December. The reading the data supports is the one this article named as the alternative: a roll up in protection. The desk appears to have been sitting on a large long $67 put position (both lines had been parked at ≈45,900 and ≈47,500 contracts for weeks, untouched), sold a chunk of it, and used the proceeds toward ≈85,000 long puts fourteen percent higher up the strike ladder at $75.
Why that matters to the payoff. A $75/$67 debit spread stops gaining below $67 and is worth at most $8.00 per share. An outright long $75 put keeps gaining all the way down. If the roll-up reading is right — and it is the reading the open interest supports — this position is not capped, and the $18.2M net debit buys a materially larger downside payoff than the article originally described.
The honest limit. Open interest proves contracts were extinguished at November $67 and proves nothing was created at either $67 strike. It does not prove which side this desk was on, and it cannot see the rest of its book. The roll-up is our inference from the geometry, the multi-week stability of the prior $67 open interest, and the matched sizes — graded likely, not proven.
One more wrinkle worth flagging honestly: the November legs don't match 1:1 — 43,470 $67 puts were sold against only 40,572 $75 puts bought, a gap of ≈2,898 contracts. That's not a clean, symmetric spread on the November leg; a small slice of the short $67 puts isn't matched by a long $75 put in that expiry. The December legs, by contrast, are a clean 44,919-for-44,919 match.
🤓 What This Actually Means — Plain English
Forget "someone is betting GDX crashes." That's not what this is. Here's the mechanism in plain terms:
First, the structure we thought this was. A put debit spread means buying a put and selling a cheaper put below it to offset the cost. Buying the December $75 put outright costs $4.26 per share ($19.1M for 44,919 contracts) and pays dollar-for-dollar for every point GDX falls below $75. Selling the December $67 put for $1.96 recovers $8.8M, cutting the net cost to $2.30 per share ($10.3M) — but, if that sale opens a new short, it also caps the payout at $8.00 per share, the distance between the strikes. That is the trade-off a debit spread makes: cheaper entry, bounded payout.
Second, what the open interest says actually happened. The $67 sales did not open new shorts — November's line shrank by 17,278 contracts and December's did not grow. You cannot cap a payoff with a short you never established. The cash flows are unchanged ($8.8M and $6.7M really were collected), but the mechanism was different: this looks like the desk selling out of puts it already owned at $67 to help fund a much larger long-put position at $75.
Why the distinction is worth your attention. Selling a put you own is closing a position; selling a put you don't own is opening an obligation. The first leaves you with nothing below $67 — no cap, no risk, no exposure. The second leaves you short a put that eats into your gains below $67. The desk here ends up in the first case: it owns roughly 85,000 long $75 puts across two expirations, and those keep paying all the way down. The "defined-reward" description in the original write-up understated what this position can earn in a serious miner drawdown.
The same structure was built again in November, slightly cheaper at $2.05 net, with the wrinkle noted above (a bit more $67 sold than $75 bought).
Why does this read as a hedge, not a directional crash bet?
- The payout zone is a range, not a cliff. Max profit only happens if GDX is at or below $67 at expiration — between $75 and $67, the spread pays out partially, and above $75, both spreads expire worthless and the buyer just loses the $2.05–$2.30 they paid.
- The strikes sit right on the fund's own gamma walls. $75 and $67 aren't random numbers — see the gamma section below.
- The most that can be lost is the $18.2M paid, not "the stock goes to $0" money. That ceiling on risk is the hallmark of a hedge or a disciplined tactical bet, not a leveraged crash wager.
A trader (or a fund with GDX-linked exposure elsewhere — maybe a long position in miners, mining equities, or a gold-adjacent portfolio) paid $18.2M for protection against a 10.5% to 20% pullback in gold miners between now and mid-December, right after the sector just ripped 7% higher in a single session.
📈 Technical Setup
YTD Chart
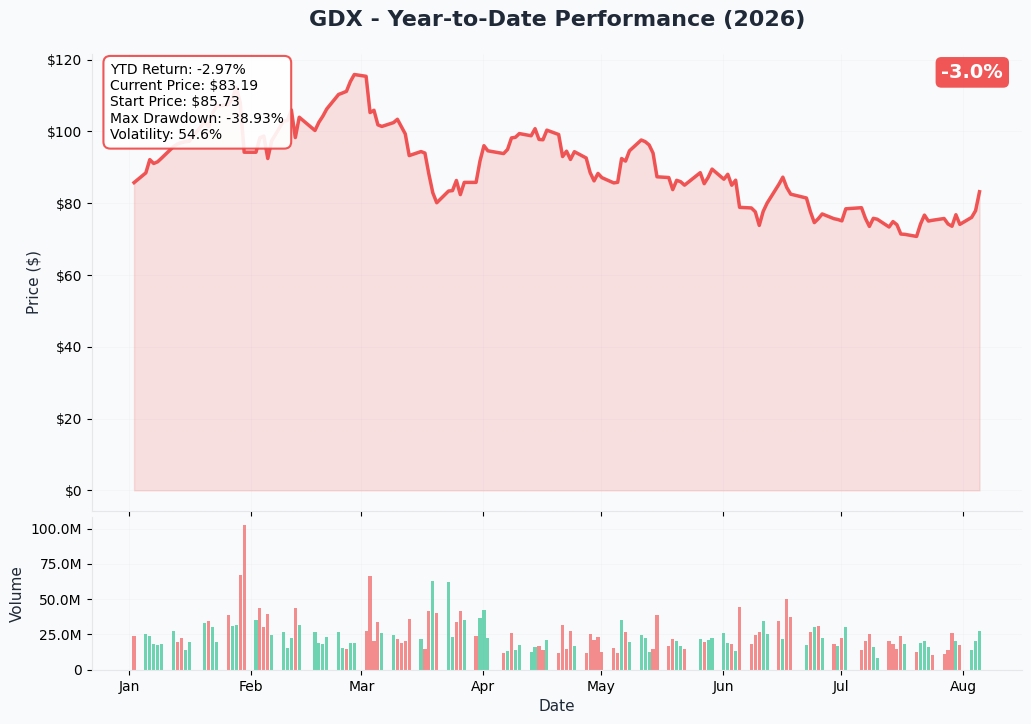
GDX has been a genuinely wild ride this year — the 52-week range spans $56.34 to $117.18, a swing of more than 2×, and MarketBeat shows the fund actually down 2.7% year-to-date from $85.77 despite a strong year for gold itself — a reminder that miners have not been a smooth pass-through vehicle for the metal in 2026. Today's +7.14% move to $83.48 sits well inside that range, not at a fresh high.
Gamma-Based Support & Resistance
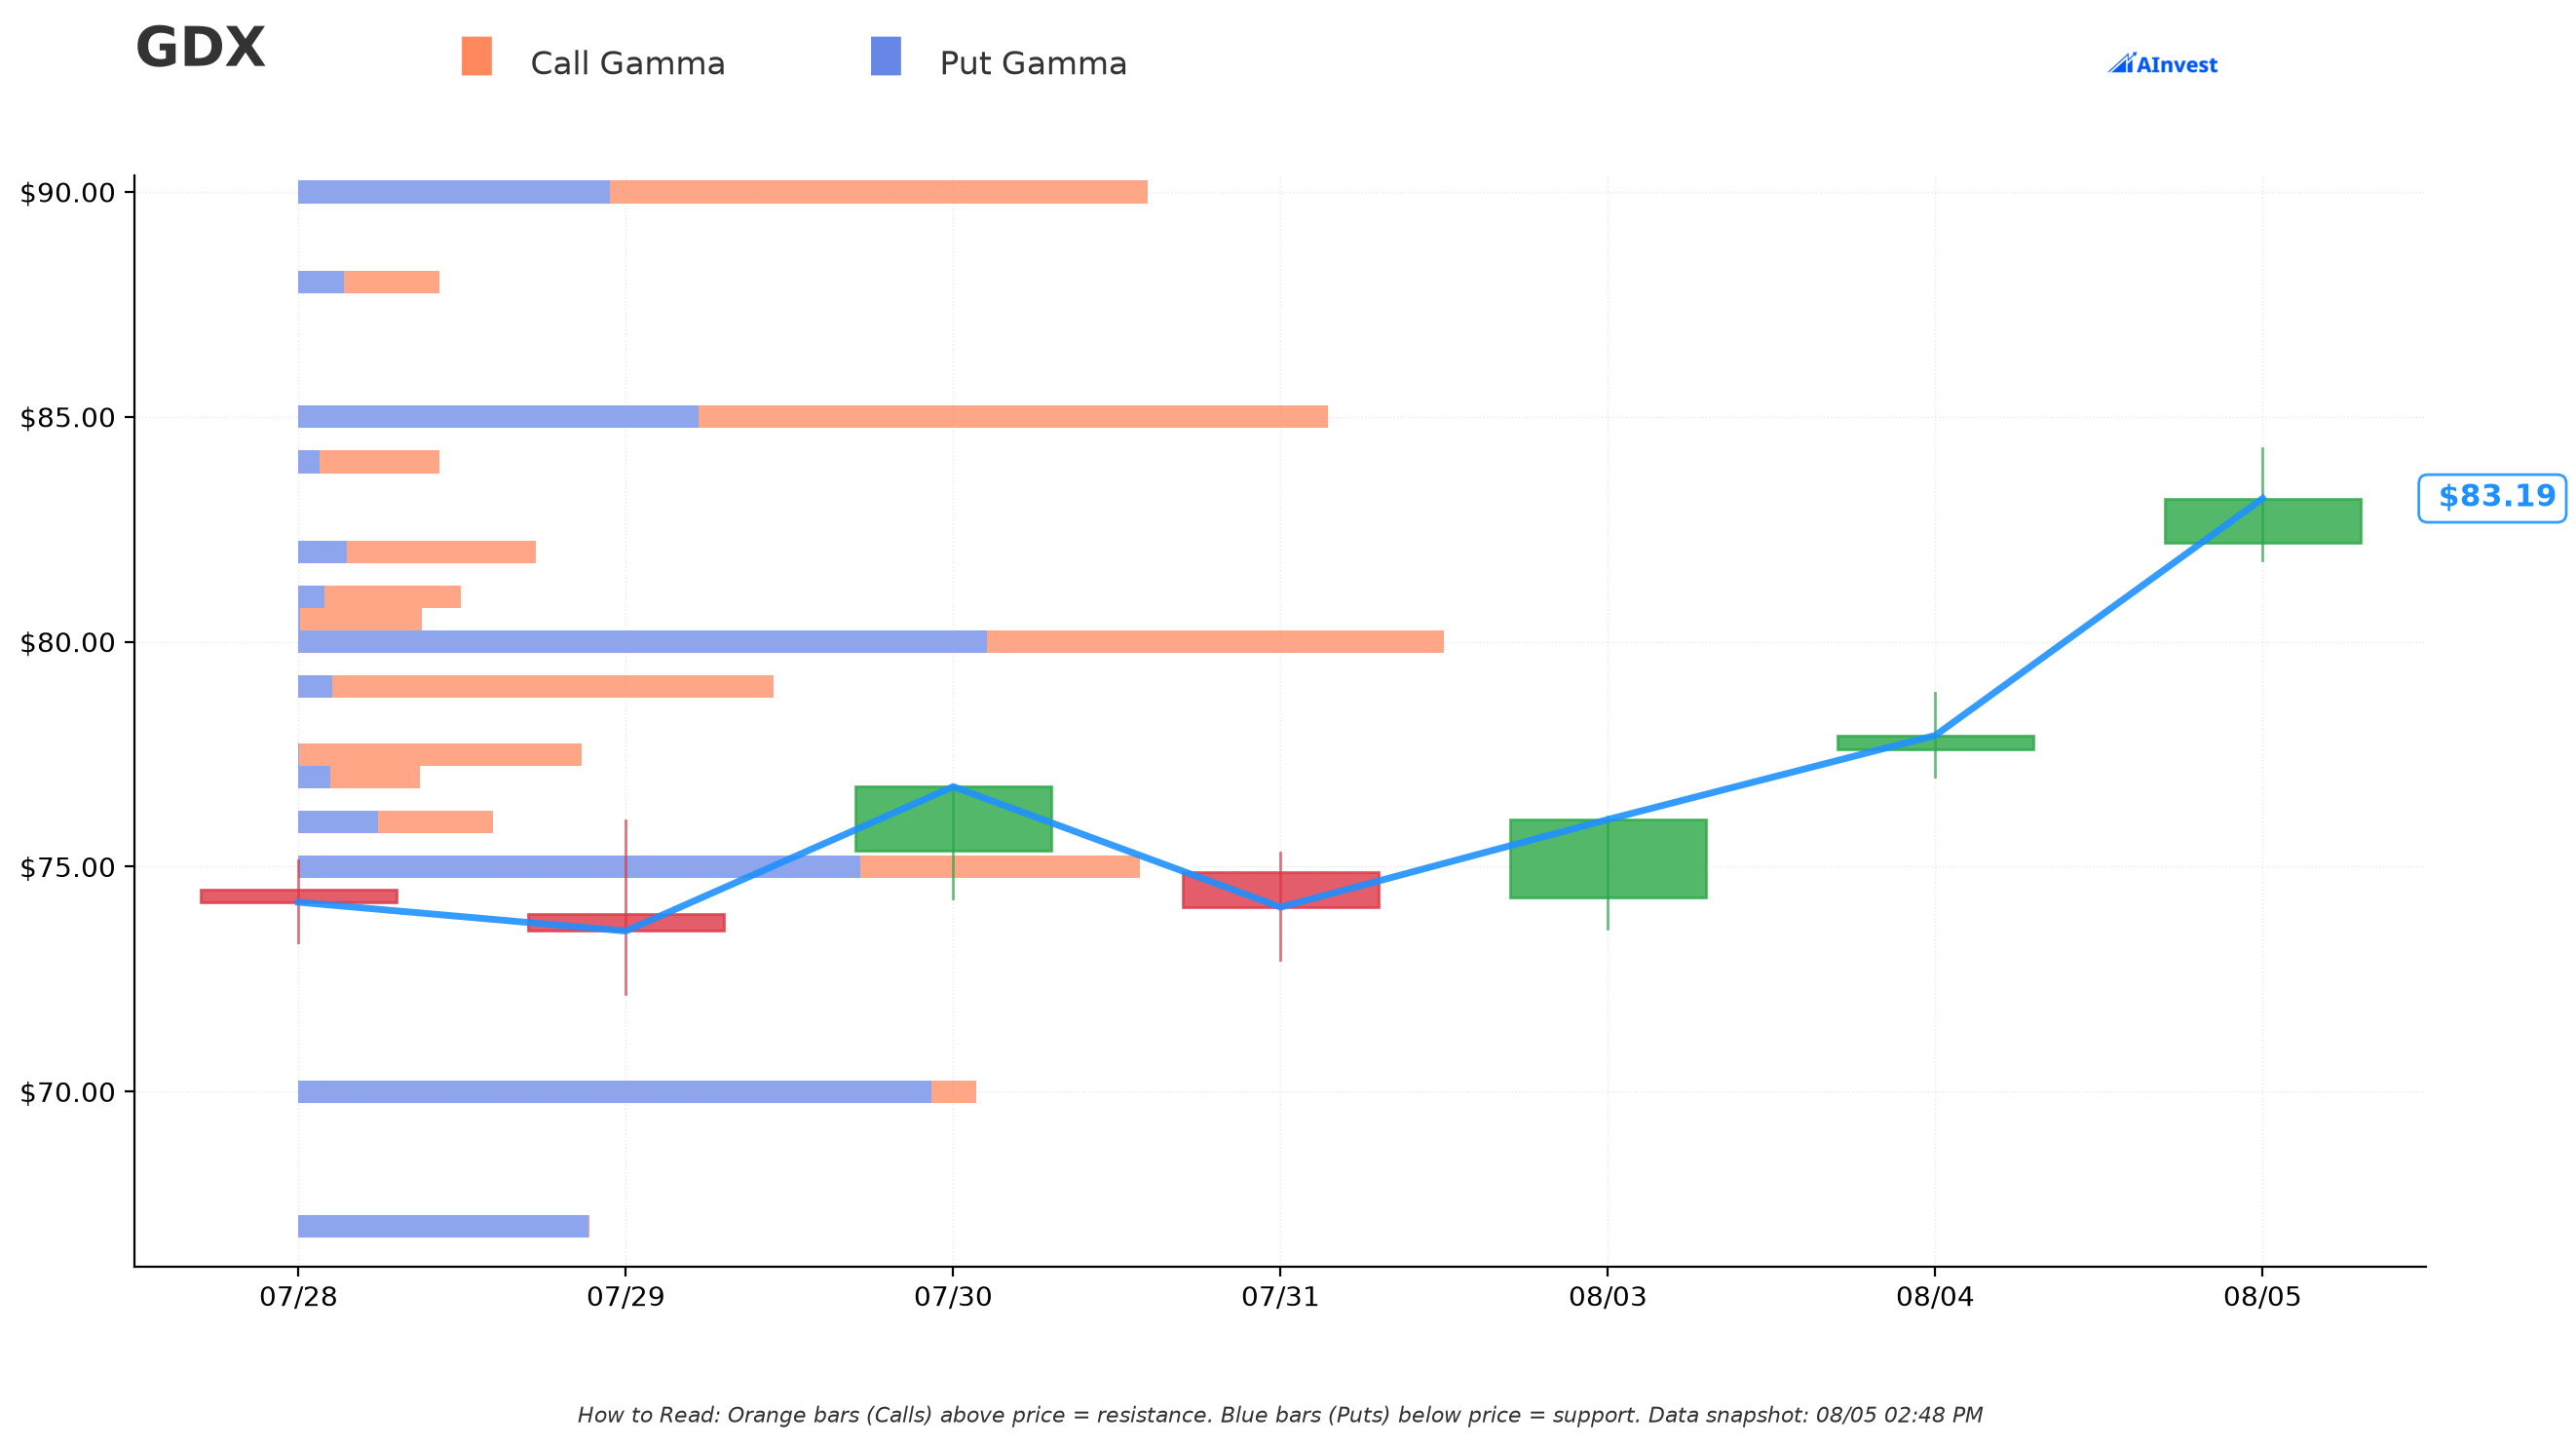
Pulling the real dealer-gamma levels from the option chain (spot referenced at $83.17):
- 🟠 Resistance wall at $85 — "Very Strong," only ≈2.2% above spot, net call-gamma dominant
- 🟠 Secondary resistance at $90 — ≈8.2% away
- 🔵 Support wall at $80 — "Very Strong," ≈3.8% below spot
- 🔵 Support wall at $75 — ≈9.8% below spot — this is the exact long-put strike in both spreads.
- 🔵 Support wall at $67 — ≈19.4% below spot — this is the exact short-put strike in both spreads.
That last part matters. The trader didn't pick $75 and $67 at random — those are already meaningful dealer-hedging levels in the GDX chain. $75 is where put gamma starts to build (14.2 call-gex vs. 21.4 put-gex at that strike), and $67 is a standalone support wall of its own (9.0 total gamma, almost entirely put-side). The spread is effectively structured "gamma wall to gamma wall."
Implied Move
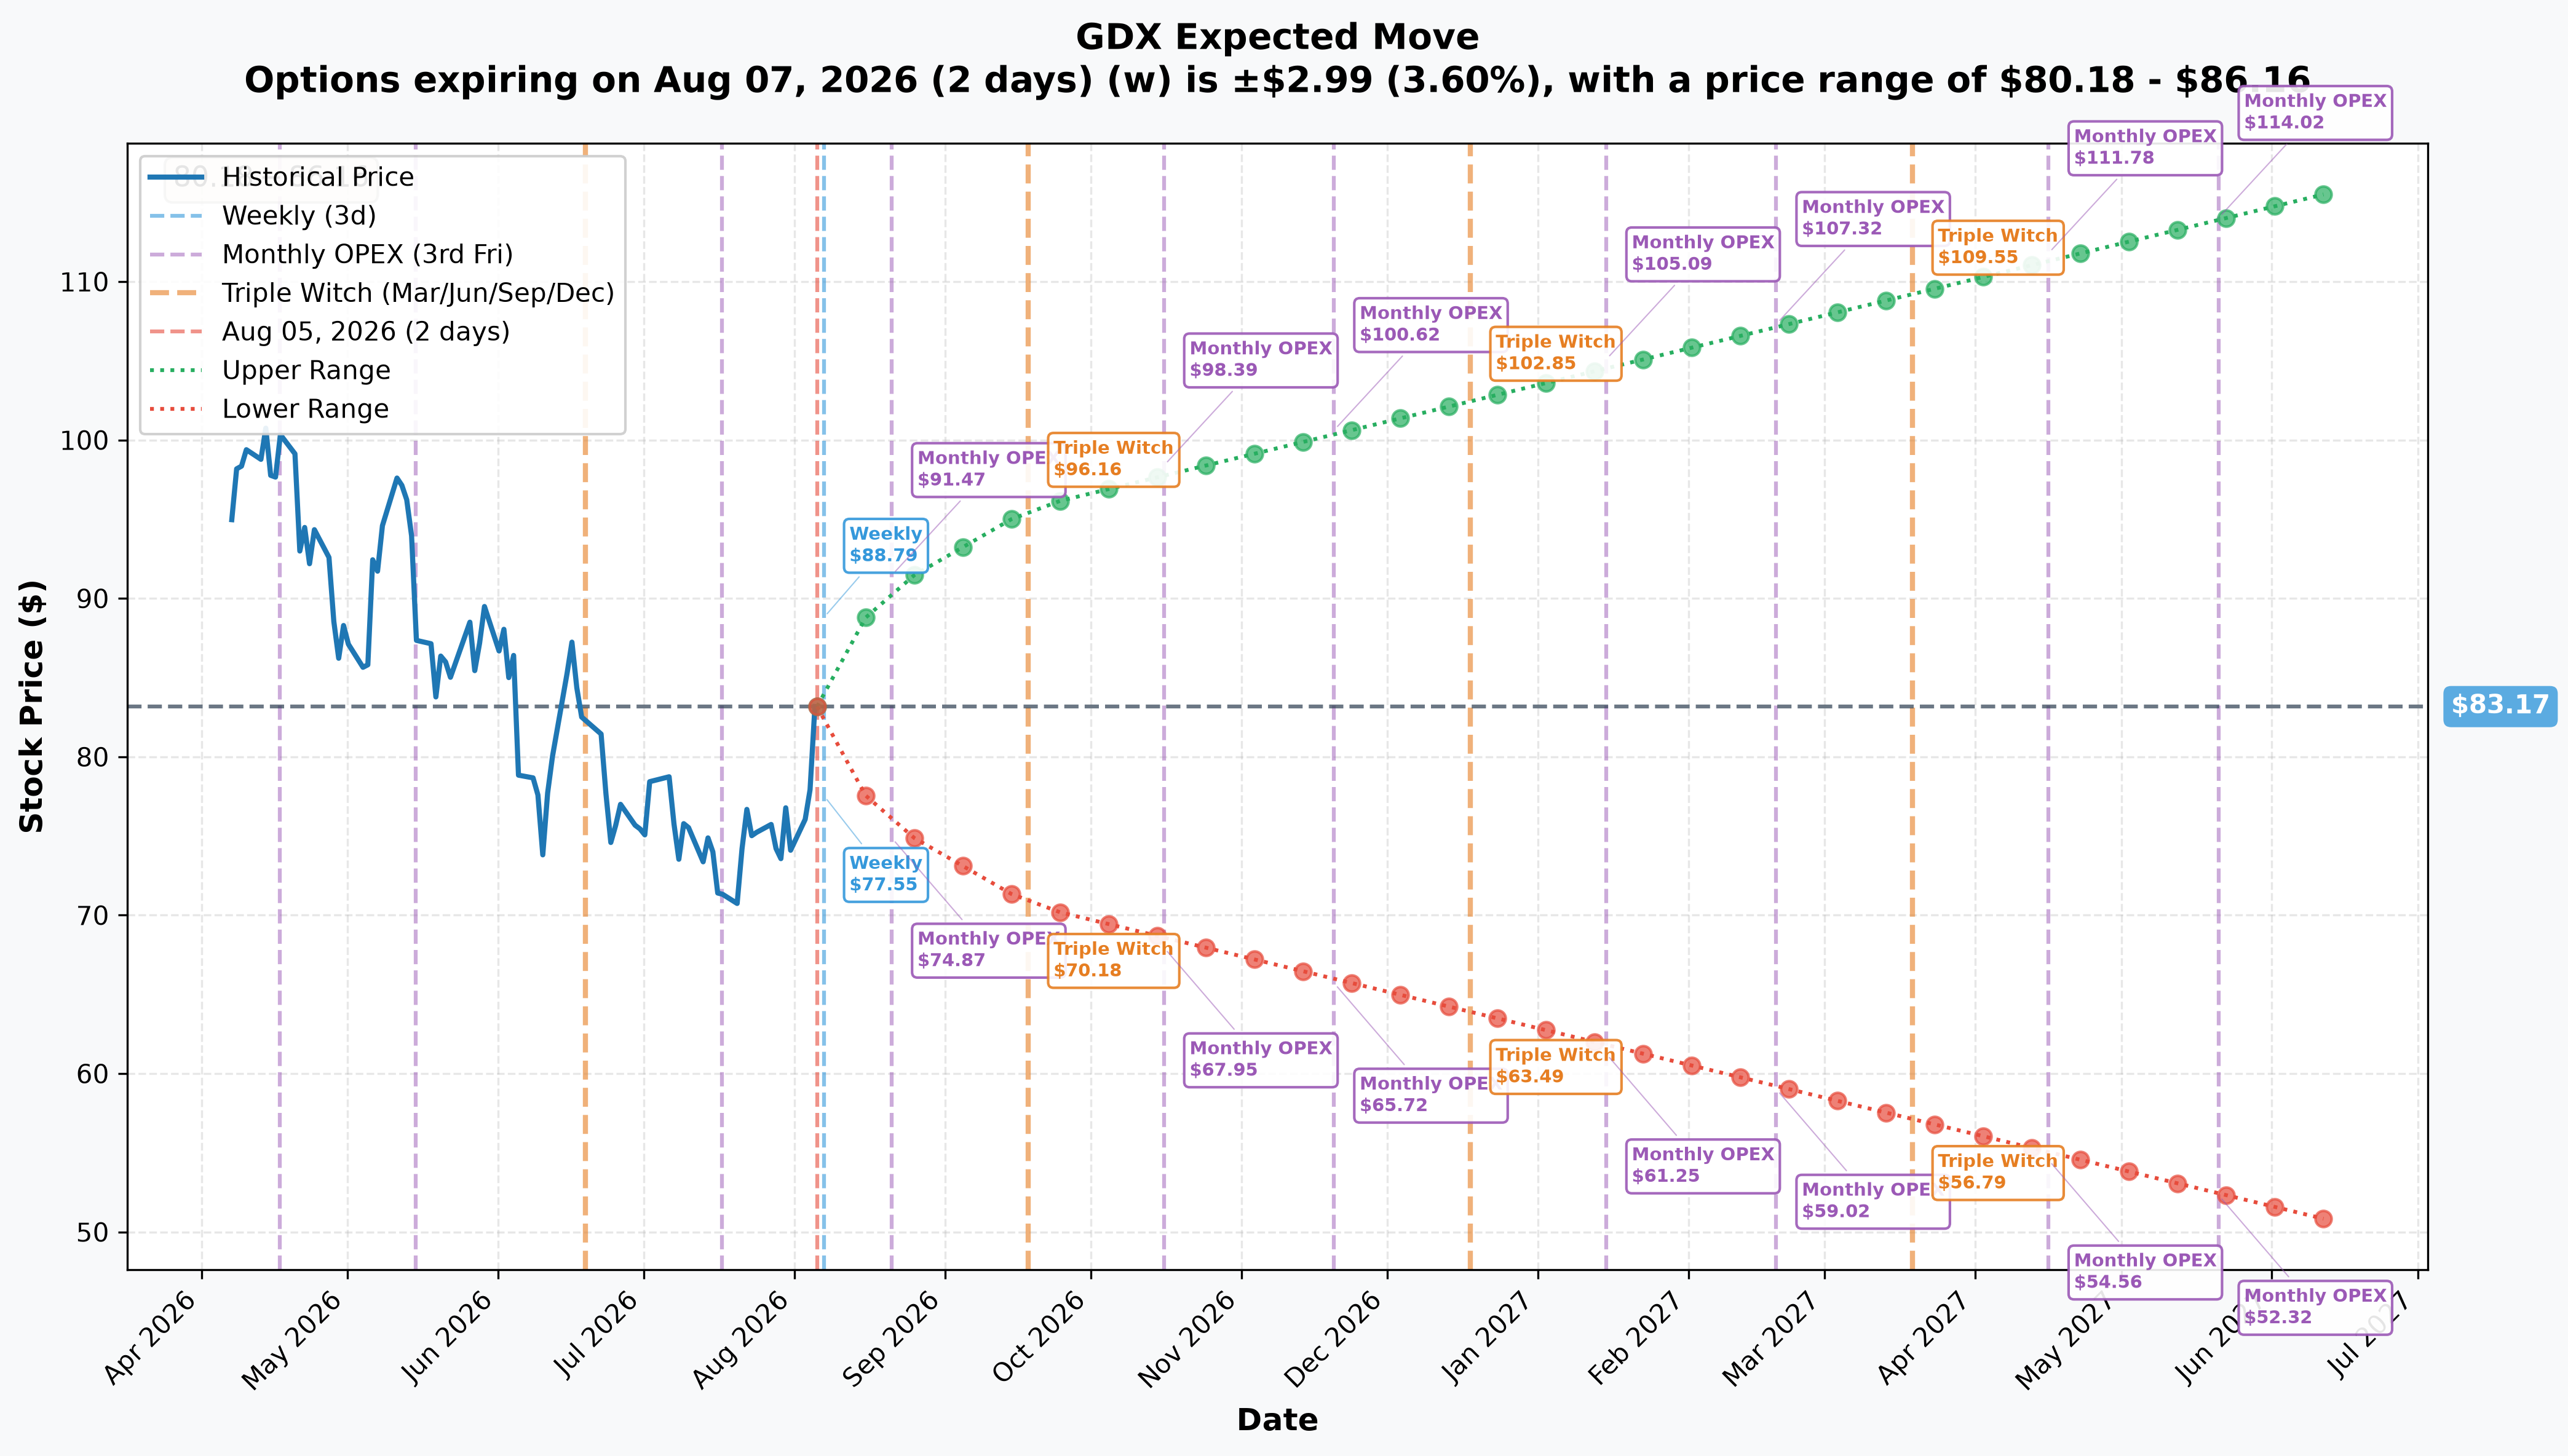
Reading the real numbers out of the option chain's implied volatility (spot $83.17):
| Expiry | Days | Implied Move | Range |
|---|---|---|---|
| Weekly (Aug 7) | 2 | ±3.6% | $80.18 – $86.16 |
| Monthly OPEX (Aug 21) | 16 | ±9.13% | $75.58 – $90.76 |
| Quarterly triple witch (Sep 18) | 44 | ±15.07% | $70.63 – $95.71 |
| Nov 20 OPEX (matches this trade's Nov leg) | — | — | $65.72 – $100.62 |
| Dec 18 triple witch (matches this trade's Dec leg) | — | — | $63.49 – $102.85 |
This is the useful comparison: by the November 20 expiry, the option market's own one-standard-deviation lower bound is $65.72 — already below the $67 short strike. By December 18, it's $63.49 — again below $67. In other words, the market is already pricing a move down to (and past) $67 as squarely within a normal expected range, not a tail event. This trade is buying protection for outcomes the option chain considers plausible, not far-fetched — which is exactly what you'd expect from a hedge rather than a lottery ticket.
🎪 Catalysts
✅ Already Happened
- Newmont (NEM, 10.37% weight) Q2 2026 — reported July 23, 2026. Net income $8.60B (+37% YoY), EPS $7.90 (+42.3% YoY), adjusted EBITDA $3.8B, free cash flow $2.2B — StockAnalysis. NEM trades at $104.21 today (+6.48%), consensus Buy, price target $129.27.
- Agnico Eagle (AEM, 10.12% weight) Q2 2026 — reported July 29, 2026. Record quarterly free cash flow and record shareholder returns — StockAnalysis. AEM trades at $163.98 (+8.88%), consensus Buy, target $214.98.
- July 29, 2026 FOMC held rates at 3.50%–3.75% on a 9–3 vote — and this is the detail that matters most for this trade: three members (Beth Hammack, Neel Kashkari, Lorie Logan) dissented in favor of a quarter-point HIKE, not a cut — Federal Reserve.
- Today's rally (Aug 5) is being attributed to soft ADP data (44k private jobs, below expectations) cooling Fed-hike bets — Kitco News. Gold is bid at $4,259.30/oz (+4.48%), silver at $62.10/oz (+4.53%) — Kitco. GDX's +7.14% move is roughly 1.6× gold's move today — the operating-leverage relationship in action.
- Bank of Korea launched a long-term domestic gold buying program — Kitco News, an ongoing structural bid rather than a one-off event.
📅 Upcoming — Confirmed Dates
The FOMC calendar is the key forward risk for this position, and it's important to be precise here: this is a hiking debate, not a cutting one, given three sitting dissents in favor of a hike on July 29.
| Meeting | Dates | Dot plot? | Falls inside which leg of this trade? |
|---|---|---|---|
| September FOMC | Sept 15–16, 2026 | Yes | Both Nov 20 and Dec 18 legs |
| October FOMC | Oct 27–28, 2026 | No | Both Nov 20 and Dec 18 legs |
| December FOMC | Dec 8–9, 2026 | Yes | Only the Dec 18 leg |
Source: Federal Reserve 2026 FOMC calendar — the Fed's own caveat is that each date is "tentative until confirmed at the meeting immediately preceding it." All three dates land before their respective monthly options expiration, so both spreads are exposed to a live hike/hold decision with a dot plot attached (September for both legs; December additionally for the December-expiry leg).
- AEM ex-dividend: September 1, 2026 — StockAnalysis, annual dividend $1.80 (1.10% yield).
🔮 Upcoming — Estimated, Not Yet Confirmed
- Q3 2026 miner earnings, likely late October 2026. This is inferred from the Q2 cadence (NEM reported July 23, AEM reported July 29) — neither company has published a confirmed next date. Treat as an estimate.
- September rate-decision direction is genuinely two-sided: three July dissenters wanted a hike, but today's soft-ADP framing is described as "cooling" those bets — no verified numeric probability is available for this session.
🎲 Price Targets & What the Levels Say
Combining the gamma walls and the implied-move ranges:
- Bull case / base case ceiling: the $85 gamma resistance wall, reinforced by the weekly implied-move upper bound of $86.16 and the monthly OPEX upper bound of $90.76. A close above $85 would put GDX into the $90 secondary resistance zone.
- Base case: price gravitating around the current $80–$85 gamma pocket, which is also inside every implied-move range shown above.
- This trade's payout floor: the $67 short-put strike is a standalone gamma support wall in its own right, and sits inside both the November ($65.72–$100.62) and December ($63.49–$102.85) implied-move ranges — meaning the option market already treats a move down to $67 as a plausible, non-extreme outcome by either expiry.
🧑🤝🧑 Four Ways to Read This
🚀 YOLO Trader: You're probably not going to replicate a 44,919-lot institutional position, and note that the resolution showed the institution is not in the capped spread you'd be copying — it holds outright long $75 puts. If you think miners are due to cool off after a +7.14% single-day pop, a small December $75/$67 put debit spread still costs roughly $2.30 per share ($230 per contract) with a hard cap on loss — far cheaper and safer than shorting the ETF outright or buying naked puts into elevated post-spike implied volatility. Just know you'd be taking the capped version of a bet the whale is running uncapped.
📈 Swing Trader: Watch the $80 and $75 gamma walls over the next 1–2 weeks. A fade back toward $80 after today's spike would be unsurprising given how far GDX ran versus its own 52-week range; a break and hold below $75 is where this hedge starts paying real money and would also validate a broader "catch-up trade is over, back to consolidation" thesis.
🛡️ Premium Collector: After a +7.14% day, implied volatility is almost certainly elevated across the chain — this is a better environment to be selling premium than buying it outright. A short-dated call spread above the $85/$90 resistance zone, or a cash-secured short put well below $67 (where this trade's own protection ends), lets you collect rich premium while respecting the same levels this $18.2M trade is using.
🌱 Beginner: The single most important takeaway here is the difference between a bet and a hedge. This trade cannot lose more than $18.2M, and it only makes real money if GDX falls 10.5%–20% by expiration — it is not a "GDX is going to zero" wager. If you're new to spreads: buying one put and selling a cheaper put below it is how professionals cap both their cost and their potential loss, at the price of also capping their potential gain. It's a training-wheels way to express a bearish view without unlimited risk.
⚠️ Honest Risk & Limits — What the Tape Cannot Prove
- We don't know who's on the other side of this or why. OPRA data cannot tell us the broker, the customer's identity, whether this is a hedge against an existing long-miner or long-gold position, or whether there's an offsetting stock or futures position we can't see. It reads like a hedge based on structure (defined-risk, spread not outright, timed right after a spike), but that's an inference, not proof.
- The $67 legs are genuinely unresolved. As covered above, size ≤ prior OI on both $67 legs means we cannot rule out that part of this package is closing existing short-put or long-put exposure rather than opening new shorts. That materially changes the read — a closing trade there would mean the "clean spread" story is incomplete.
- The November mismatch (43,470 sold vs. 40,572 bought, a ≈2,898-contract gap) means the November leg isn't a textbook 1:1 spread on the full size — some of that short $67 exposure isn't hedged by a long $75 put in this print.
- This is a hedge signal, not a price prediction. GDX could rally straight through $85 and $90 and this position simply expires worthless, costing the buyer the $18.2M premium — that is the defined, known-in-advance maximum loss. (Maximum loss is unchanged by the OI resolution; maximum gain is what changed, from capped to uncapped.)
- The $67 legs resolved against the spread reading, and one of them is still ambiguous. November $67 is a proven net close (−17,278). December $67 was flat (−1,193), which rules out a clean opening short but cannot distinguish a desk opening a short against a departing long from a desk selling out of a long to an incoming buyer. The roll-up interpretation is inferred from geometry and the multi-week stability of the prior $67 open interest — likely, not proven.
- Concentration and cost-inflation risk in the underlying fund itself (NEM+AEM ≈20.5% of GDX, no verified all-in-sustaining-cost data) are real risks to the ETF independent of this options flow.
🎯 The Bottom Line
Here's the deal: somebody paid $18.2M for downside protection on gold miners on the same day GDX ripped 7.14%, roughly 1.6× gold's own move. On the day it presented as two tidy $75/$67 put debit spreads. The resolving open interest showed something more interesting: the $75 puts are a genuine, very large new long position (≈85,000 contracts across November and December), while the $67 sales created no new short-put exposure at all. This is a hedge being moved up the strike ladder, not a fresh capped spread — and the position it leaves behind pays all the way down, not just to $67.
The strikes still line up almost exactly with GDX's own gamma support walls, and the option market's implied-move ranges already treat a slide to $67 as a normal, plausible outcome by either expiry — this isn't a tail bet, it's a well-placed hedge against the sector giving back a chunk of the day's gains before the September FOMC dot plot (and, for the December leg, the December dot plot too) has its say.
If you're bullish on miners: nothing here changes the earnings picture — NEM and AEM just posted very strong Q2 numbers with double-digit upside price targets. This flow is protection, not a prediction the rally is over.
If you're cautious after a +7% day: this is exactly the kind of level-aware, capital-efficient hedge to study — timed around real dated catalysts (Sept 15–16 and Dec 8–9 FOMC), with a maximum loss known in advance. And it is a useful reminder that the shape of an institutional position often can't be read off the print alone: the same four legs described a capped spread on Wednesday and an uncapped long-put roll on Thursday, once open interest arrived.
The OI update on the two provisional $67 legs is in — neither opened a new short (November −17,278, December −1,193), which is what reframed this from a capped spread into a roll of protection up to $75. From here, watch the $80/$75 gamma zone into the September 15–16 FOMC dot plot.
This article covers unusual options activity for informational purposes only and is not investment advice. Options trading involves substantial risk, including the potential loss of the entire premium paid, and is not suitable for all investors. Past option flow does not predict future price movement — trade your own plan and risk tolerance.
Last updated: 2026-08-06 (pre-market) — next-day OPRA open interest resolved all four legs. Both $75 put buys confirmed opening (Dec +42,339, Nov +44,410). Both $67 put sales failed to create open interest (Dec −1,193, Nov −17,278), ruling out the opening-short reading and with it the "defined-risk $8-wide debit spread" framing. Title, lead, economics, plain-English section, trading ideas, risk factors and bottom line were corrected to describe a roll of protection up from $67 to $75.