🔧 GFS $3.81M September-2027 Deep-ITM LEAP Call — But It Came With a Stock Leg Attached
📅 August 10, 2026 | 🔥 Unusual Activity Detected
🎯 The Quick Take
At 11:42:34 today, a desk crossed 1,450 GlobalFoundries September-17-2027 $30 calls for ≈$3.81M at $26.30, with the stock at $51.80. Before anyone gets excited about "an institution betting on GFS," here's the catch: this printed as a stock-plus-options package — the tape shows a paired leg in the equity market, negotiated off the open book as a single cross. That means the option piece by itself does not express a clean directional view; it's the signature of a financing or stock-substitute structure, not a speculative call buy. We'll walk through why, and what it does and doesn't tell us.
📊 Company Overview
GlobalFoundries (GFS) is a pure-play semiconductor foundry — it manufactures wafers for other companies but doesn't design or sell its own chips. Importantly, GF is not a leading-edge logic competitor to TSMC or Samsung Foundry: it exited the sub-14nm race back in 2018 and instead builds its business on specialty and mature-node process platforms — RF-SOI, FD-SOI, silicon-germanium, silicon photonics, GaN power, and embedded memory — plus a newer bet on quantum technology solutions.
- Sector / Industry: Technology / Semiconductors
- Market Cap: ≈$28.55 billion
- Current Price: ≈$52.02 (down ≈3.5% on the day)
- 52-week range: the stock's 2026 closing high was $89.67 on June 22, and it now sits ≈44% below that peak — this has been a violent round trip, not a steady climb. Up big into late June, then a 7-session slide that erased ≈$7.2 billion in market value in one stretch, followed by another 5-session leg down. The stock is up roughly 41% from where it started the year, but that YTD number hides just how much of the gain has already been given back.
💰 The Option Flow Breakdown
📊 What Just Happened
The Tape (August 10, 2026 @ 11:42:34):
| Time | Buy/Sell | Call/Put | Expiration | Premium | Strike | Volume | OI | Size | Spot | Option Price | Option Symbol | Order Type | Strategy |
|---|---|---|---|---|---|---|---|---|---|---|---|---|---|
| 11:42:34 | BUY | CALL | 2027-09-17 | $3.81M | $30 | 1,500 | 100 | 1,450 | $51.80 | $26.30 | GFS20270917C30 | BTO | Deep-ITM LEAP Call + Stock (delta-hedged / financing) |
🤝 BLOCK CROSS — with a paired stock leg. The tape confirms this printed as a stock+options cross (a manually negotiated block where a known counterparty took the other side, and the non-option piece rode along in the equity tape, not the options tape). This is deliberate position management by a desk, not an aggressive sweep lifting offers in the open market.
Note honestly: today's total day volume in this strike is 1,500 contracts, and this cross accounts for 1,450 of it — so roughly 50 contracts traded away from this block elsewhere. The block itself is what we're analyzing here.
✅ RESOLVED — The Open Confirmed, Almost Exactly on the Predicted Number
Updated 2026-08-11 pre-market. Resolving OPRA snapshot timestamped August 11 (reflects the August 10 close); baseline is the August 10 snapshot (reflects August 7 — before these prints).
| Leg | Baseline (Aug-10) | Resolving (Aug-11) | Δ | Print size | Δ as % | Day vol | Our published prediction | Verdict |
|---|---|---|---|---|---|---|---|---|
| Sep-17-2027 $30 call (bought) | 100 | 1,558 | +1,458 | 1,450 | +100.6% | 1,492 | ≈1,550 | ✅ OPEN (BTO) |
The prediction was ≈1,550; it printed 1,558. Open interest rose by 1,458 against a 1,450-lot purchase — slightly more than the print size, meaning every contract in this block created new open interest with a few extra added by other flow at the strike. We named the failure mode explicitly ("if OI instead barely moves, that would mean most of this was a transfer") and it did not occur.
The deep-ITM LEAP position is proven new. Whatever the motive behind it — the stock-substitute and financing readings discussed below both remain on the table — this is genuinely fresh exposure, not a repositioning of something that already existed.
🤓 What This Actually Means — Plain English
Let's decode this piece by piece, because the structure matters more than the headline dollar figure here.
It's a LEAP, and a deep one. The September 2027 expiration is ≈13.2 months away — this is a long-term equity anticipation security (LEAP), not a short-term trade. The $30 strike sits ≈$22 below the $51.80 stock price, which makes this call deep in the money.
Intrinsic vs. time value — do the math. Of the $26.30 paid per contract:
- ≈$21.80 is intrinsic value — money that exists purely because the stock is already above the strike. You'd get that value back even if GFS never moved another cent before expiration.
- ≈$4.50 is time value (extrinsic) — the actual "bet" portion, the premium paid for 13 months of optionality.
That's a roughly 83% intrinsic / 17% extrinsic split. Compare that to a typical out-of-the-money speculative call, where nearly 100% of the price is time value. This one is mostly just... stock, wrapped in an option contract.
Delta ≈0.9 — it moves almost like the shares. A deep-ITM call like this behaves close to one-for-one with the underlying stock. Owning 1,450 of these contracts is economically similar to owning ≈130,500 shares of GFS (1,450 × 100 × ≈0.9 delta) — except it ties up far less capital than buying that many shares outright. That capital efficiency is exactly why institutions use deep-ITM LEAPs as a stock substitute rather than a leveraged directional bet: you get most of the share-price exposure for a fraction of the cash outlay, while your maximum loss is capped at the premium paid.
But here's the part that changes the whole story: this printed as a stock-plus-options combo. The tape shows a paired leg in the equity market riding alongside this option block, negotiated together as one cross. That's the classic signature of a financing structure or a delta-hedged package — think: a bank facilitating a stock loan, a collar-like unwind, or a desk pairing a deep-ITM call against a stock position to manage risk or raise financing — not a directional speculator loading up on upside.
Why this matters for how you read it: when an option prints alone, buying a deep-ITM call is a reasonably clean way to say "I want long exposure with less capital at risk." When it prints with a paired stock leg, the net directional exposure of the whole package depends entirely on the size and side of that stock leg — which we cannot see from the options tape. It could be fully hedged (near-zero net exposure), partially hedged, or even structured to reduce exposure. Do not read this as "an institution is betting on GlobalFoundries." The honest read is: a desk executed a financing or stock-substitute package using a deep-ITM 2027 call, and the equity side of that trade is invisible to us.
📈 Technical Setup / Chart Check-Up
YTD Performance Chart
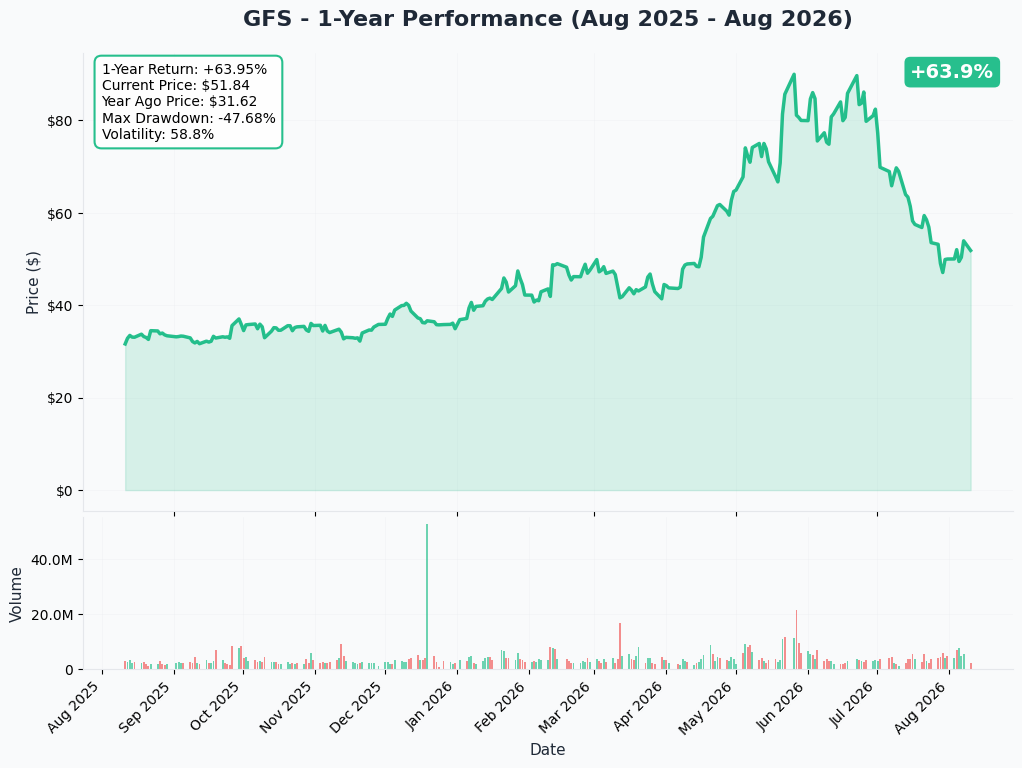
The chart tells the round-trip story plainly: a run to the $89.67 June 22 closing high, then a brutal give-back through July that took the stock into the $49–50 zone, where it's basically been consolidating into today's ≈$52.02.
Gamma-Based Support & Resistance Analysis
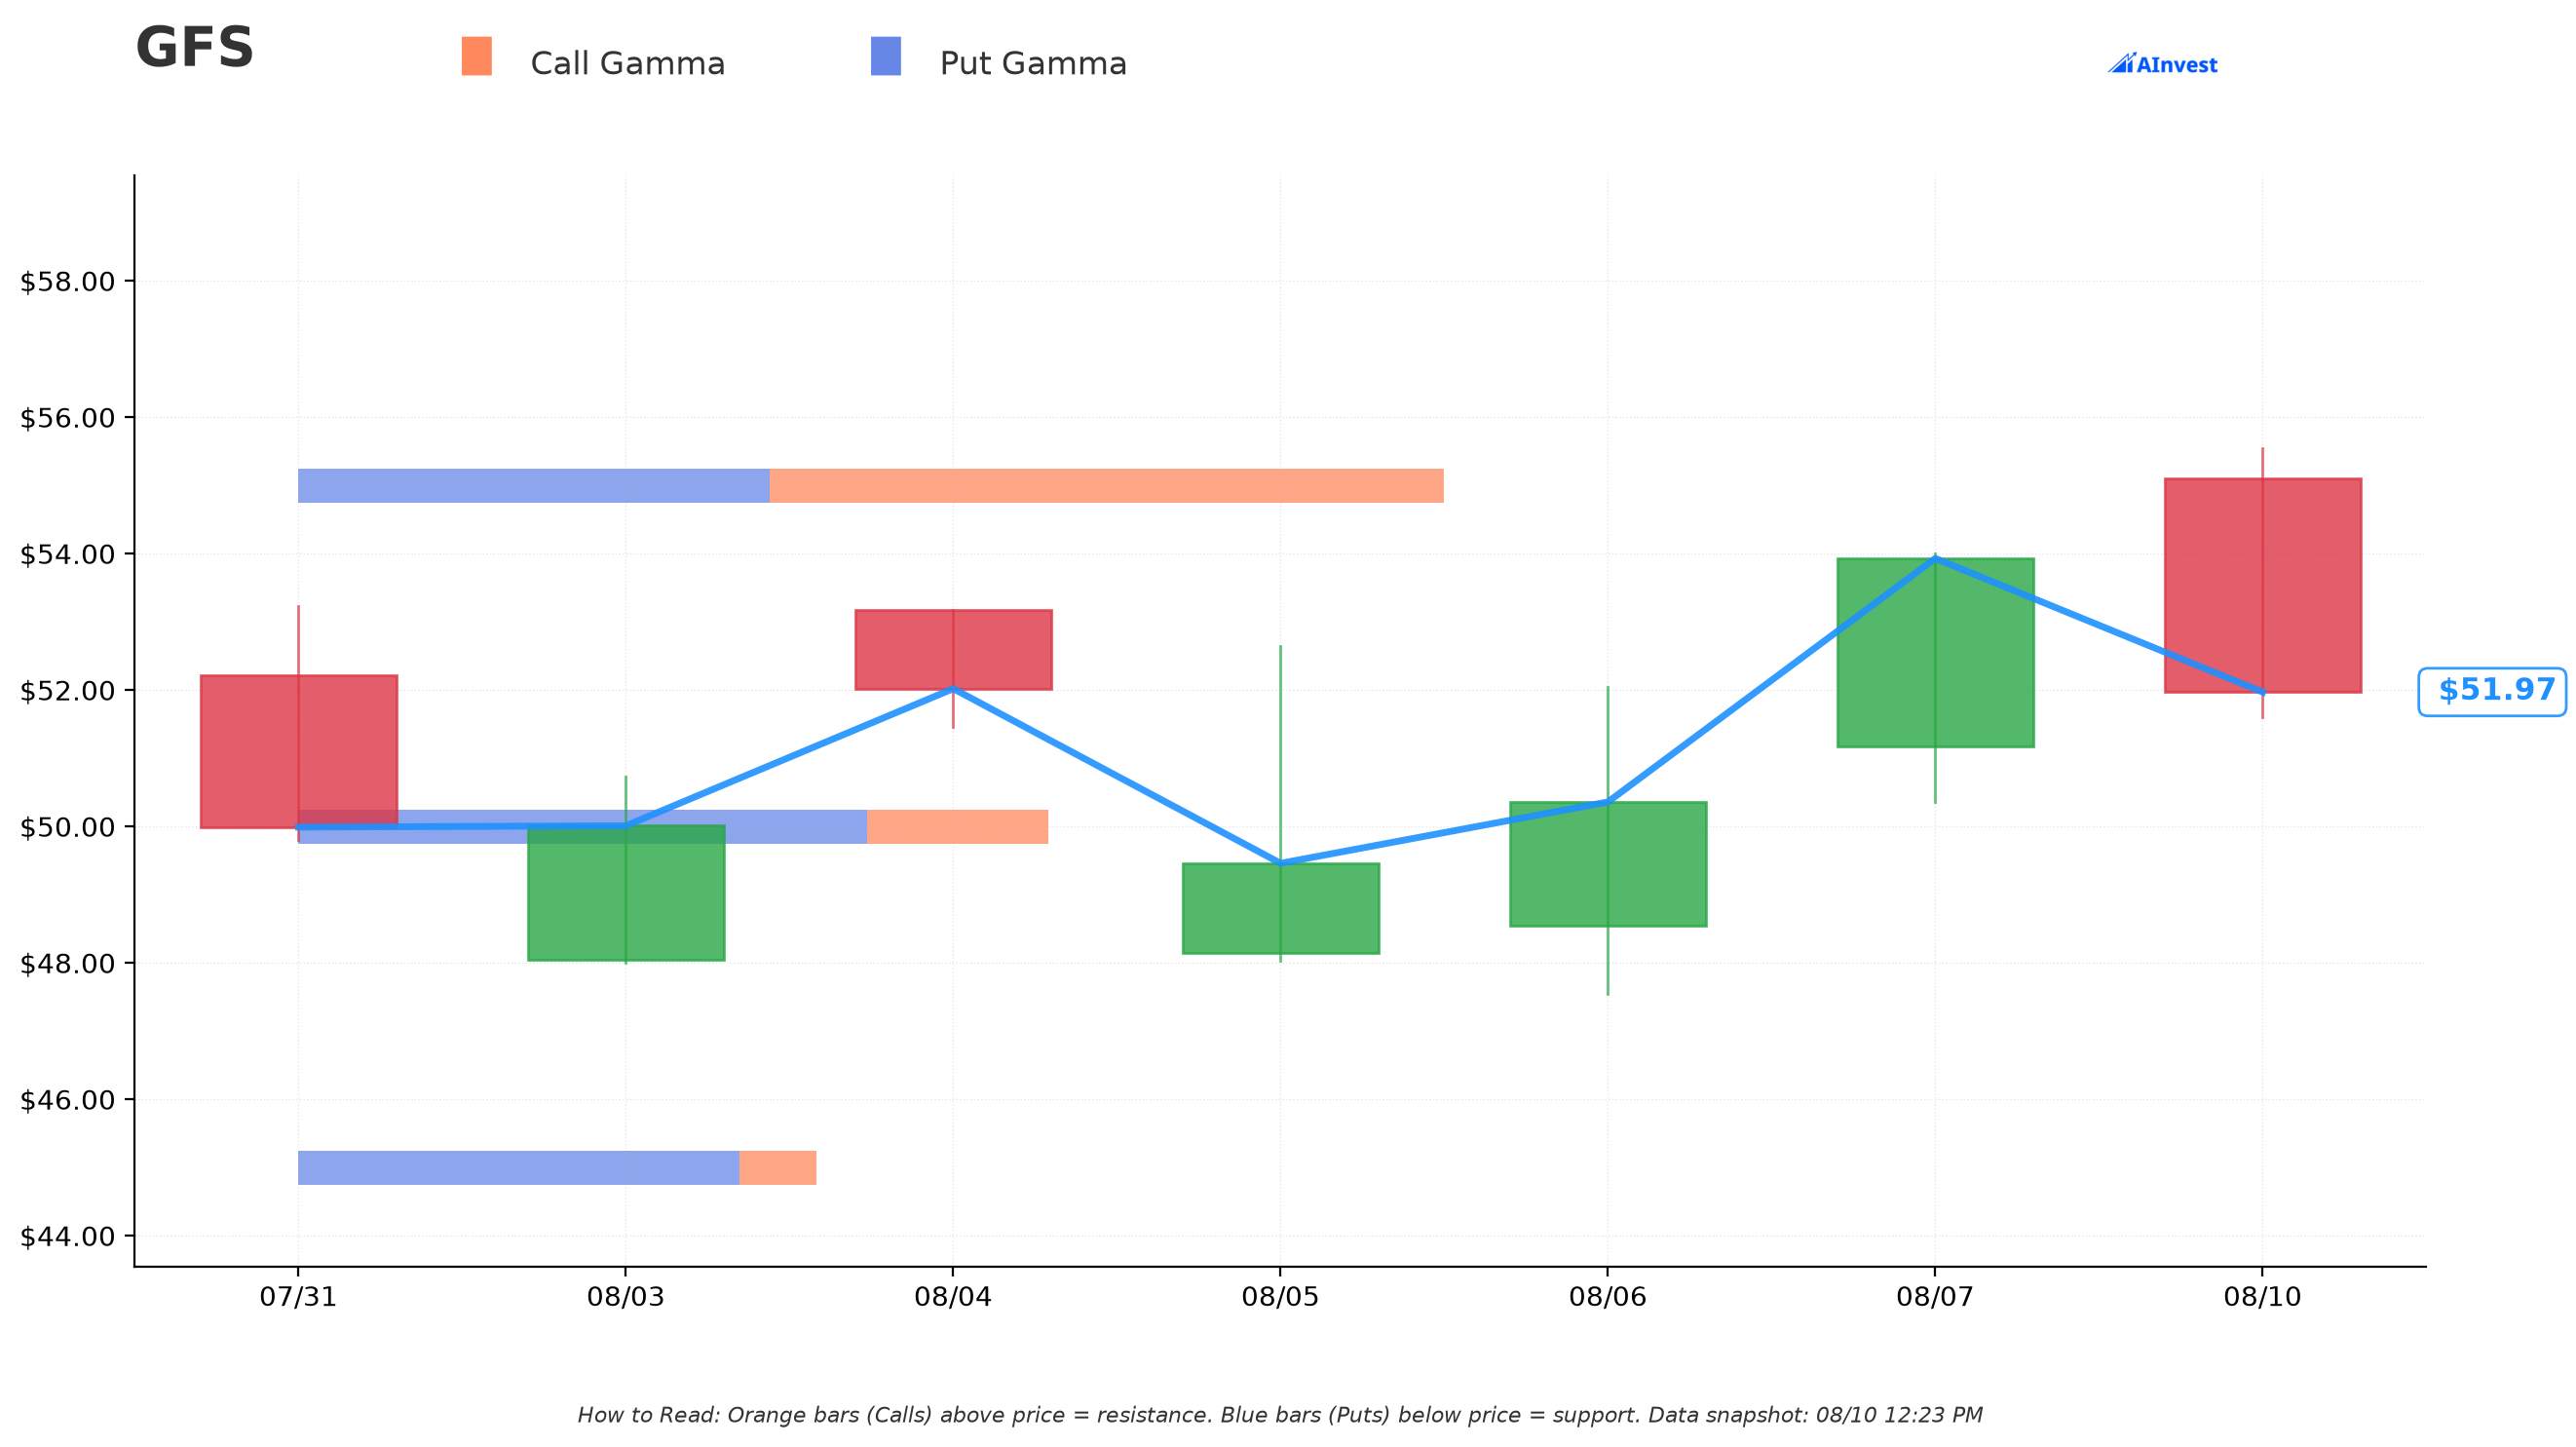
Current Price: ≈$51.99
Reading the gamma map (concrete levels from today's gamma data):
🔵 Notable levels below spot (put-gamma heavy):
- $50 — largest total gamma cluster nearby (≈1.67 total gamma units), net gamma negative (puts dominate) — this is the closest real magnet/support zone, just ≈$2 below spot.
- $45 — another sizable put-heavy zone (≈1.15 total gamma), ≈$7 below spot.
🟠 Notable levels above spot (call-gamma heavy):
- $55 — largest call-gamma zone on the board (≈1.50 call gamma), net gamma positive — the nearest real resistance, only ≈$3 above spot.
- $70 — a secondary call-heavy pocket (≈1.04 call gamma) further out, ≈$18 above spot.
What this means for traders: GFS is currently pinned almost exactly between its two nearest gamma clusters — $50 below, $55 above — a tight ≈$5 band right around the current price. That's a market where dealer hedging flows can keep price contained near $50–55 in the near term unless a catalyst pushes it decisively through one side.
Implied Move Analysis
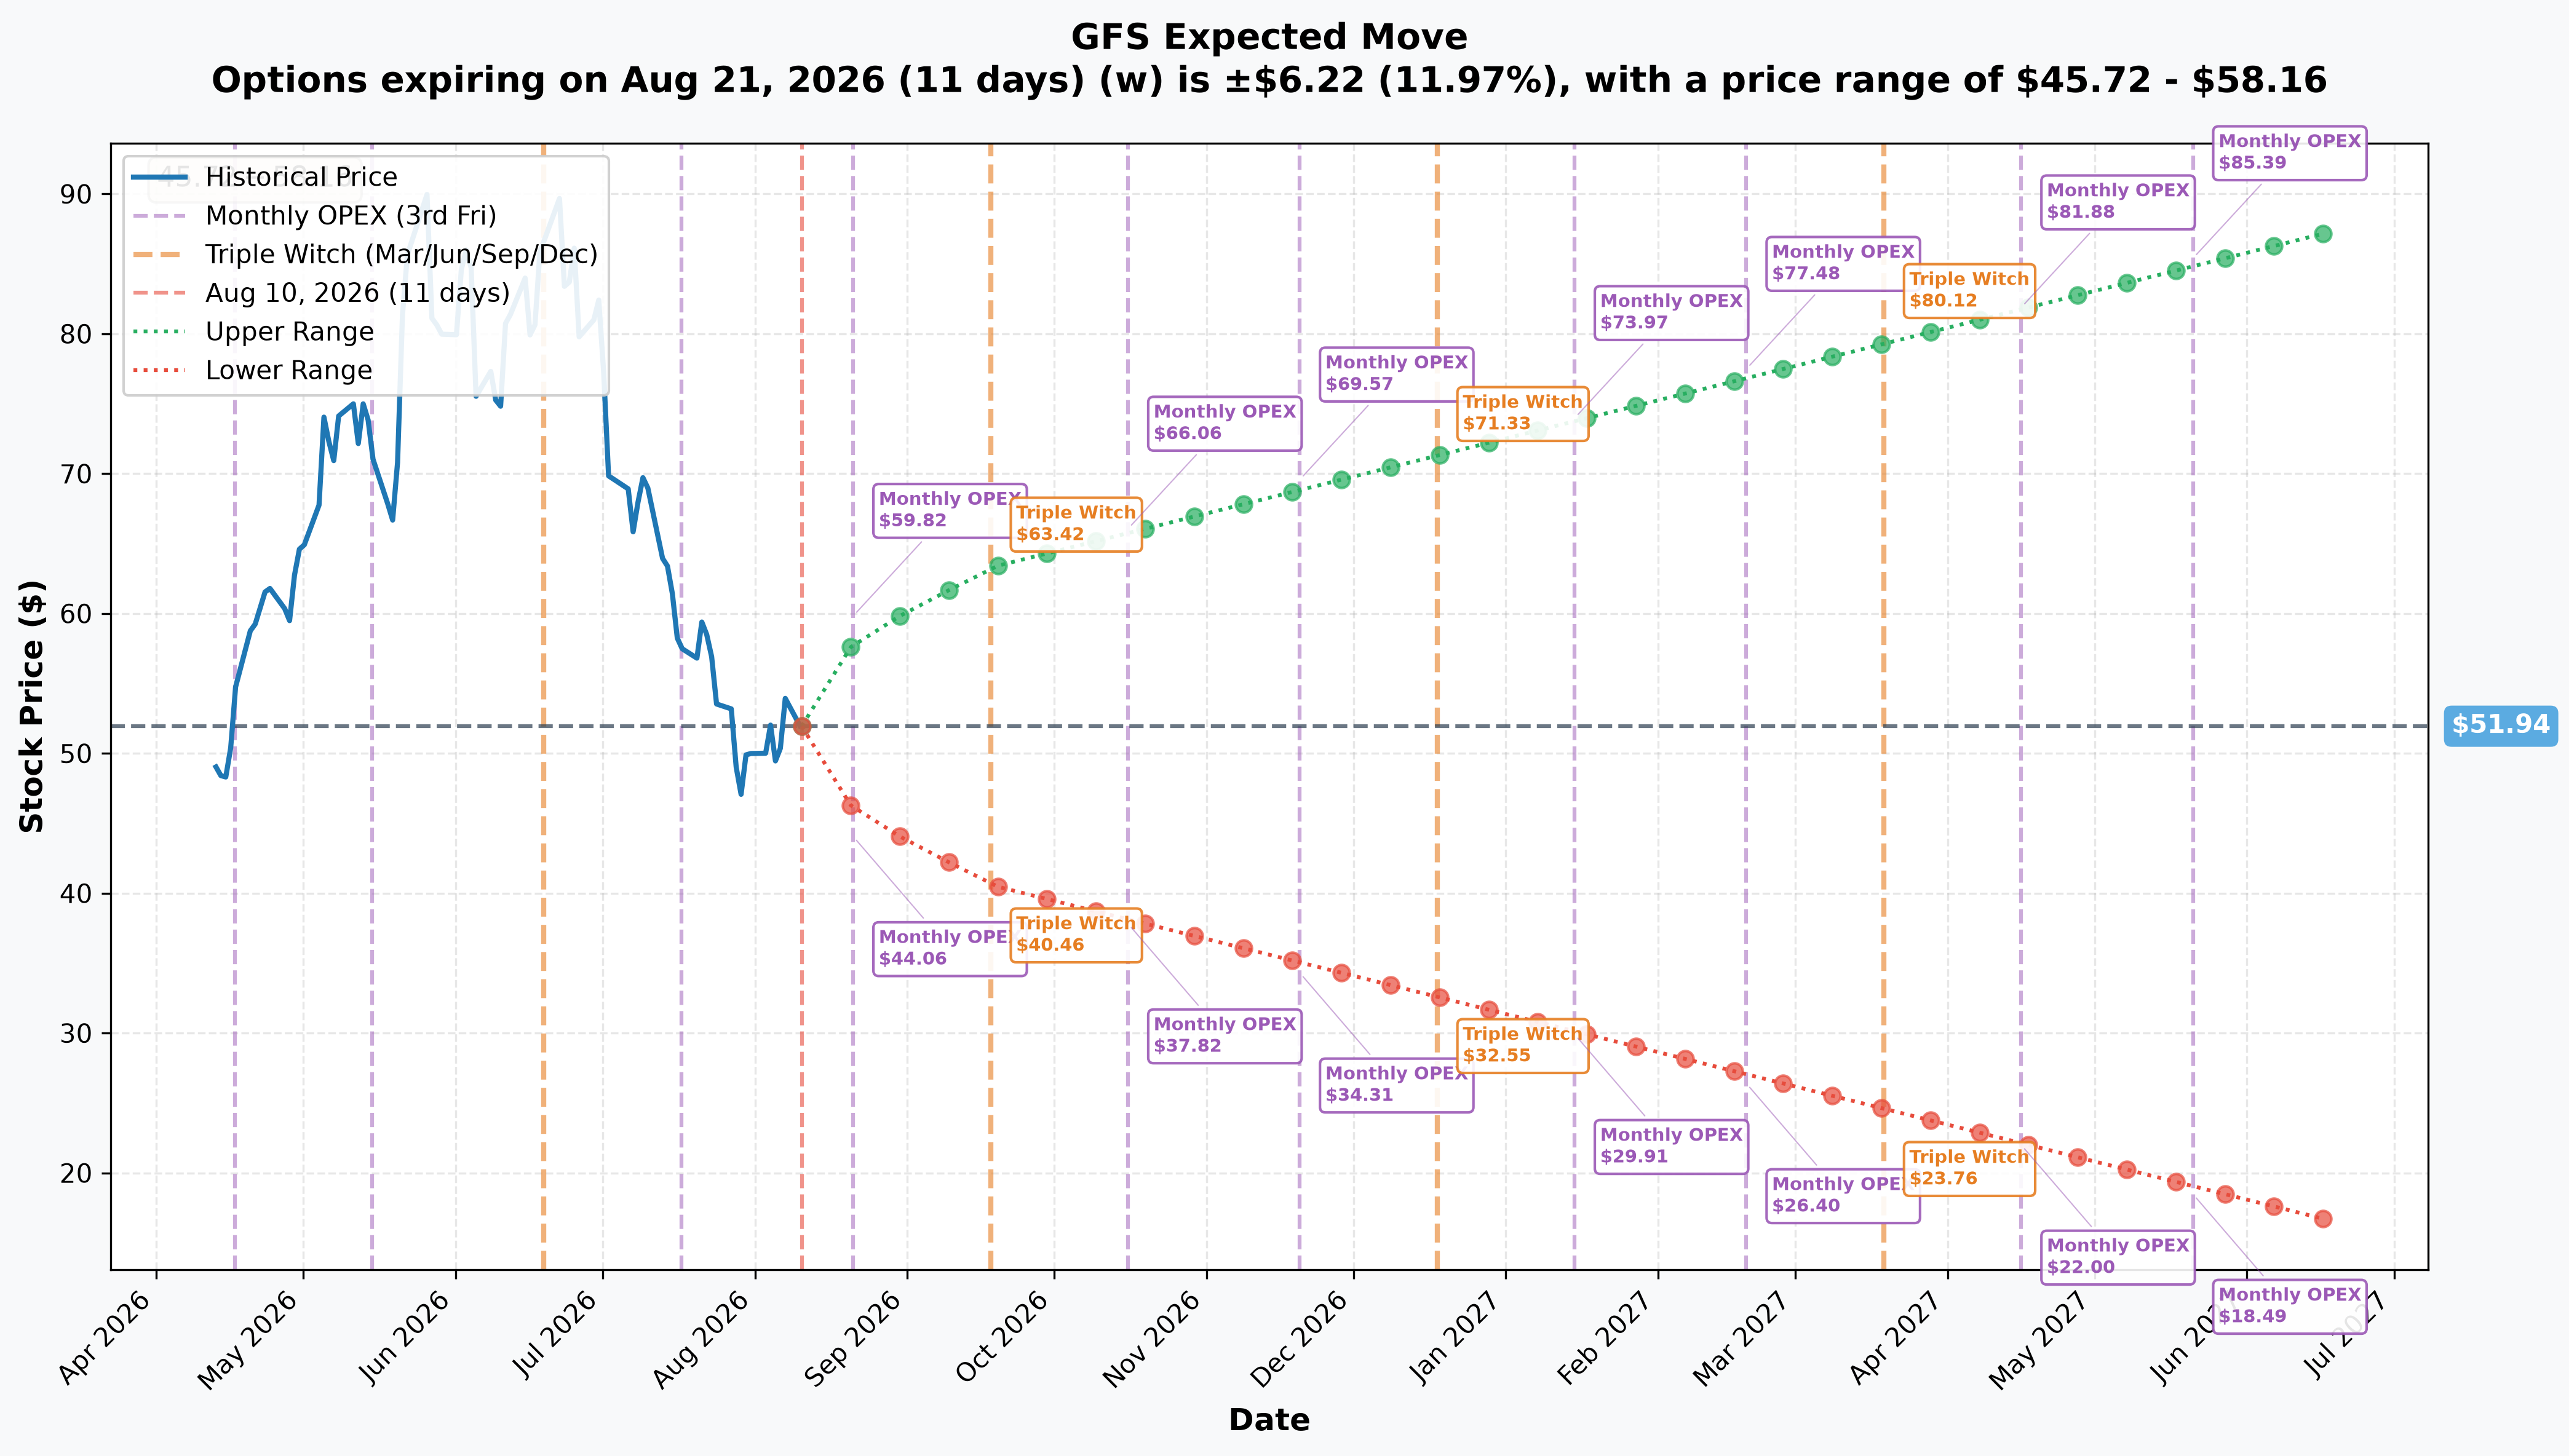
Options pricing for upcoming expirations, straight from today's implied-move data:
- 📅 Monthly OPEX (Aug 21 — 11 days): ±$6.22 (±11.97%) → Range: $45.72 – $58.16
- 📅 Quarterly Triple Witch (Sep 18 — 39 days): ±$11.39 (±21.94%) → Range: $40.55 – $63.33
- 📅 Yearly LEAPS-style read (Jun 17, 2027 — 311 days): ±$35.30 (±67.97%) → Range: $16.64 – $87.24
Translation: the market is pricing enormous uncertainty the further out you go — a nearly 68% implied swing by mid-2027 reflects just how unsettled the Street is about GFS's AI-infrastructure pivot playing out. For context, today's LEAP trade expires September 17, 2027, roughly 3 months past that yearly reference window, so treat the ≈$16.64–$87.24 band as a rough proxy — the real range by the actual 2027-09-17 expiration would be modestly wider still. Either way, this is a stock the market expects to keep moving hard in both directions.
🎪 Catalysts
A critical framing note first: today's flow used the September 17, 2027 expiration — that's an option contract's last trading day, not a company event. It's ≈13.2 months from today. Don't confuse a catalyst date with when this option stops existing.
✅ Catalysts comfortably INSIDE the September 2027 expiration window
- Q3 2026 dividend paid October 9, 2026 ($0.12/share), per the Q2 2026 earnings release.
- Q3 2026 earnings — date NOT yet company-confirmed. MarketBeat states GlobalFoundries has not announced a date as of today. Based on GF's pattern of announcing calls ≈5 weeks ahead (it announced the Aug 5 Q2 call on July 1, per the company notice), a report in early-to-mid November 2026 is a reasonable estimate — but that is an estimate, not a scheduled date.
- Q4/FY2026 earnings + the first FY2027 guide — estimated ≈February 2027, unannounced.
- Q1 2027 and Q2 2027 earnings — estimated ≈May 2027 and ≈early August 2027 respectively (the last print before this LEAP expires).
- That's four earnings reports inside the window before this contract expires.
- $300M CHIPS silicon-photonics award and $375M quantum grant — both still letters of intent, pending government due diligence, per ts2.tech. Definitization is undated but plausible within this window.
- Selective price increases implemented in Q2 2026 begin flowing into revenue "commencing 2027," per the Q2 2026 earnings call.
⚠️ Catalysts landing right at the edge — timing risk
- Near-packaged optics ramp is guided only to "2027" with no quarter specified — could land inside the window or slip past it.
- SLATE advanced-packaging volume production is guided to 2H 2027 — the start of that window opens July 1, 2027, but meaningful revenue from it likely lands close to or after this LEAP's expiry.
❌ Catalysts OUTSIDE the September 2027 window — this option never sees these
- 40% non-IFRS gross margin exit rate — targeted "by 2028," per the Q2 2026 earnings call. A September 2027 contract expires before this is even testable.
- Quantum volume production — guided to "towards the end of the decade."
- $25B pluggable optics TAM — a 2030 reference figure from the Sivers collaboration announcement.
The blunt read: a September 2027 expiration is well matched to the earnings-and-guidance path (four prints, the FY2027 guide, award definitizations, the start of price-increase flow-through) and poorly matched to the manufacturing-milestone path (SLATE, the 2028 margin target, quantum). Whatever this package is designed to capture, it's the narrative through mid-2027 — not the completed transformation.
💡 Four-Reader Interpretation
🎰 YOLO Trader
There's honestly not much here for you. This isn't a leveraged directional bet you can copy — it's a hedged or financing package where the real exposure lives in an equity leg you can't see. If you want a pure GFS speculation, this trade doesn't hand you one; you'd be constructing your own view (long calls, no stock hedge) rather than mirroring this specific print. If you do want exposure, the ±21.9% implied move into the September 18 triple-witch ($40.55–$63.33) shows the market already expects big swings — size accordingly and know you could lose 100% of any premium paid.
📈 Swing Trader
This print isn't really swing-trade material either — a 13-month LEAP with a hidden stock leg doesn't tell you much about next week's direction. What is useful: the gamma map shows a tight $50 support / $55 resistance band right around today's ≈$52 spot. If you're trading the next few weeks, that's your real playground — watch for a decisive break of either level, especially heading into the (unconfirmed) November earnings date.
💰 Premium Collector
Selling premium against GFS right now means selling into genuinely elevated implied volatility (≈22% expected move just to the September triple-witch, ≈68% out to mid-2027-style expirations) — the options market is pricing this stock as a wild card. A cash-secured put or covered call near the $50 gamma cluster could collect a healthy premium, but be honest with yourself about the risk: this stock has already round-tripped ≈45% down from its June high once this year. Size any premium-selling position for that kind of volatility, not for a "quiet consolidator."
🌱 Beginner
Two things to take away here. First, a "deep in-the-money call" is mostly just a cheaper way to own stock — of the $26.30 paid per contract, ≈$21.80 was already "real" value (intrinsic), and only ≈$4.50 was the actual time-based bet. Second — and this is the important lesson — big option premium headlines don't automatically mean "someone is betting big on this stock." When a trade also carries a paired stock leg, as this one did, the option alone can't tell you the net directional view. Don't chase a headline dollar figure without understanding the structure behind it.
⚠️ Risk Factors & Honest Limits
What the tape can prove: the mechanism (a negotiated cross with a paired stock leg), the size (1,450 contracts, $3.81M premium), the open interest jump from 100 to a now-larger line (proven opening, not a close), and the intrinsic/extrinsic split (≈$21.80 / ≈$4.50).
What the tape CANNOT prove — and this is the single biggest gap: the size and direction of the paired stock leg. We cannot see whether the desk was buying stock alongside the calls (amplifying long exposure), selling stock against them (hedging toward flat or even net-short), or something in between. Without that, we genuinely do not know whether this package carries any net directional exposure at all. Treat any "bullish" or "bearish" framing of this specific trade with real skepticism.
Other honest limits: we cannot see the broker, the customer's identity, the order ID, or whether the counterparty already held an offsetting position. We also can't confirm the September 2027 GFS earnings and event calendar beyond what's already scheduled — several dates cited above (Q3 2026 earnings, the FY2026/FY2027 guide timing) are pattern-based estimates, not company-confirmed.
GFS itself carries real fundamental risk independent of this trade: Q2 2026 adjusted free cash flow was −$3M against a ≈+$122M expectation despite the earnings beat, two of three legacy end markets (smart mobile, automotive) are shrinking, both federal awards remain unsigned letters of intent, and analyst price targets range from $55 to $140 — a genuinely split Street with no real consensus on what this company is worth.
Options trading involves substantial risk of loss and may not be suitable for all investors. This analysis is for educational purposes only and is not financial advice. The structure described above — a deep-ITM LEAP paired with an unseen equity leg — is inherently harder to interpret than a plain directional option trade; when in doubt, size small and wait for the next-day open-interest confirmation before drawing conclusions.
About GlobalFoundries: GlobalFoundries is a pure-play semiconductor foundry specializing in specialty and mature-node process technology — RF-SOI, FD-SOI, silicon-germanium, silicon photonics, GaN power, and quantum manufacturing — with a market cap of ≈$28.55 billion in the Semiconductors industry.
Last updated: 2026-08-11 (pre-market) — the next-day OPRA open-interest snapshot resolved this session's provisional flags. Sep-17-2027 $30C 100 → 1,558 (+1,458 on a 1,450-lot print): OPEN (BTO), against a published prediction of ≈1,550. The deep-ITM LEAP position is proven new. The ⏳ callout was replaced with the ✅ RESOLVED box.