🔄 GOOGL $5.49M Credit: Not a New Spread — a Desk Rolled Its Short Call DOWN From $410 to $390
📅 August 3, 2026 | 🔥 Unusual Activity Detected
🔄 CORRECTION — August 4, 2026 pre-market: the next-day OI inverts this trade. It was NOT a new bear call spread. Open interest on the $410 call fell 13,475 → 6,863 (−6,612) — the buy was closing an existing short $410 call, not opening a protective long. The $390 call opened as published (2,706 → 10,563). The real trade: a desk rolled its short call DOWN from $410 to $390, which moves the cap closer to the money and removes the upper wing. The capped-$10.0M-loss payoff table below no longer describes this position. See the ✅ RESOLVED box.
🎯 The Quick Take
A floor-negotiated block sold 7,750 GOOGL $390 calls and bought 7,750 GOOGL $410 calls, both expiring January 15, 2027, for a net credit of $5.49M. When this first published we read it as a fresh bear call spread with a capped $10.0M loss. The next-day open-interest snapshot proved otherwise: open interest at the $410 strike fell by 6,612 contracts, so the buy was closing an existing short $410 call — not buying a protective wing. What actually happened is a short call rolled down from $410 to $390 in the same expiration: the cap on GOOGL moved from ≈10.9% above spot to ≈5.5% above spot, and there is no long $410 wing above it to define the risk. Still not a crash bet — still a view that a stock already +19.0% YTD doesn't run much further, much faster — but a more aggressive, less-defined version of that view than we originally described. The corrected walk-through is in the ✅ RESOLVED box below; the payoff table further down describes the spread as originally published, not the position that was actually established.
🏢 Company Overview
Alphabet Inc. Class A (GOOGL) trades on the Nasdaq (Class C shares trade as GOOG) with a market cap of ≈$4.58 trillion, in the Communication Services sector / Interactive Media & Services industry. Alphabet reports three segments: Google Services (Search, YouTube, Android, Chrome, Play — still ≈68% of revenue), Google Cloud (infrastructure, Workspace, and increasingly TPU hardware sales), and Other Bets (mainly Waymo). The 52-week range is $190.12 to $408.61, and the stock has been one of the market's strongest mega-cap performers this year on the back of Google Cloud's growth acceleration and the broader AI trade.
💰 The Option Flow Breakdown
📊 What Just Happened — 🤝 Floor-Negotiated Block
| Time | Buy/Sell | Call/Put | Expiration | Strike | Option Price | Premium | Day Volume | Prior OI | Size | Spot | Option Symbol |
|---|---|---|---|---|---|---|---|---|---|---|---|
| 11:16:15 | SELL | CALL | 2027-01-15 | $390 | $29.19 | $22,622,250 (collected) | 8,362 | 2,706 | 7,750 | $369.69 | GOOGL20270115C390 |
| 11:16:15 | BUY | CALL | 2027-01-15 | $410 | $22.11 | $17,135,250 (paid) | 8,199 | 13,475 | 7,750 | $369.69 | GOOGL20270115C410 |
🤝 This printed as a single floor-negotiated block — a broker matched both legs off the open book at 11:16:15, not an aggressive lit sweep. Two legs, same size (7,750 each), same expiration. Net result: $5.49M credit collected, on a $20-wide spread.
✅ RESOLVED — Next-Day OI Is In (August 4, 2026 pre-market)
The OPRA open-interest snapshot timestamped August 4, 2026 ≈06:30 ET reflects the close of business August 3 — the definitive open-vs-close test we flagged when this published. Here is what it says.
| Leg | Baseline OI (Aug-3 snap) | Resolving OI (Aug-4 snap) | Δ | Print size | Published read | Verdict |
|---|---|---|---|---|---|---|
| Jan-15-2027 $390 call (sold) | 2,706 | 10,563 | +7,857 | 7,750 | STO (proven open) | ✅ OPEN (STO) — confirmed |
| Jan-15-2027 $410 call (bought) | 13,475 | 6,863 | −6,612 | 7,750 | BTO ⏳ provisional | 🔄 CLOSE (BTC) — INVERSION |
We predicted both outcomes, and the closing one won. The article said: "If it's closing, OI should fall — possibly toward ≈5,725." It fell to 6,863. Open interest at the $410 strike dropped by 6,612 contracts, and only 543 contracts traded there all day outside our block — which means at least ≈6,910 of the 7,750 contracts bought were closing an existing short $410 call. At most ≈840 could have been opening. This is not a marginal call; the arithmetic leaves no room for the "fresh long wing" reading.
🔄 What the trade actually was: a short call rolled DOWN, not a spread opened
Before August 3, this desk was short January-2027 $410 calls. On August 3 it bought ≈7,750 of them back and sold 7,750 January-2027 $390 calls in the same negotiated package. Net position after: short the $390 call, flat the $410.
Why that is a materially different — and more aggressive — trade than what we published:
- The upper wing is gone. A bear call spread's whole point is that the long $410 call caps the loss at the strike width. This desk does not own a $410 call; it sold its $410 exposure back. Nothing above $390 is capped by anything visible on the OPRA tape. The "$10.0M maximum loss" figure in the payoff table below assumed a long $410 wing that does not exist.
- The cap moved ≈5% closer to the money. The strike where this position starts losing dropped from $410 to $390 — from ≈10.9% above spot to ≈5.5% above spot. That is a more bearish, or at least a more income-hungry, stance on a stock up 19.0% YTD.
- It is a management decision, not a new view being initiated. Someone already had short call exposure in January 2027 and chose to reprice it lower rather than let it sit. Rolls tell you about a position's history; fresh spreads tell you about a new thesis. This is the former.
Honest limits, unchanged: OPRA shows contracts, not accounts. We can prove that open interest at the $410 strike fell by 6,612 while our block bought 7,750 there — that is what makes the close read decisive. We cannot prove the desk holds no offsetting long stock, LEAPS, or other calls elsewhere that would re-cap the risk. If it does own GOOGL shares, the short $390 call is a covered overwrite rather than a naked short. Read the payoff table below as the spread's arithmetic as originally published, and this box as the correction to what was actually established.
🤓 What This Actually Means — Plain English
The structure: a bear call spread (also called a call credit spread). They sold the closer-to-the-money $390 call and used part of that premium to buy the farther-out $410 call as protection. Selling a naked call has theoretically unlimited risk; buying the $410 call caps that risk at exactly $20/share (the strike width) minus the credit received. That is the entire point of this structure — it trades away some of the credit for a hard ceiling on the downside.
Order types, and why one is more certain than the other:
- The $390 short call is best read as STO (Sell to Open) — size 7,750 clearing prior OI of 2,706 tells us new contracts had to be created. This is proven opening, not a close.
- The $410 long call is labeled BTO (Buy to Open) by default, but it's genuinely provisional — with prior OI at 13,475 already well above today's size, this print is equally consistent with someone buying to close an existing short $410 call position. We're not going to assert conviction here; treat it as "opened, probably, but check tomorrow's OI."
The payoff, spelled out at several prices (per-share P&L × 7,750 contracts × 100 shares):
| GOOGL price at Jan 2027 expiry | Per-share result | Total P&L |
|---|---|---|
| $340 | +$7.08 (max profit) | +$5.49M |
| $369.69 (spot at the print) | +$7.08 (max profit) | +$5.49M |
| $390 (short strike) | +$7.08 (max profit — breakeven starts just above here) | +$5.49M |
| $400 | −$2.92 | −$2.26M |
| $410 (long strike) | −$12.92 (max loss reached) | −$10.0M |
| $440 | −$12.92 (max loss, stays capped) | −$10.0M |
Breakeven is $397.08 (the $390 strike plus the $7.08 credit received). Below that, this position is profitable; above it, losses build until they cap out at $410 and stay flat from there — the long $410 call absorbs any further move, which is exactly why the max loss is a known, fixed $10.0M rather than an open-ended number.
The motive, as best we can infer: package delta is −65,100 shares — mildly negative, nowhere near a directional short. This reads as an income/neutral-to-slightly-bearish trade on a name that's already run hard, not a bet on a decline. Someone collected $5.49M for taking on the view that GOOGL — up 19.0% YTD and trading right around Wall Street's own consensus price targets — doesn't need to rally another ≈5.5% to $390 (let alone another ≈10.9% to $410) inside the next ≈5.5 months to make this profitable. We cannot know from the tape whether this sits against an existing long stock/call position (in which case it's a classic "cap some upside, bank some income" overlay) or is a standalone bet — that identity is invisible to OPRA.
📈 Technical Setup / Chart Check-Up
YTD Performance
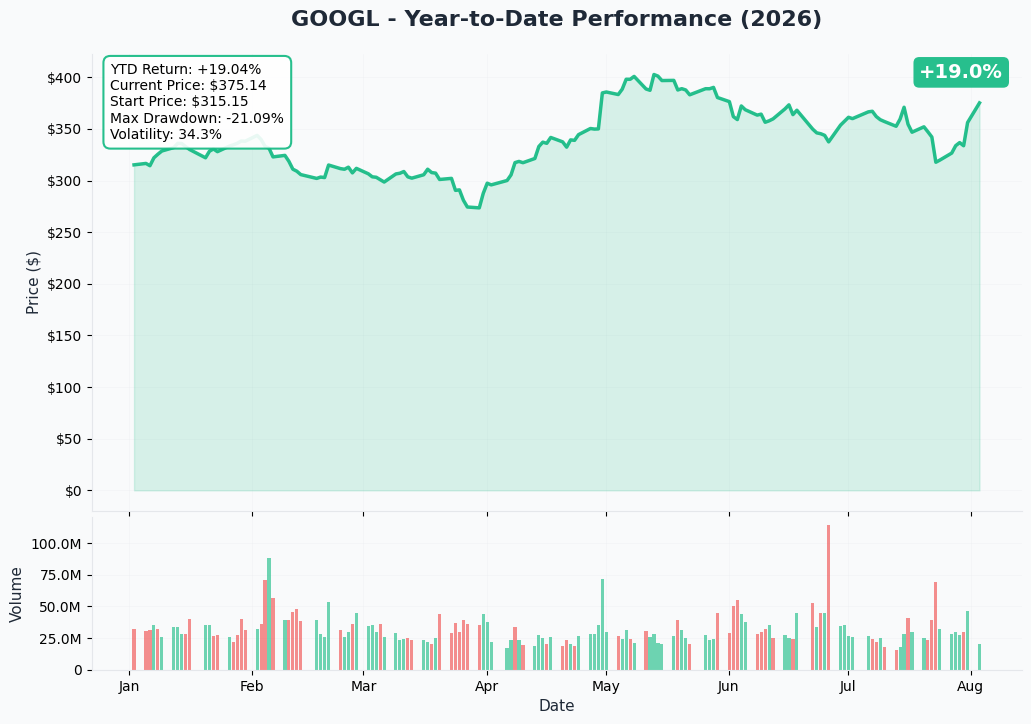
GOOGL is +19.0% YTD, trading in the $369.69–$375.52 zone on the day of this trade (the spread printed at 11:16:15 with spot $369.69; by midday the stock had pushed toward ≈$375, part of a reported reassessment of the July 22 earnings print). The stock sits roughly 8% below its 52-week high of $408.61 — notably, that high is almost exactly where the long $410 call strike caps this trade's loss.
🎯 Gamma-Based Support & Resistance
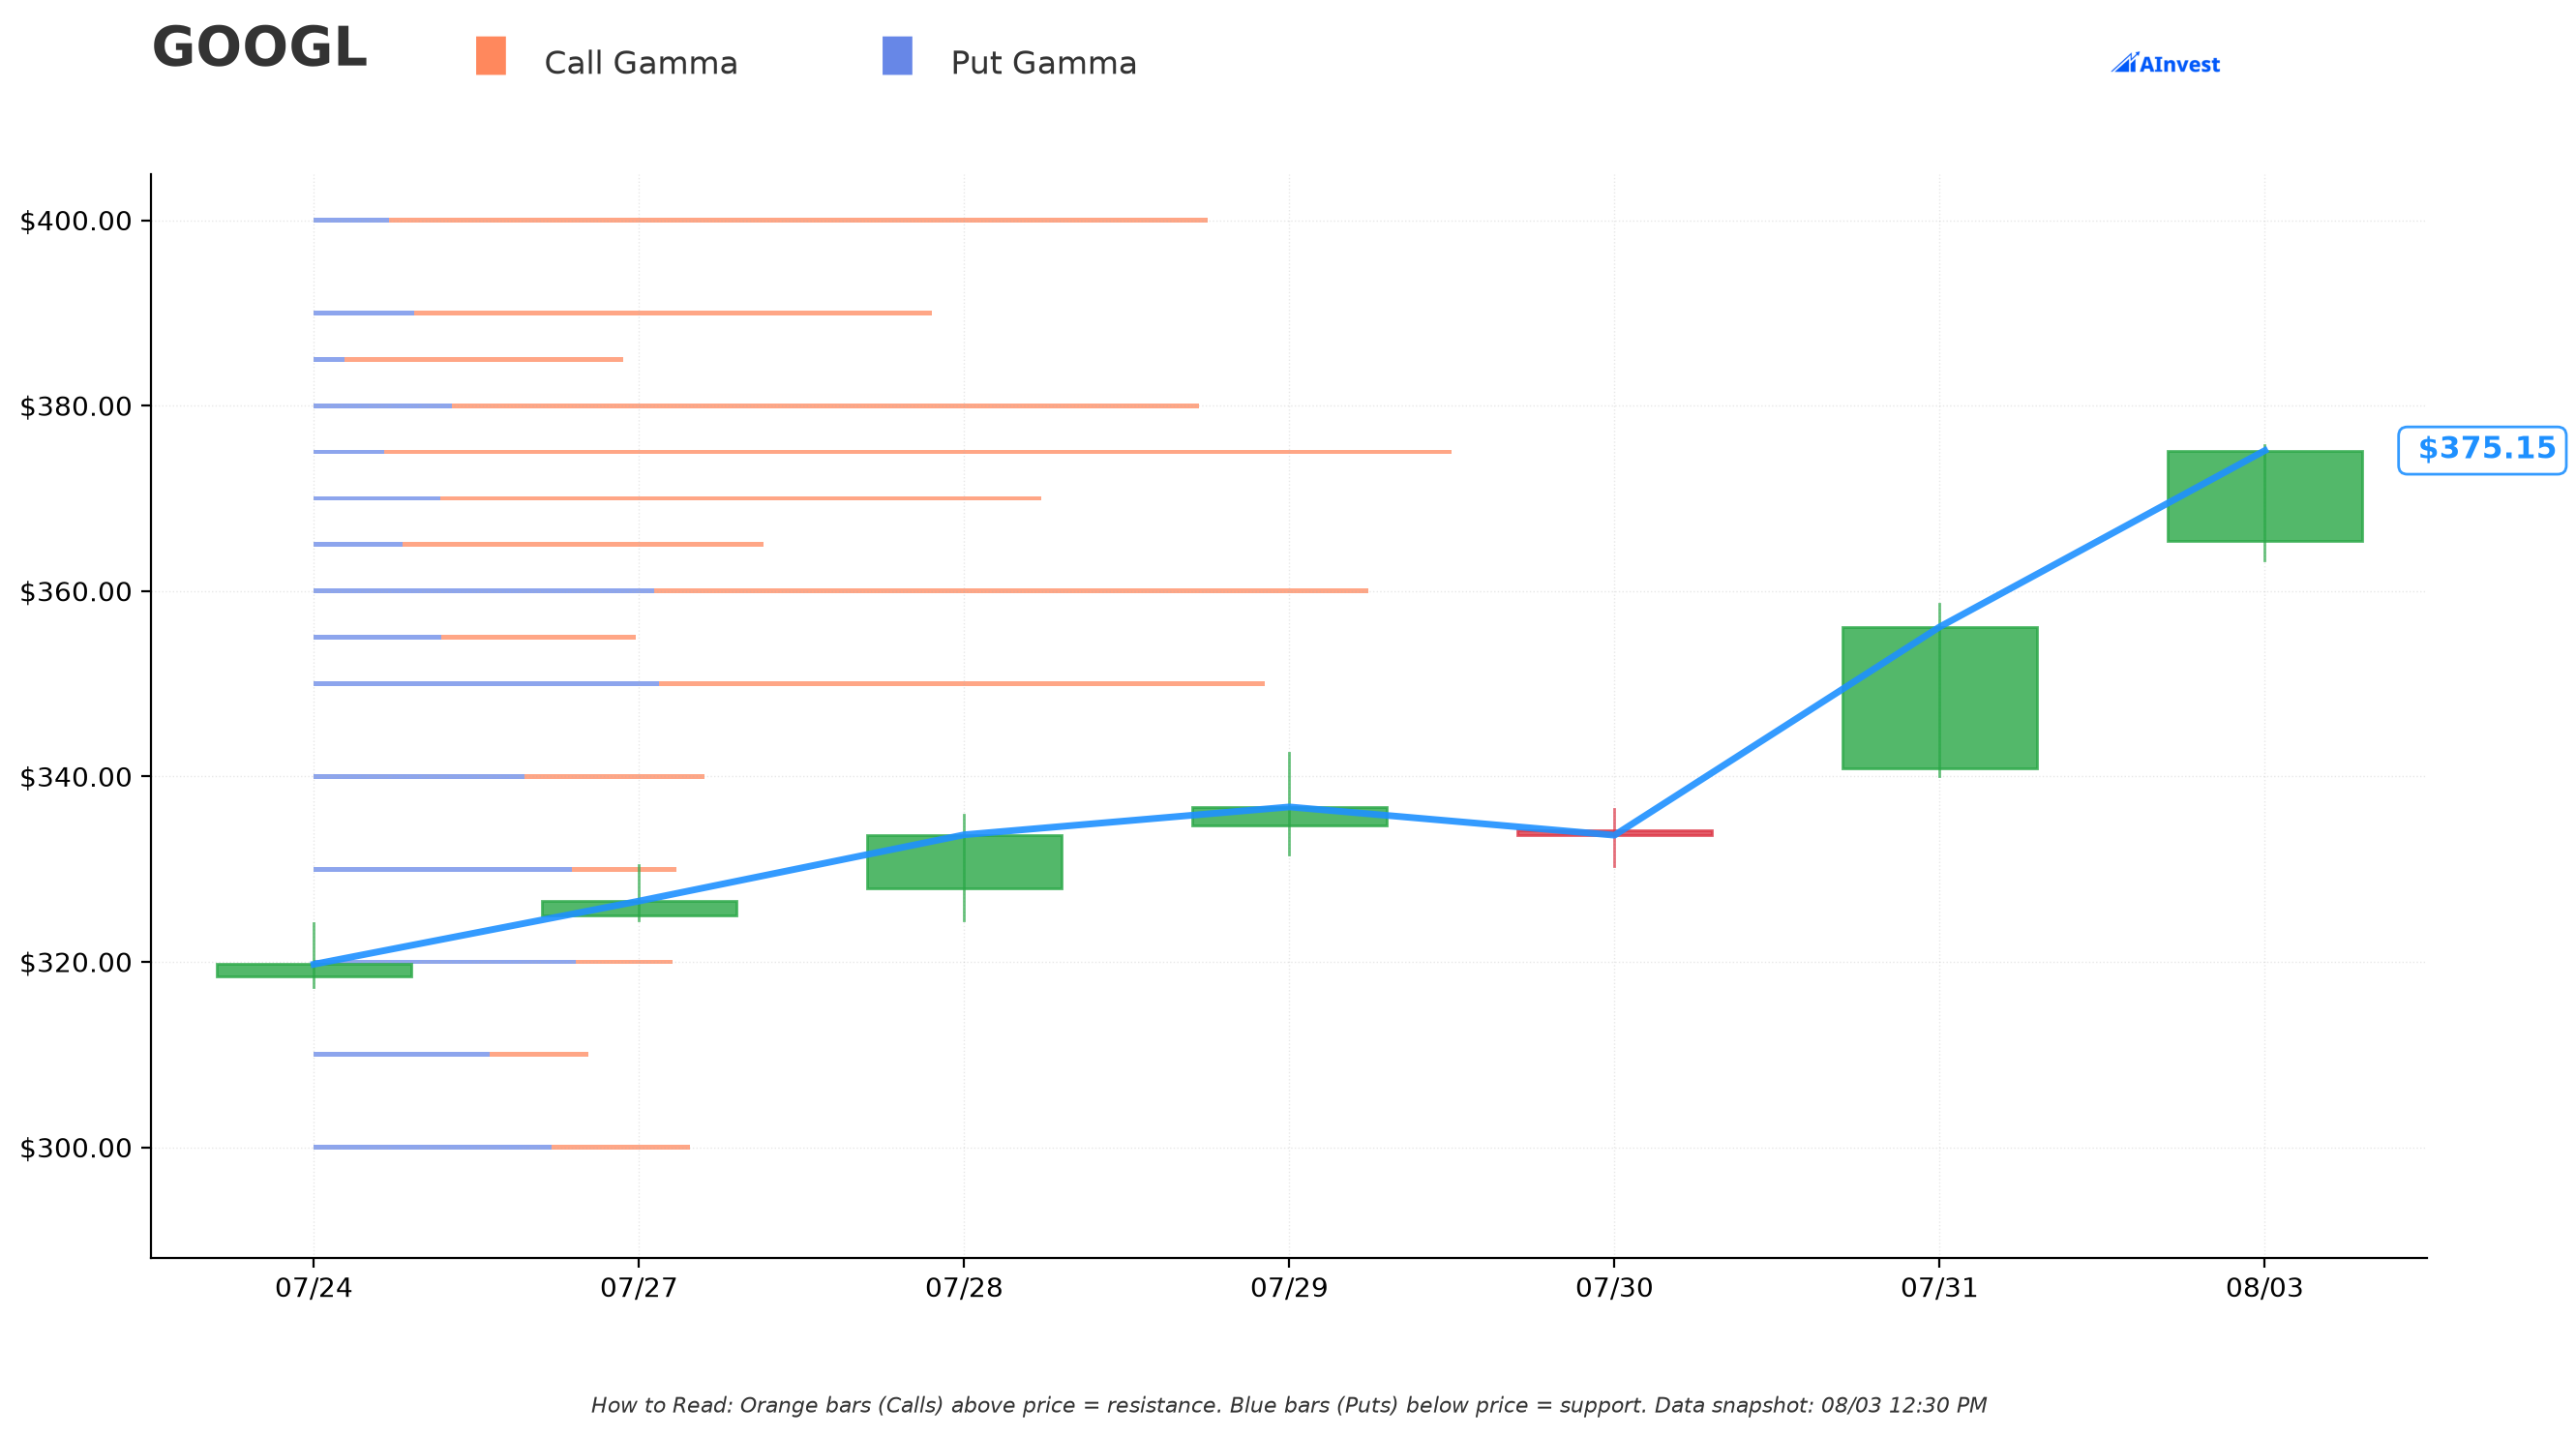
As of the current snapshot (spot $375.46):
- 🔵 Support: $375 (Very Strong, right at spot), $370 (Very Strong, ≈1.5% below), $360 (Very Strong, ≈4.1% below), $350 (Very Strong, ≈6.8% below).
- 🟠 Resistance: $380 (Very Strong, ≈1.2% above), $390 (Very Strong, ≈3.9% above — the exact strike this desk sold the call at), $400 (Very Strong, ≈6.5% above), $410 (≈9.2% above — the exact strike this desk bought protection at).
Notice the overlap: both trade strikes ($390 and $410) sit right on top of gamma resistance walls the market is already pricing as "Very Strong." That's not proof of anything about January 2027 — these gamma levels are dynamic and will keep shifting as new options trade between now and expiry — but it does show the desk chose strikes that today's market makers already treat as levels where upside momentum tends to stall.
📐 Implied Move
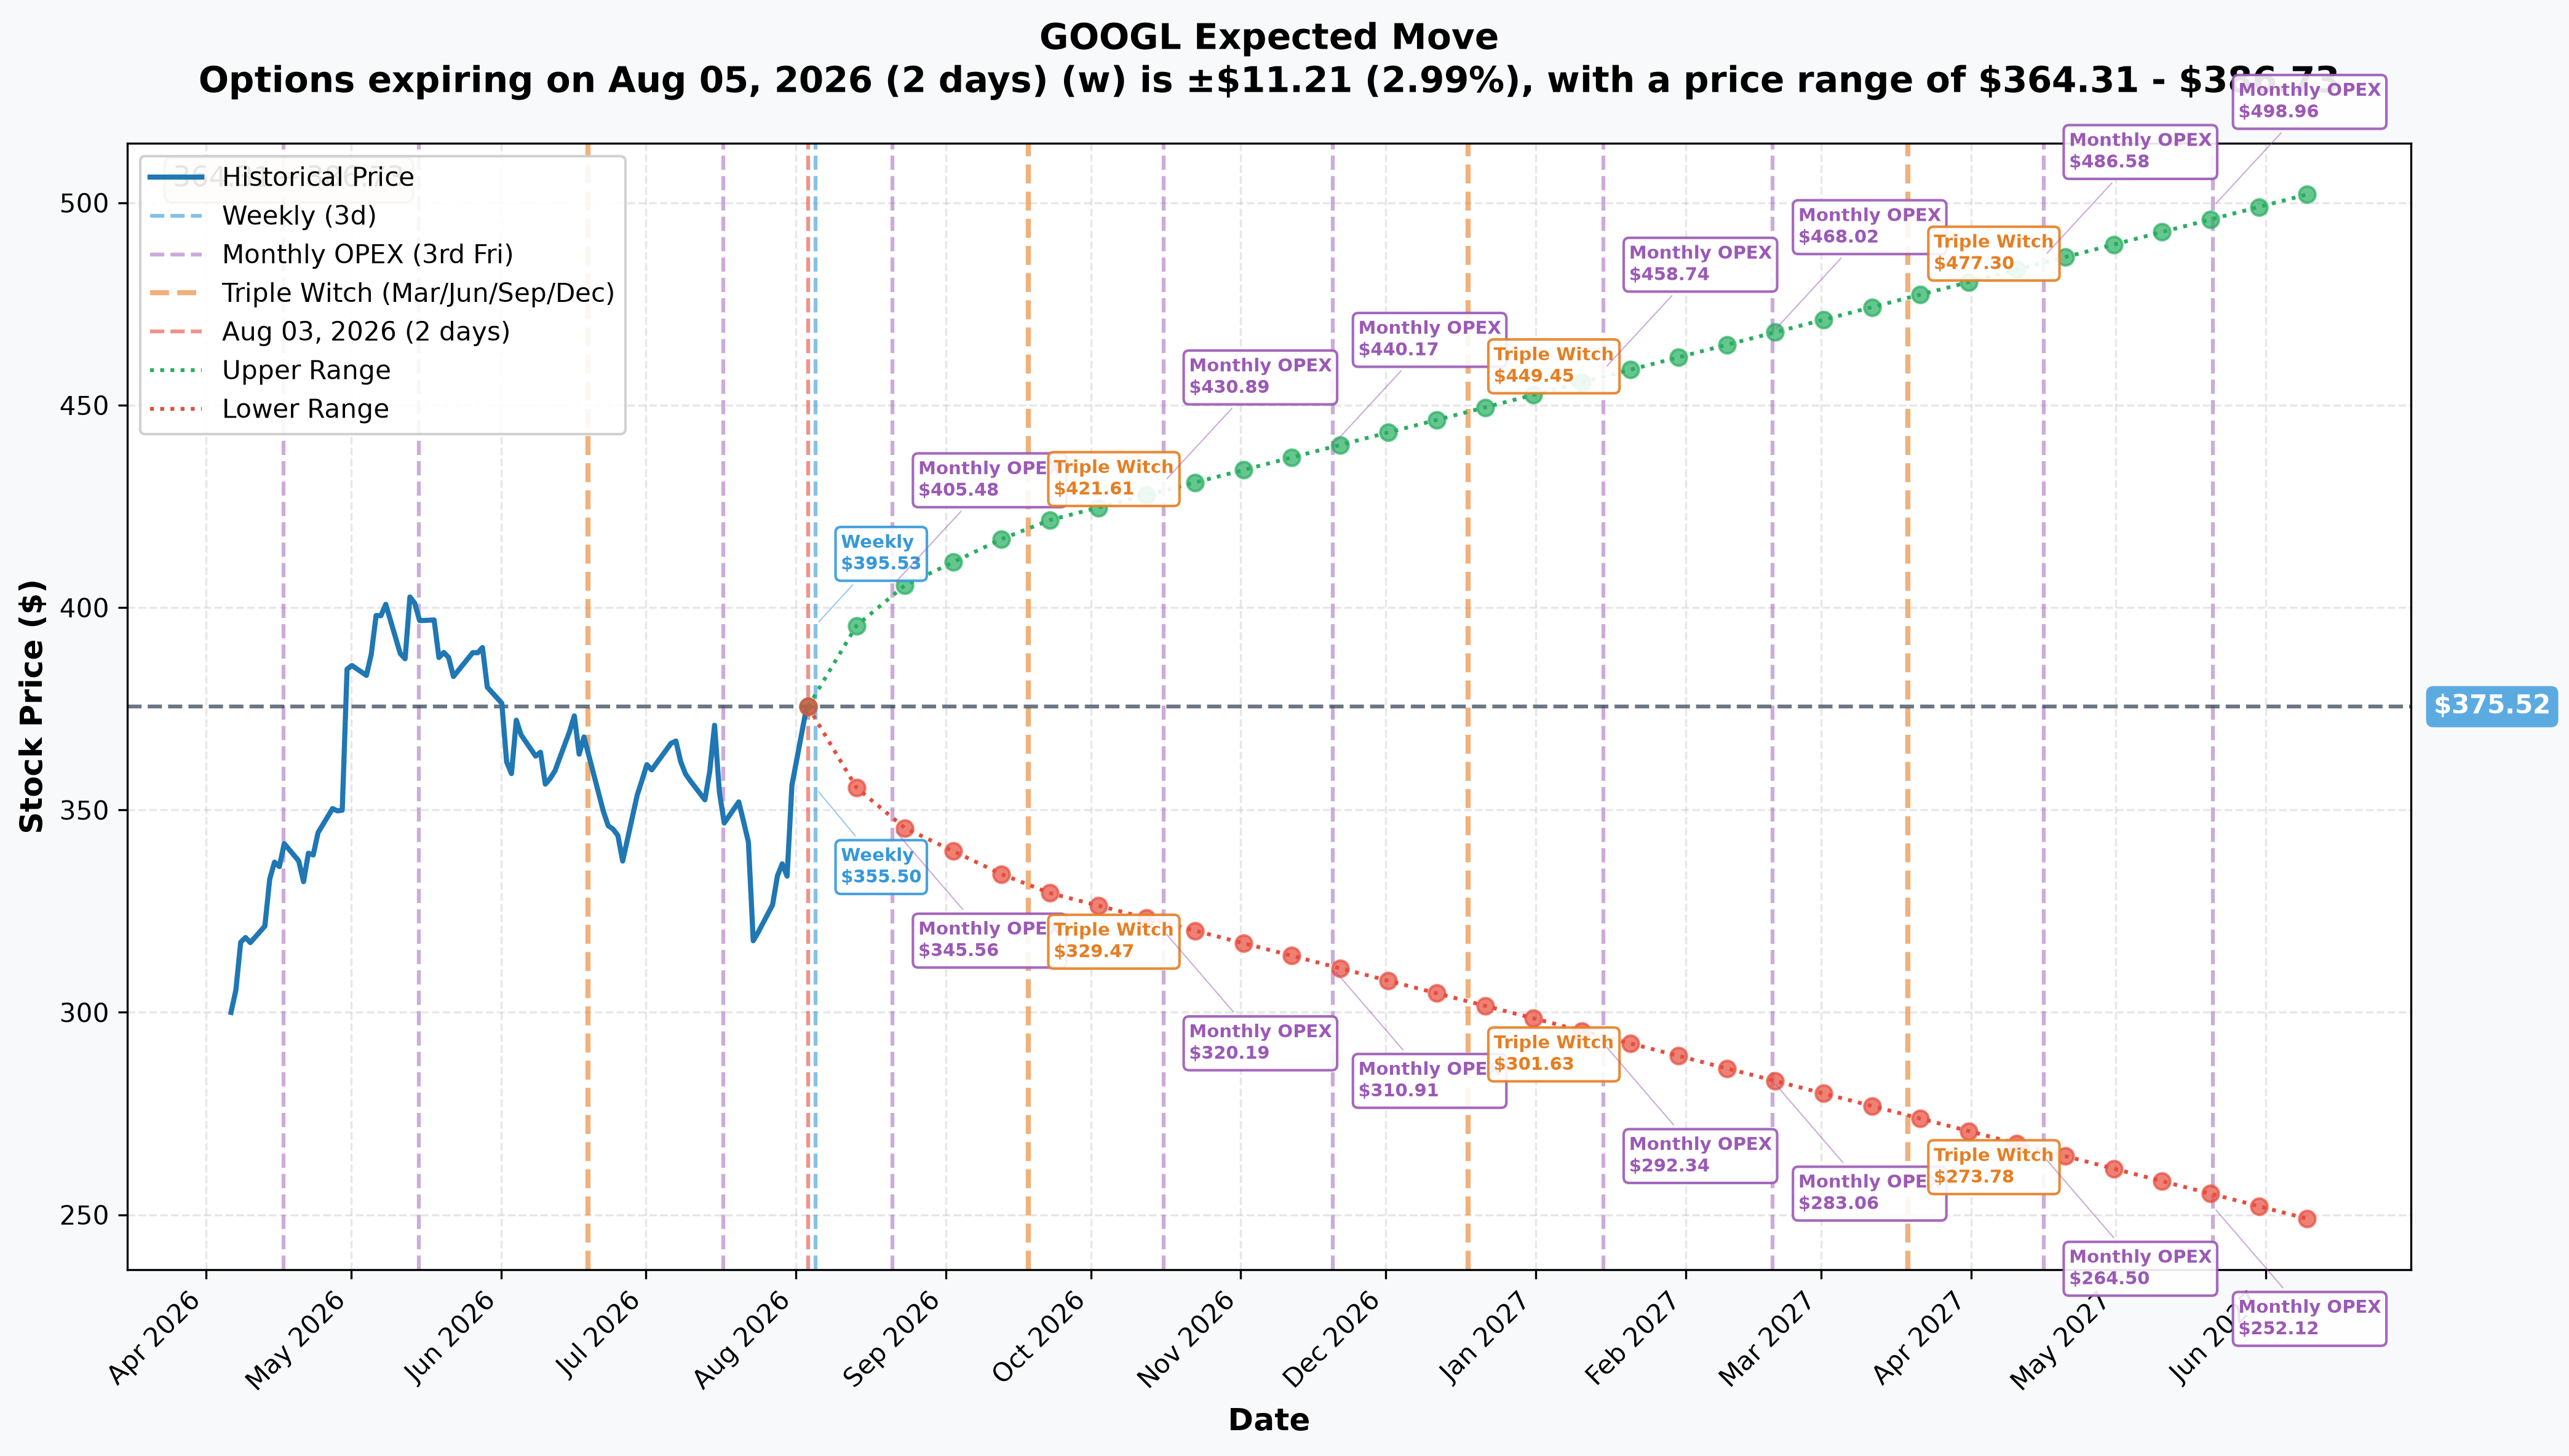
The options market's own pricing for the January 15, 2027 monthly OPEX (the exact expiry of this trade) implies a cone stretching from ≈$292.34 to ≈$458.74 by that date. That's a far wider range than the $390–$410 spread — which tells us the market is pricing real tail risk in both directions over the life of the trade, even though the nearer-term gamma walls cluster much tighter, at $380–$400. For context, the shorter-dated cones: weekly (Aug 5) ≈$364.31–$386.73; monthly OPEX (Aug 21) ≈$346.70–$404.34; quarterly triple witch (Sep 18) ≈$330.71–$420.37.
🎪 Catalysts — Mapped to the January 15, 2027 Expiry
⚠️ The structural finding that matters most for this trade
Only one earnings print falls inside this option's life. Q3 2026 earnings are expected ≈October 27–28, 2026 (estimated, not yet confirmed by Alphabet). Q4/FY2026 earnings — expected ≈February 3, 2027 — land about three weeks AFTER this Jan-15 expiry, based on Alphabet reporting Q4 2025 on February 4, 2026. That means the single biggest scheduled catalyst of the AI-capex cycle — the FY2027 capital-spending guidance — resolves after this spread expires, not before.
Already happened (last 3 months)
- Q2 2026 earnings, reported July 22, 2026: revenue $119.796B (+24% YoY), with Google Cloud +82% to $24.768B and segment operating margin expanding to 35.6%, plus a $514B contracted backlog (earnings release, backlog/capex coverage).
- The bear side of that same print: FY2026 capex guidance was raised to $195–205B, and Alphabet posted its first negative quarterly free cash flow (−$5.855B) (stock reaction coverage). Buybacks were $0 in Q2 2026 and $0 year-to-date, versus $28.3B in the same period a year ago — a real reversal in the per-share compounding story. The stock fell 5–7% initially, then fully recovered as the market reassessed the cloud-margin story.
- EU regulatory pressure: a €890 million DMA fine on July 23, 2026, with a 60-day search-redesign compliance deadline (TechTimes) — that clock expires ≈September 21, 2026, well inside this trade's window.
- Apple relationship: Google both pays Apple ≈$20B/year for default search placement and now supplies Gemini to power a rebuilt Siri under a reported ≈$1B/year deal (BriefScript) — a structural de-risking of the antitrust threat to that search deal.
- Berkshire Hathaway added $10B to its GOOGL stake in June 2026, bringing the position to ≈$31.1B (CNBC).
Still ahead, inside the option's life
- ≈September 21, 2026 — EU DMA search-redesign compliance deadline.
- September–October 2026 — iPhone 18 / iOS 27 ship with Gemini-powered Siri, the first mass-market proof point for Gemini outside Google's own apps.
- ≈October 27–28, 2026 — Q3 2026 earnings, the only print inside this expiry. Watch Cloud growth against the brutal 82% comp, the backlog versus $514B, capex versus the $195–205B guide, and whether FCF is negative for a second straight quarter.
- Q4 2026 — D.C. Circuit oral argument on the U.S. v. Google search case (both Google's appeal and the DOJ's cross-appeal seeking Chrome divestiture).
- ≈February 3, 2027 — Q4/FY2026 earnings and first FY2027 capex guidance — after this option expires.
Analyst backdrop
Consensus price targets cluster at ≈$420–428 across 63–83 analysts, with zero Sell ratings and short interest at just 0.64% of shares outstanding (StockAnalysis). Worth stating plainly: if that consensus is right, this spread loses money — the $410 strike sits below the average price target, and full consensus would push GOOGL past this trade's breakeven of $397.08 and toward its max-loss zone.
🎲 Reading This Trade — Four Investor Lenses
🎰 YOLO Trader
This isn't your trade. Max profit is capped at $7.08/share — there's no lottery-ticket upside here, and replicating it in naked form (selling the $390 call alone, without buying the $410 call) turns a defined $10.0M max loss into an unlimited one. If you want to express a "this rally is stretched" view aggressively, a small, defined-risk debit put spread is a more honest way to do it than fading a mega-cap uptrend with naked calls.
🏄 Swing Trader
Worth watching the $380–$400 zone — that's where the nearer-dated gamma resistance clusters sit today, and it roughly frames where this desk chose its strikes. A rejection near $390 or a clean break above $400 both say something about whether the market agrees with this package's thesis, even though your trading horizon is shorter than January 2027.
💰 Premium Collector — the natural fit for this structure
This is exactly the shape of trade this reader runs, just at institutional size. The lesson to take: they collected $7.08 of premium on a $20-wide spread (≈35% of the width) for roughly 5.5 months of exposure, with the short strike ≈5.5% out-of-the-money. A retail-sized version — selling a call ≈5% OTM and buying protection ≈11% OTM in the same expiry — is a reasonable, capped-risk way to harvest premium on a stock that's already run 19% YTD, as long as you're honestly comfortable capping upside at $410 and can stomach a defined max loss if GOOGL keeps climbing.
🌱 Beginner
This is a clean textbook example of a bear call spread (call credit spread): sell a call, buy a further-out call in the same expiration to cap risk, collect the difference in premium as your maximum profit. Your maximum loss is fixed the moment you put the trade on (strike width minus credit received) — you will never lose more than that, which is the entire appeal versus selling a naked call. The trade-off is that your profit is also fixed and modest relative to the capital tied up.
⚠️ Risk Factors & Honest Limits
- Max loss is $10.0M, and it is reached quickly — once GOOGL trades above $410 at expiry, losses are capped but already at their worst; there's no further "it could always get worse" scenario, but $10.0M is still a large, real number relative to the $5.49M collected.
- The breakeven ($397.08) sits below Wall Street's own consensus price targets (≈$420–428). If analyst consensus is directionally correct over the life of this option, this specific position loses money. That tension is the honest risk here — the trade is betting against the crowd's base case, not with it.
- The $410 leg's open/close status is unprovable today. We do not know whether this is fresh protective buying or someone closing an old short call. That materially changes the read on conviction, and only tomorrow's OI resolves it.
- The tape cannot tell us who did this or why. We don't know if this sits against an existing long GOOGL stock or call position (a "cap some upside, collect income" overlay) or stands alone. We don't know the broker, the counterparty, or whether this is one piece of a larger, invisible book.
- The dominant 2027 catalyst — FY2026 capex guidance — lands after this option expires. Anyone holding this spread to expiration gets the risk-building (capex raises, negative FCF, halted buybacks) without the resolution (FY2027 guidance) that would tell us whether the bear case is right.
- Gamma levels shown here are current and will keep shifting between now and January 2027 as new options trade — don't treat today's $390/$400/$410 walls as fixed markers five and a half months out.
Disclaimer: Options trading involves substantial risk of loss and may not be suitable for all investors. This analysis is for educational purposes only and is not financial advice. Multi-leg spreads like this one carry defined but real risk of loss up to the stated maximum; retail traders should size any position — especially uncovered or partially-covered short options — well within their risk tolerance and understand margin requirements before attempting to replicate institutional structures. Past performance and institutional positioning do not guarantee future results.
Last updated: August 4, 2026 — next-day OPRA open-interest resolution added (✅ RESOLVED box above). Original analysis published August 3, 2026.