🧊 GXO $7.47M "SELL CALL" Print Looks Bearish — It's Actually a Delta-Neutral Financing Trade
📅 2026-07-31 | 🔥 Unusual Activity Detected
✅ UPDATE — August 3, 2026 pre-market: the OI check is in and it confirms a fully fresh open. Open interest went 3,001 → 10,004 (+7,003) against a 7,000-lot print — we predicted ≈10,001 for the full-open case and it printed 10,004. Not one contract was an existing position unwinding. See the ✅ RESOLVED box.
🎯 The Quick Take
Someone sold 7,000 deep-in-the-money $40 calls on GXO Logistics for a $7.47M credit — and in the same second, a 700,000-share block of GXO stock printed at the exact same price. Run the math and the two legs cancel each other out almost completely. This is not someone betting against GXO into next week's earnings. It's a cash-management trade, and we're going to show you exactly how to spot the tell yourself. 👀
📊 Company Overview
GXO Logistics (GXO) is the world's largest pure-play contract logistics provider — it runs outsourced warehouses, fulfillment centers, and dedicated transport networks for blue-chip customers, rather than owning trucks and planes itself. Spun out of XPO in August 2021, 2026 marks its fifth year as a public company.
- Market Cap: ≈$5.79 Billion
- Sector / Industry: Industrials — Integrated Freight & Logistics
- Current Price: ≈$50.25–$50.50
- 52-Week Range: $45.40 – $66.85
- Trailing P/E: ≈44.0 | Forward P/E: ≈16.3
The bulk of GXO's revenue is now earned in Europe following the Wincanton acquisition, making European retail/consumer volumes and FX a real swing factor in every quarter.
💰 The Option Flow Breakdown
📊 What Just Happened — The Tape
| Time | Symbol | Buy/Sell | Call/Put | Expiration | Premium | Strike | Volume | OI | Size | Spot | Option Price | Option Symbol |
|---|---|---|---|---|---|---|---|---|---|---|---|---|
| 12:58:42 | GXO | SELL | CALL 🤝 BLOCK CROSS | 2026-08-21 | $7.47M | $40 | 7,000 | 3,001 | 7,000 | $50.50 | $10.67 | GXO20260821C40 |
| 12:58:42.666 | GXO (stock) | BUY (paired) | — | — | ≈$35.35M notional | — | 700,000 sh | — | 700,000 | $50.50 | — | equity block |
Both legs printed in the SAME SECOND — 12:58:42.666 for the stock block, milliseconds behind the option cross. That's not a coincidence; it's a package.
The math that matters:
- Spot at the print: $50.50. Strike: $40. Intrinsic value of the call = $50.50 − $40.00 = $10.50.
- The call sold for $10.67. Subtract the intrinsic and the entire time-value component being sold is $0.17 — seventeen cents.
- The short call carries ≈−662,480 shares of delta (7,000 contracts × 100 × ≈0.9464 delta). The stock leg is +700,000 shares.
- Net directional exposure: +37,520 shares, roughly 5% of the package's stock-leg size and under $2M of notional on a $35M+ package. That's about as close to flat as a real-world block trade gets.
🤓 What This Actually Means — Plain English
Here's the correction that matters most in this whole article: a "SELL CALL" headline does NOT automatically mean someone is bearish.
When you see a deep-in-the-money call — one where almost the entire premium is just intrinsic value, with barely any time value left — sold at the exact same moment as a matching block of the underlying stock, the two pieces cancel each other out. The option seller's short-call delta is offset almost dollar-for-dollar by the long-stock delta. Put them together and you get a position with no real opinion on which way GXO goes.
The tell you should memorize: deep-ITM call + almost no time value + a same-second stock block = financing, not opinion. Whenever you see that combination, don't read it as a directional bet — read it as someone renting out their stock position for a fee.
So what IS this, if not bearish? The most likely read is a delta-one financing / buy-write-style package (also sometimes called a conversion) — someone (likely a market-making or arbitrage desk, or an institution managing a large stock position) is effectively earning $0.17 per share of time value over 21 days on a $50.50 stock. That works out to:
- ≈0.34% for the 21-day window
- ≈5.9% annualized carry
That's a financing yield, not a market call. It's the options-market equivalent of a repo trade — someone parking a large stock position and collecting a small, contractually-locked spread for doing so, largely insulated from whether GXO goes up or down between now and August 21.
Order type: the CSV classifier labels this STO (sold to open, on the option leg) with HIGH confidence on the mechanism — the single-leg cross and the same-second 700,000-share qualified-contingent-trade stock block are both directly provable from the tape. What is NOT provable: who initiated the trade, who the counterparty on either leg is, or whether this desk already owned the 700,000 shares beforehand or bought them fresh as part of the package. Those are structural facts we can see; the identity and motive behind them are not visible in OPRA or NMS data.
✅ RESOLVED — A Fully Fresh Open. We Named the Number and It Hit It.
Size (7,000) was bigger than prior open interest (3,001) — a margin of 3,999 contracts — so at least 3,999 contracts had to be brand new. What we could not say was whether the rest was new too, or existing holders closing out against the print. We laid out three explicit scenarios. The August 3 pre-market OPRA snapshot landed squarely on the first one:
| Leg | Baseline OI (Jul 31 snap) | Predicted (full-open case) | Resolving OI (Aug 3 snap) | Δ | Print size | Δ as % of print | Verdict |
|---|---|---|---|---|---|---|---|
| Aug-21-2026 $40 Call (sold) | 3,001 | ≈10,001 | 10,004 | +7,003 | 7,000 | ≈100.0% | ✅ OPEN (STO) — fully fresh |
We wrote that "OI rises toward 10,001 (3,001 + 7,000) → confirms this was essentially a fully fresh open." It printed 10,004 — three contracts above the arithmetic ceiling of a perfectly clean open, which is ordinary lit trading in the strike. Not one contract of the 7,000 was an existing position unwinding. The partial-open and OI-falls scenarios are both dead.
Because the package is delta-neutral, this resolution changes the size of the financing position, not its direction — there was never a bullish-vs-bearish flip waiting in this data, and there isn't one now. What it does establish is that the financing structure is twice the size of anything that existed at this strike beforehand, and all of it is new.
📈 Technical Setup / Chart Check-Up
YTD Performance
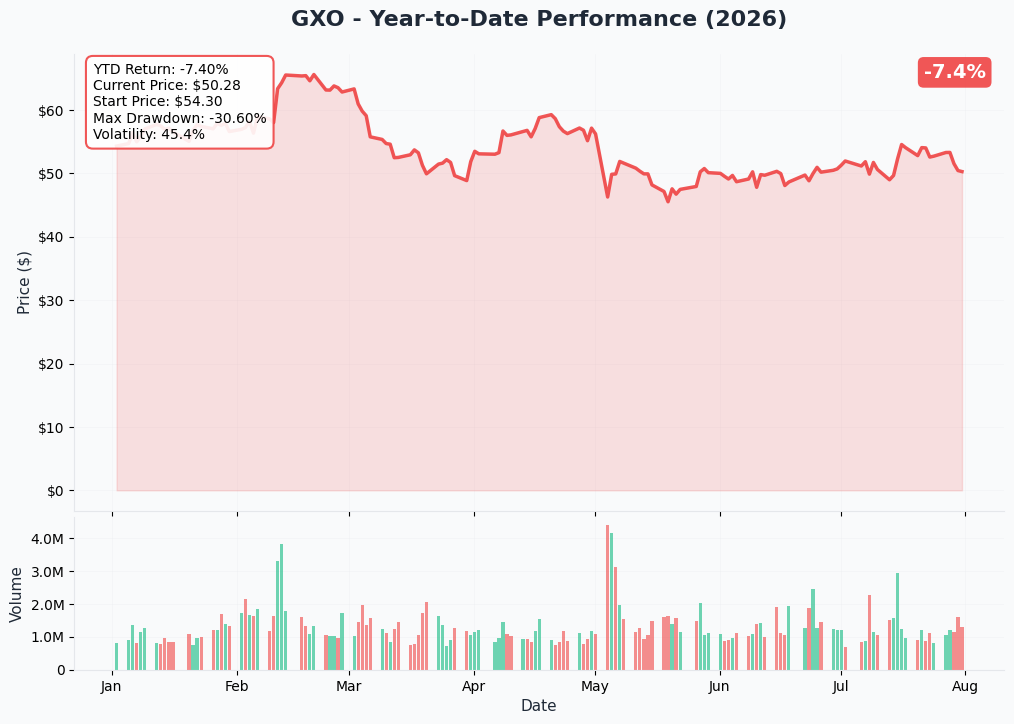
GXO trades in the bottom quartile of its 52-week range ($45.40–$66.85), sitting near ≈$50.25–$50.50 after round-tripping a mid-July rally back down. The dominant scar on this chart is the ≈13% single-day drop on May 4, 2026, when Amazon's Supply Chain Services launch overshadowed a genuine Q1 beat-and-raise.
Gamma-Based Support & Resistance — Honestly Thin
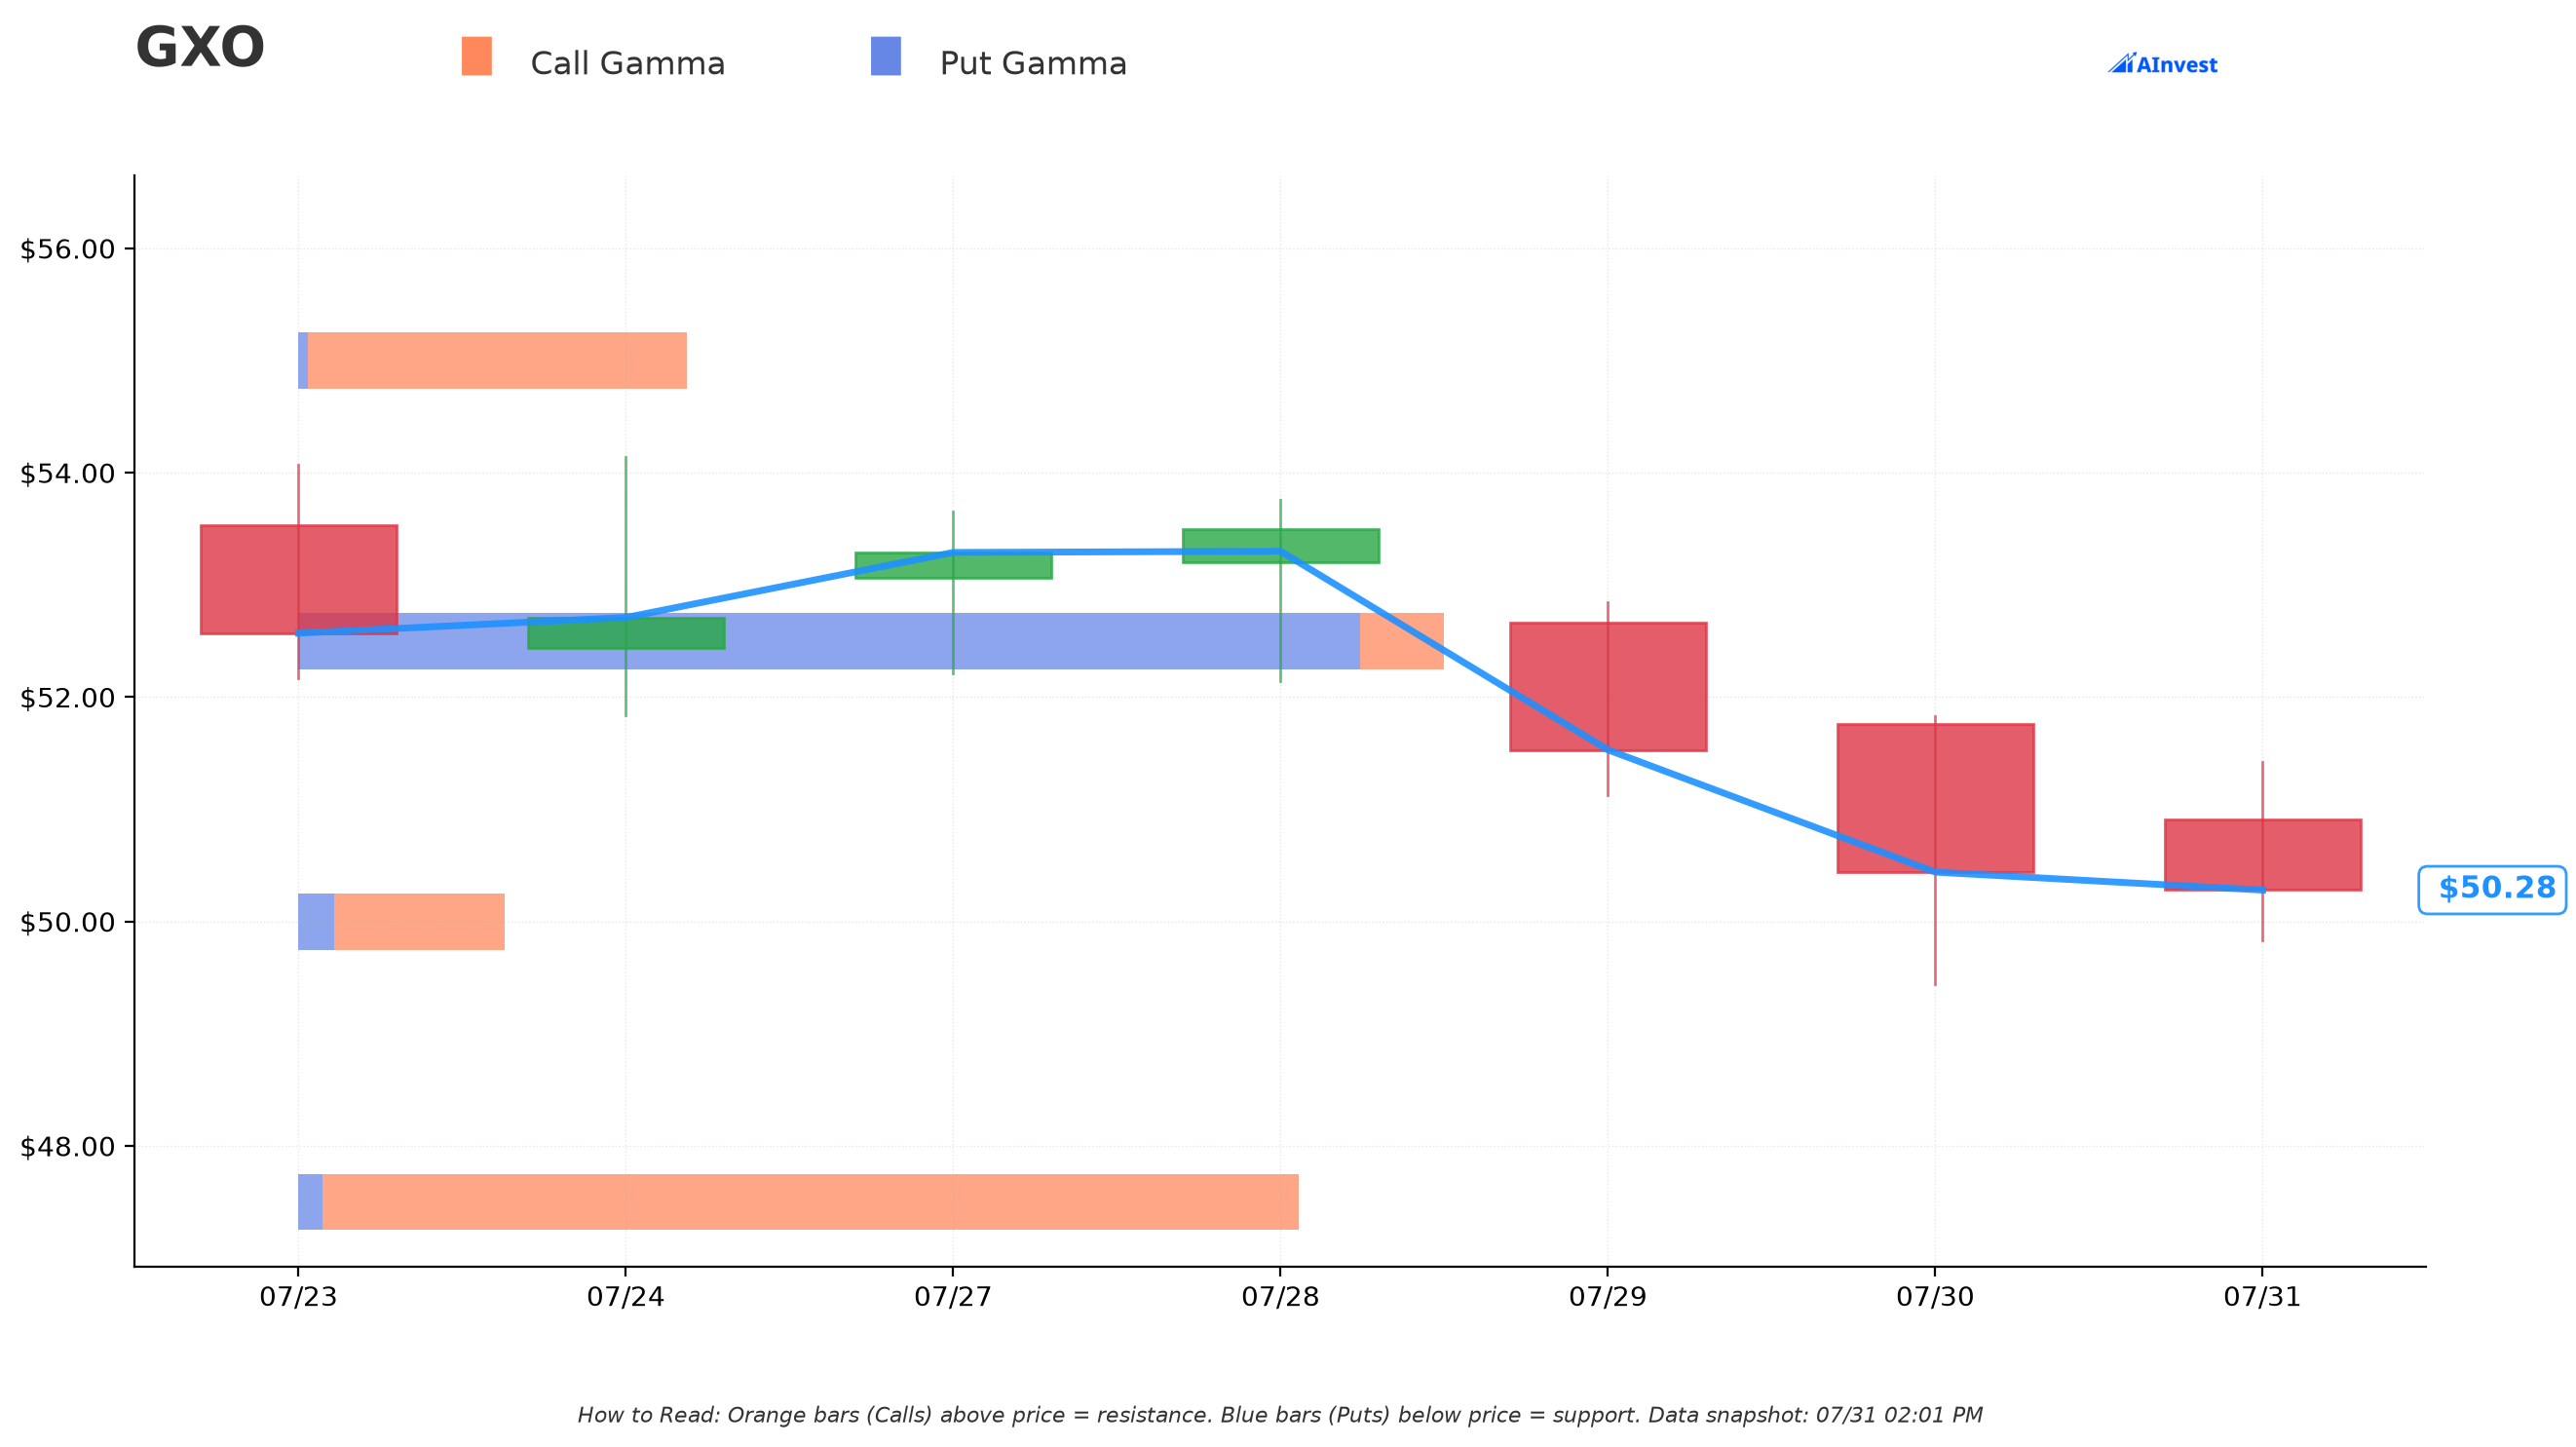
We're not going to pretend this is a clean gamma map — it isn't. GXO's tracked gamma structure covers only 8 strikes from $42.50 to $60, and it doesn't even reach down to the $40 strike where today's trade happened — the gamma data simply doesn't extend that far below spot. That itself is telling: dealers don't carry meaningful gamma risk on that deep-ITM strike, which is consistent with this being a financing trade rather than a position anyone is actively hedging against price moves.
What IS on the map, read honestly:
| Strike | Call Gamma | Put Gamma | Net | Read |
|---|---|---|---|---|
| $45.00 | 0.11 | 1.15 | Put-dominant | Below spot, modest support signature |
| $47.50 | 1.59 | 0.04 | Call-dominant | Below spot — unusual, doesn't fit the typical "resistance above" pattern |
| $50.00 (near spot) | 0.28 | 0.06 | Mildly call-dominant | Right at current price |
| $52.50 | 0.14 | 1.72 | Put-dominant, largest total gamma on the board (1.86) | Above spot — also doesn't fit the typical pattern |
| $57.50 | 1.19 | 0.00 | Call-dominant | The closest thing to a conventional resistance level, ≈14% above spot |
Straight talk: the biggest gamma reading on the whole chain sits at $52.50 and it's put-heavy, not call-heavy — that's an inverted signature versus the textbook "orange resistance above / blue support below" pattern. With gamma this thin and scattered across only 8 strikes, we're not going to manufacture a "strong resistance wall" that isn't there. Treat GXO's near-term price action as driven more by the August 4 earnings print than by dealer hedging flows.
Implied Move — What the Options Market Is Actually Pricing
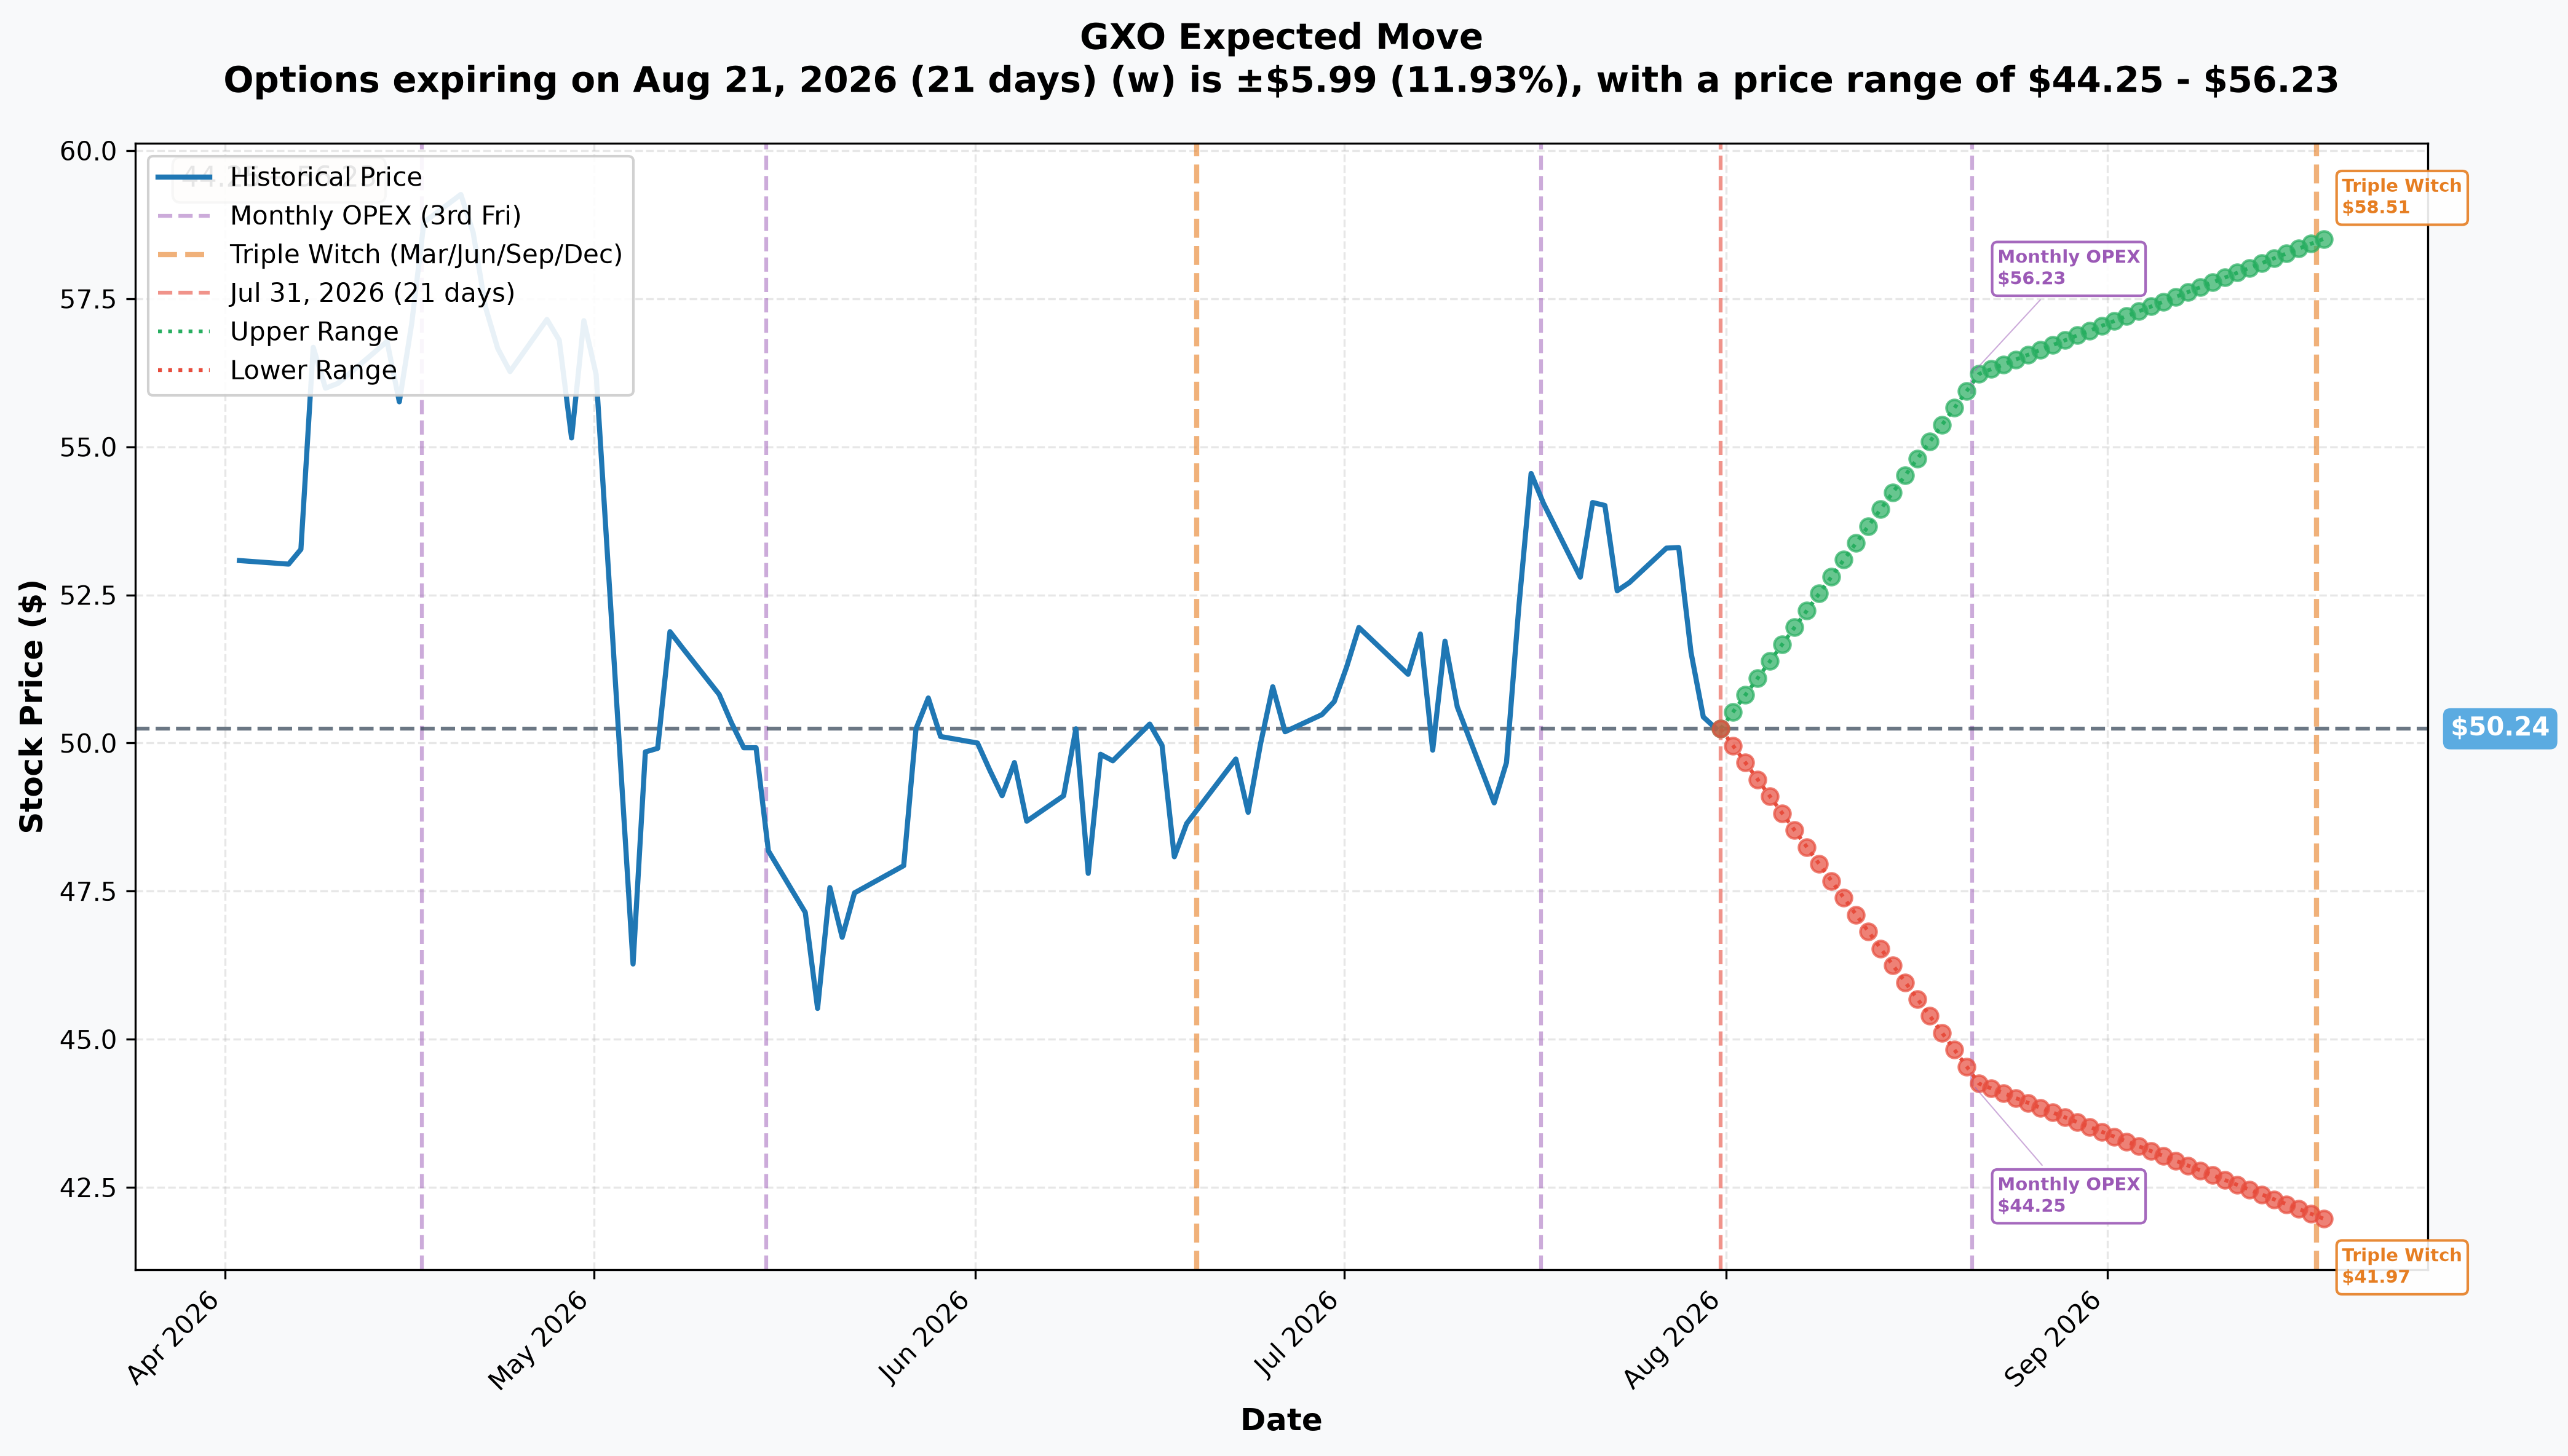
- Monthly OPEX (Aug 21, 2026 — 21 days out, THIS IS THE TRADE'S EXPIRY): ±11.9% (±$5.99) → range $44.25 – $56.23
- Quarterly Triple Witch (Sep 18, 2026 — 49 days out): ±16.5% (±$8.27) → range $41.97 – $58.51
Notice the $40 strike sold today sits below the entire monthly implied-move range — the options market isn't even pricing a routine move down to $40 by August 21. That's consistent with a call this deep ITM behaving almost like stock, not like a lottery ticket. It would take a genuinely disorderly drop — well beyond what's currently priced — for this package's short-call leg to matter more than its stock leg.
🎪 Catalysts
🔥 The One Catalyst That Actually Sits Inside This Contract
GXO reports Q2 2026 results after the close on Tuesday, August 4, 2026, with the conference call Wednesday, August 5 at 8:30 a.m. ET — company-confirmed via StockTitan and Sahm Capital. That's ≈13 trading sessions before the Aug-21 expiry — earnings is unambiguously inside this contract's life.
The irony worth sitting with: because today's package is delta-neutral, whoever put it on is, for now, structured to not care how GXO reacts to that print. They collected their $0.17-per-share carry regardless of whether earnings sends the stock to $44 or $56.
Q2 2026 consensus: Adjusted EPS $0.58 (+1.8% YoY), Revenue ≈$3.45B (+4.6% YoY), per Yahoo Finance/Zacks. Q1 2026 beat consensus by ≈35% (GXO), and FY2026 guidance stands at adjusted EBITDA $935M–$975M / adjusted EPS $2.90–$3.20 (Seeking Alpha).
⚠️ Already Happened — The Overhang This Stock Is Still Digesting
- Amazon Supply Chain Services (ASCS), May 4, 2026 — Amazon's entry into contract-logistics-adjacent services knocked GXO down ≈13% in a single day, per The Motley Fool. CEO Patrick Kelleher pushed back, noting ≈70% of the global contract logistics market remains insourced (FreightWaves). Expect this to be re-litigated on the August 5 call.
- Truist cut its price target $70 → $55 on July 15, 2026 while keeping a Buy rating — a bull materially resetting near-term expectations two-plus weeks before the print (MarketBeat). The same day, Citizens JMP initiated coverage at Market Outperform, $80 (Investing.com) — analyst dispersion on this name is unusually wide right now.
- Wincanton grocery-business divestiture, mandated by the UK Competition and Markets Authority — GXO has already booked two impairments: $37M in Q4 2025 and $21M in Q1 2026 (GXO 10-Q). Watch for a possible third markdown on August 4.
- Takeover chatter exists but is NOT a live process. GXO explored a sale in late 2024, but that process ended, and CEO Kelleher's most recent on-record comment (February 2026) was "I don't want to sell" (Yahoo Finance interview). Trade press continues to speculate (The Loadstar), but treat this as narrative optionality, not a base case — no confirmed live process exists as of 2026-07-31.
🔭 Coming Up After This Contract Expires
- NYSE Opening Bell, August 11, 2026 — CEO Kelleher rings the bell for GXO's fifth public-company anniversary (GlobeNewswire); falls inside the Aug-21 window, ceremonial/low-magnitude.
- 2026 Investor Day, November 16, 2026, at the NYSE — the single largest re-rating catalyst on the horizon, where a new CEO and CFO will present long-term strategy and financial targets (QuiverQuant). Outside this contract's window.
🎲 Reader Interpretations — Four Angles
🎰 YOLO Trader
There is genuinely nothing here to YOLO into. This isn't a $7.47M directional bet you can piggyback — it's a hedged package with ≈$2M of residual exposure on a $35M+ notional stock leg. If you're looking for a lottery ticket on GXO earnings, this print isn't giving you one; you'd have to build your own speculative position (e.g., a small at-the-money straddle into August 4) rather than copy this trade.
🌊 Swing Trader
The genuinely useful information here is the implied move: the market is pricing an 11.9% swing by August 21 ($44.25–$56.23), with earnings landing ≈13 sessions before expiry. If you want to trade GXO's earnings reaction directionally, this cross tells you almost nothing about which way to lean — use the catalyst research (Amazon commentary, guidance reaffirm/cut, a possible third Wincanton impairment) to form your own view, and size for a move that could realistically retest either the $44 or $56 zone, echoing the ≈13% single-day move GXO already made once this year.
💰 Premium Collector
This is the section where the lesson really lands. A real retail buy-write (covered call) sells time value against stock you own to generate income — and the yield comes from time value, which decays as expiration nears. Here, the seller collected essentially zero time value ($0.17 out of $10.67, or about 1.6% of the premium) because the call was deep ITM. What they actually captured is a financing spread, not an options-selling yield. If you're a premium collector trying to learn from this, don't try to replicate a $0.17 deep-ITM print — that's an institutional balance-sheet trade with economics (financing costs, stock-loan rates, execution access) retail accounts don't have. A real covered call for income means selling a strike with meaningful extrinsic value, typically near or slightly above the current price, where you're actually being paid to take on assignment risk — not seventeen cents to offload almost none.
🌱 Beginner
Here's the single most important thing to take from this whole article: big premium numbers on a screenshot don't always mean what they look like they mean. "$7.47M SELL CALL" sounds bearish on its face. But once you see the same-second stock block, the picture flips to "someone collecting a small fee, largely indifferent to direction." Before you ever act on a single flagged options print — yours or ours — ask: is this a lone directional bet, or is there a stock leg hiding right next to it? That question alone will save you from misreading a lot of "unusual activity" headlines.
⚠️ Risk Factors & Honest Limits
- We cannot see who initiated this trade, or on which side. The tape proves the pairing (same second, same price, QCT-marked); it does not prove intent, ownership history of the 700,000 shares, or whether either side of the package was pre-existing.
- We cannot prove the exact new-open-interest amount yet. Size (7,000) exceeds prior OI (3,001), so at least 3,999 contracts must be new — but the actual OI print tomorrow could land anywhere between a partial rise and the full 7,000, depending on whether any existing holders closed against this print.
- The stock leg's 700,000 shares could belong to anyone — a market maker, an arbitrage desk, or a large existing holder monetizing part of a position. OPRA and the equity tape show the trade, not the identity or the broader portfolio behind it.
- This package is delta-neutral TODAY, not necessarily forever. As GXO's price moves, the option delta on a $40 strike will shift, and the package's net exposure will drift from the ≈flat state we calculated at the moment of the print.
- Do not trade off this print. There is no directional signal embedded in a delta-neutral cross. If you're forming a GXO view into the August 4 earnings report, build it from the fundamentals and catalysts above — not from this trade.
🎯 The Bottom Line
Here's the deal: a screenshot that reads "SELL CALL $7.47M" looks bearish, and a naive read would call it one. The tape says otherwise. A deep-ITM call selling for almost no time value ($0.17 out of $10.67), crossed in the same second as a matching 700,000-share stock block, is a financing trade, not a market opinion. The residual directional exposure is roughly +37,520 shares — about 5% of the package, essentially flat.
The real lesson for your own trading: the next time you see a "SELL CALL" or "BUY PUT" headline number, check whether the strike is deep in-the-money and whether there's almost no time value left in the premium. If both are true, go looking for a same-second stock print before you assume direction. That habit will keep you out of a lot of false "bearish whale" headlines.
Mark your calendar:
- 📅 August 4, 2026 (after close) — Q2 2026 earnings, the real catalyst inside this contract's life
- 📅 August 5, 2026, 8:30 a.m. ET — earnings call
- 📅 August 21, 2026 — this contract's expiry
- ⏳ Tomorrow, ≈06:30 ET — next-day OI snapshot resolving how much of today's 7,000 contracts was genuinely new
Disclaimer: Options trading involves substantial risk of loss and is not suitable for all investors. This analysis is for educational purposes only and not financial advice. The reads described here (delta-one financing, package intent) are inferred from provable tape facts — same-second pairing, strike/spot math, and delta — but the identity, motive, and full portfolio context of the counterparties are not observable from public market data. Always do your own research and consider consulting a licensed financial advisor before trading.
Last updated: 2026-08-03 — next-day OPRA open interest confirmed a fully fresh OPEN (OI 3,001 → 10,004, +7,003).