🛡️ HNI $2.5M Bull Call Spread — The Screenshot Showed a $3M Call Buy, the Tape Shows a Disciplined Bet to $50
📅 July 31, 2026 | 🔥 Unusual Activity Detected
✅ UPDATE — August 3, 2026 pre-market: the OI check is in and both legs matched the print size exactly. The $40 call went 0 → 5,434 and the $50 call 0 → 5,434 — 100.0% on both, the cleanest resolution on the entire July 31 board. See the ✅ RESOLVED box.
🎯 The Quick Take
The scanner flagged a ≈$3 million call buy in HNI Corporation — but a full scan of the option tape at the exact same millisecond found a second leg the screenshot never showed. This is actually a $2.50 million net-debit bull call spread, buying the September $40 call and selling the September $50 call, and both strikes had zero prior open interest, meaning every single contract traded today is a brand-new position. It's one of the smallest tickets on today's board, but it's also one of the cleanest — a defined-risk, provably-opening bet that HNI grinds higher into mid-September, capped at $50.
📊 Company Overview
HNI Corporation (NYSE: HNI) is a Muscatine, Iowa-based industrials company built on two very different businesses:
- Workplace Furnishings — office furniture and seating sold under the HON, Allsteel, and Gunlocke brands, now supercharged by the Steelcase acquisition that closed in December 2025. This segment posted +157% year-over-year revenue growth to $1.32B in Q2 2026, almost entirely acquisition-driven.
- Residential Building Products — hearth and fireplace products (gas, wood, and electric fireplaces, inserts, and stoves) sold through Hearth & Home Technologies under the Heat & Glo, Heatilator, Vermont Castings, and Harman brands.
Key stats: market cap ≈$3.1 billion, Industrials sector (Commercial Services & Supplies / furnishings industry), trading ≈$44.50, dividend yield ≈3.2% (quarterly dividend raised to $0.35/share in May 2026). This is a small/mid-cap name with limited Wall Street coverage — worth keeping in mind for everything that follows, because thin coverage often comes paired with a thin options market, and that turns out to matter a lot here.
💰 The Option Flow Breakdown
📊 What Actually Printed
A full-chain scan across four expiries at 15:22:14.48 turned up exactly two prints, both size 5,434 — a spread, not an outright call buy.
| Time | Symbol | Buy/Sell | Call/Put | Expiration | Premium | Strike | Volume | OI | Size | Spot | Option Price | Option Symbol |
|---|---|---|---|---|---|---|---|---|---|---|---|---|
| 15:22:14 | HNI | BUY | CALL | 2026-09-18 | $2.99M | $40 | 5,434 | 0 | 5,434 | $44.46 | $5.51 | HNI20260918C40 |
| 15:22:14 | HNI | SELL | CALL | 2026-09-18 | $494K | $50 | 5,434 | 0 | 5,434 | $44.46 | $0.91 | HNI20260918C50 |
🤝 BLOCK CROSS — this printed as a negotiated multi-leg cross, meaning a broker matched a known buyer and seller off the open book. It's not an aggressive sweep lifting offers in the lit market — it's a pre-arranged package.
- 💸 Net debit: $4.60/share = $2.50M ($2,994,134 paid for the $40 calls, minus $494,494 collected for the $50 calls)
- 🎯 Breakeven: $44.60 — almost exactly where the stock was trading at the print ($44.46)
- 🏆 Max value at expiry: $5.43M (the full $10 strike width), for a max profit of $2.93M — but only if HNI closes at $50 or higher on September 18, roughly 12.5% above the print-time spot
✅ RESOLVED — Both Legs Opened, to the Exact Contract
Both legs printed against a prior open interest of exactly zero. Neither the $40 strike nor the $50 strike existed on HNI's option chain before this trade — nobody held a single contract of either one coming into that session. The August 3 pre-market OPRA snapshot came back at precisely the print size on both legs — a 100.0% match, the cleanest resolution on the entire July 31 board:
| Leg | Baseline OI (Jul 31 snap) | Resolving OI (Aug 3 snap) | Δ | Print size | Δ as % of print | Verdict |
|---|---|---|---|---|---|---|
| Sep-18-2026 $40 Call (bought) | 0 | 5,434 | +5,434 | 5,434 | 100.0% | ✅ OPEN (BTO) |
| Sep-18-2026 $50 Call (sold) | 0 | 5,434 | +5,434 | 5,434 | 100.0% | ✅ OPEN (STO) |
Two strikes that did not exist, now holding exactly the traded size and not one contract more. There is no transfer component, no partial close, no ambiguity of any kind — this is what a textbook fresh spread looks like in the open-interest record.
What's worth watching from here isn't whether it opened — that's settled — it's whether the position gets held into September or closed out early for a quick profit if HNI keeps grinding higher.
🤓 What This Actually Means — Plain English
Here's the honest translation: someone wanted to be long HNI into mid-September, but instead of just buying calls outright, they sold away the upside above $50 to cut their cost. That's the whole trade.
- 🟢 BTO (Buy to Open) 5,434 × $40 calls — this is the long leg. It's deep in the money (stock is at $44.46, strike is $40), so it behaves a lot like owning the stock itself, just with leverage and a hard floor on the loss.
- 🔴 STO (Sell to Open) 5,434 × $50 calls — this is the short leg. By selling this call, the trader collected $494,494 back, which lowered their total cost. The trade-off: if HNI rallies past $50, they don't get to keep those extra gains — the buyer of that $50 call does.
- 🧮 The math: paying $4.60 net for a spread that's worth up to $10 at expiry is a ≈2.2x payoff if HNI finishes at or above $50 on September 18. Below $44.60 (breakeven), the whole $2.50M is at risk. Between $44.60 and $50, profit scales up gradually. Above $50, the payoff is capped — no matter how far HNI runs, this position tops out at $2.93M of profit.
Why cap the upside at all? Because it's disciplined risk management, not indecision. A pure $40 call would have cost the full $5.51 — 20% more expensive — for unlimited upside the trader may not have actually needed. By selling the $50 call, they cut the cost by nearly a fifth and defined their maximum loss up front, in exchange for giving up gains beyond a level they may not expect the stock to reach anyway (September's own implied move tops out around $51.70 — see below). That's a trade built around a specific price target, not a lottery ticket.
On the equity hedge: a 250,000-share stock block printed at $44.00, 25 seconds after the option cross (15:22:39). The option package carries +290,936 shares of delta — in the same ballpark as 250,000 shares, though not an exact match. This is consistent with some kind of hedging or rebalancing activity around the position, but it is not proof of intent — call it an inference, not a fact. It's entirely possible the stock block belongs to a different account or strategy altogether.
📈 Technical Setup / Chart Check-Up
YTD Performance
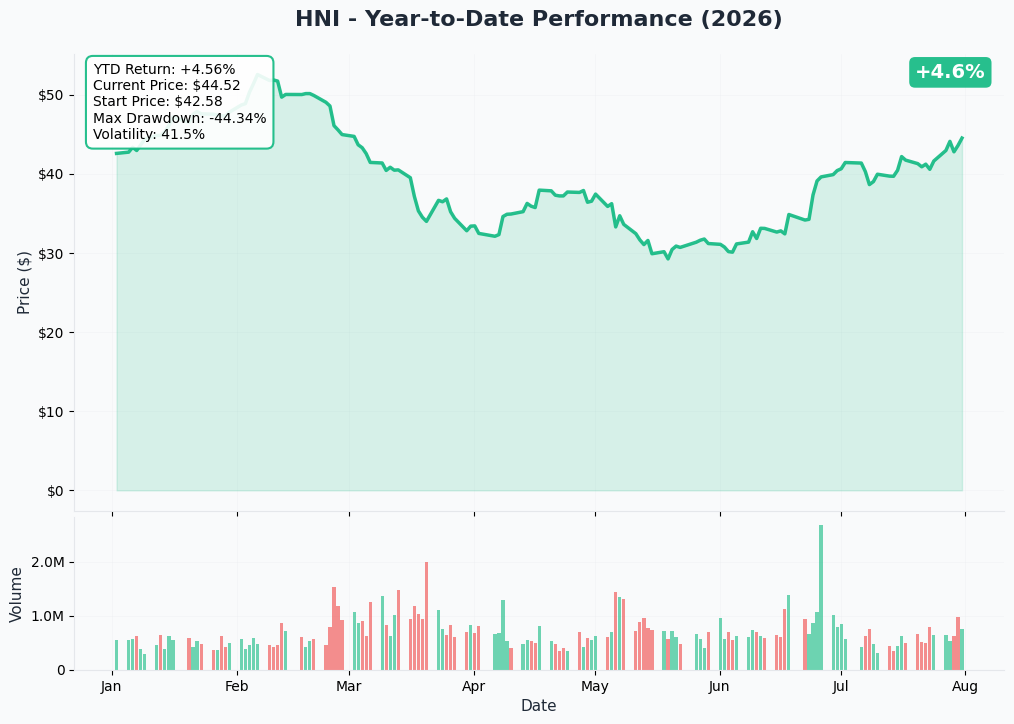
HNI is up ≈4.6% year to date, but that headline number hides a wild ride: the stock started 2026 at $42.58, rallied above $50 by late February, then sold off hard through the spring — a ≈44% max drawdown took it down near $29-30 by early May. From there it clawed back steadily through June and July, closing July 31 around $44.52. Annualized volatility of ≈41.5% confirms this is a name that moves — not a sleepy industrial stalwart.
Gamma-Based Support & Resistance — ⚠️ There Isn't Any Today
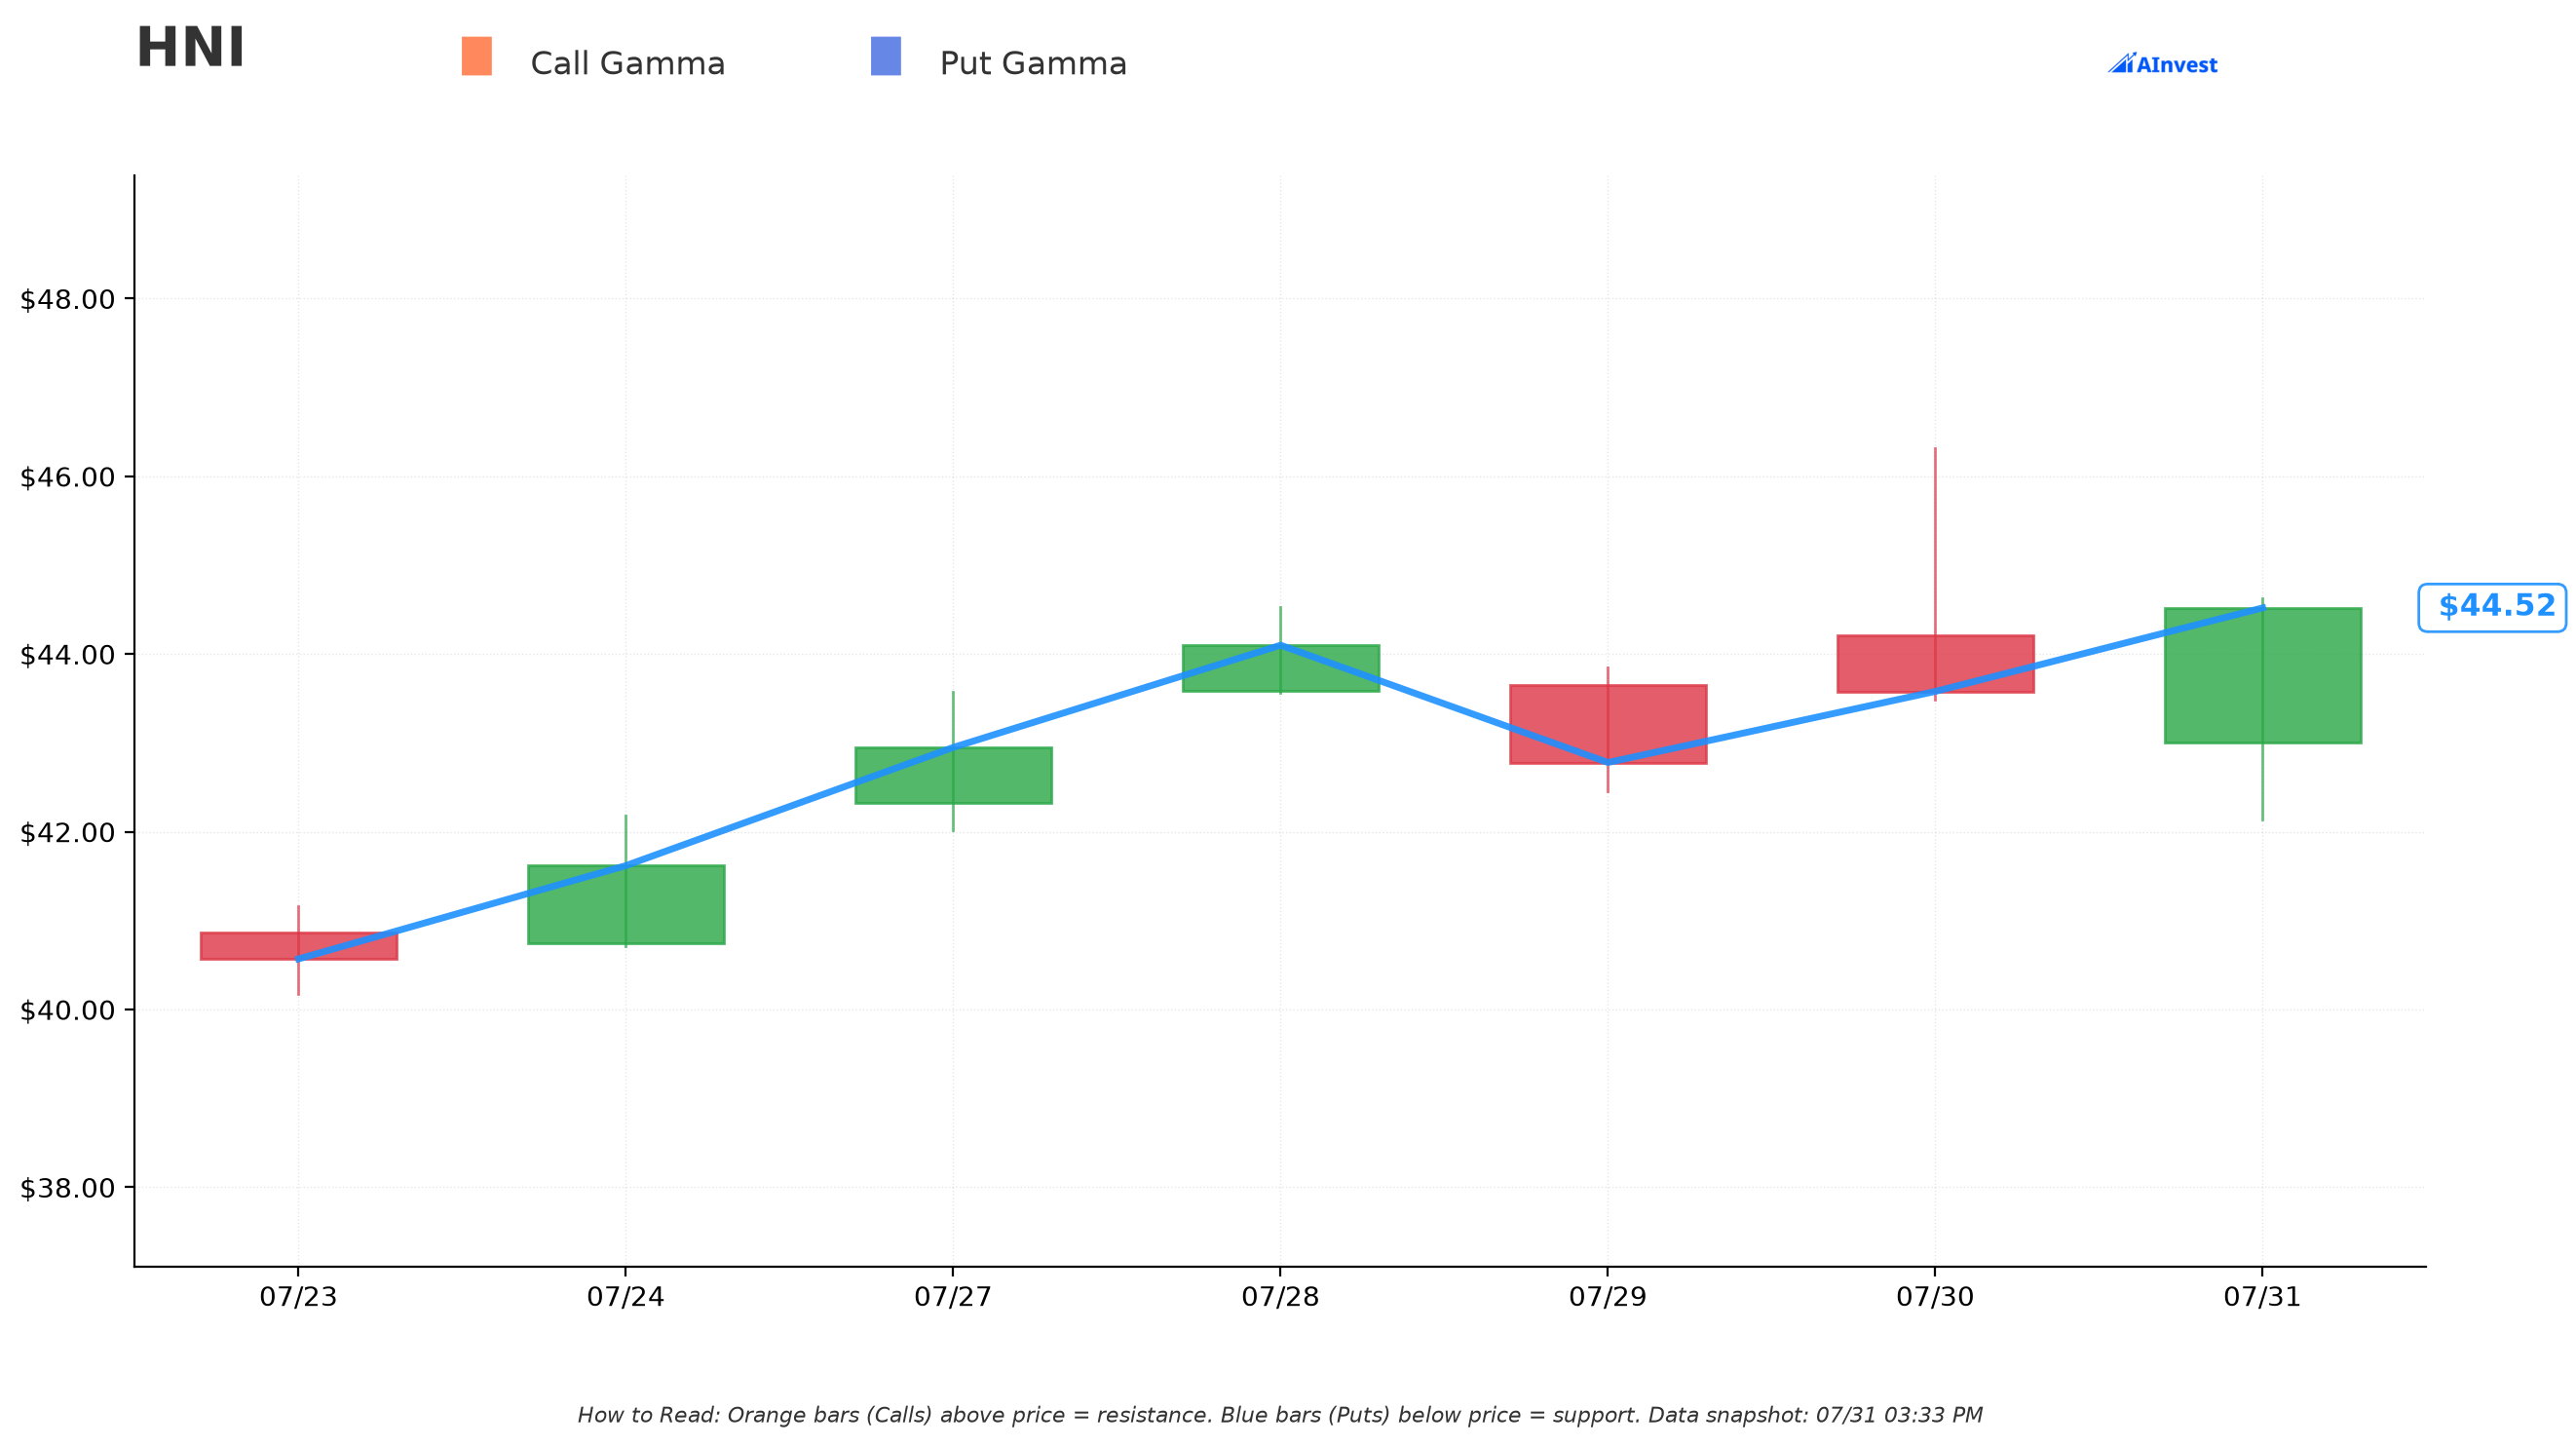
We have to be upfront here: our gamma extract came back with zero strikes and zero gamma walls for HNI. The gex.json output is empty — no support levels, no resistance levels, nothing to map. The chart above shows price candles only, with no orange call-gamma or blue put-gamma bars, because there simply isn't enough open interest spread across enough strikes to build a gamma profile.
That absence is itself the finding, not a technical glitch. HNI's options chain is too thin and too concentrated for a normal dealer-positioning read. Combined with the fact that both strikes in today's spread had zero prior open interest, this tells you plainly: you are trading in a market with almost no existing structure, where a handful of trades (like today's) can represent a meaningful chunk of total open interest at a strike. Do not expect the kind of gamma-wall price magnets you'd see in a name like AMD or SPY.
Implied Move Analysis
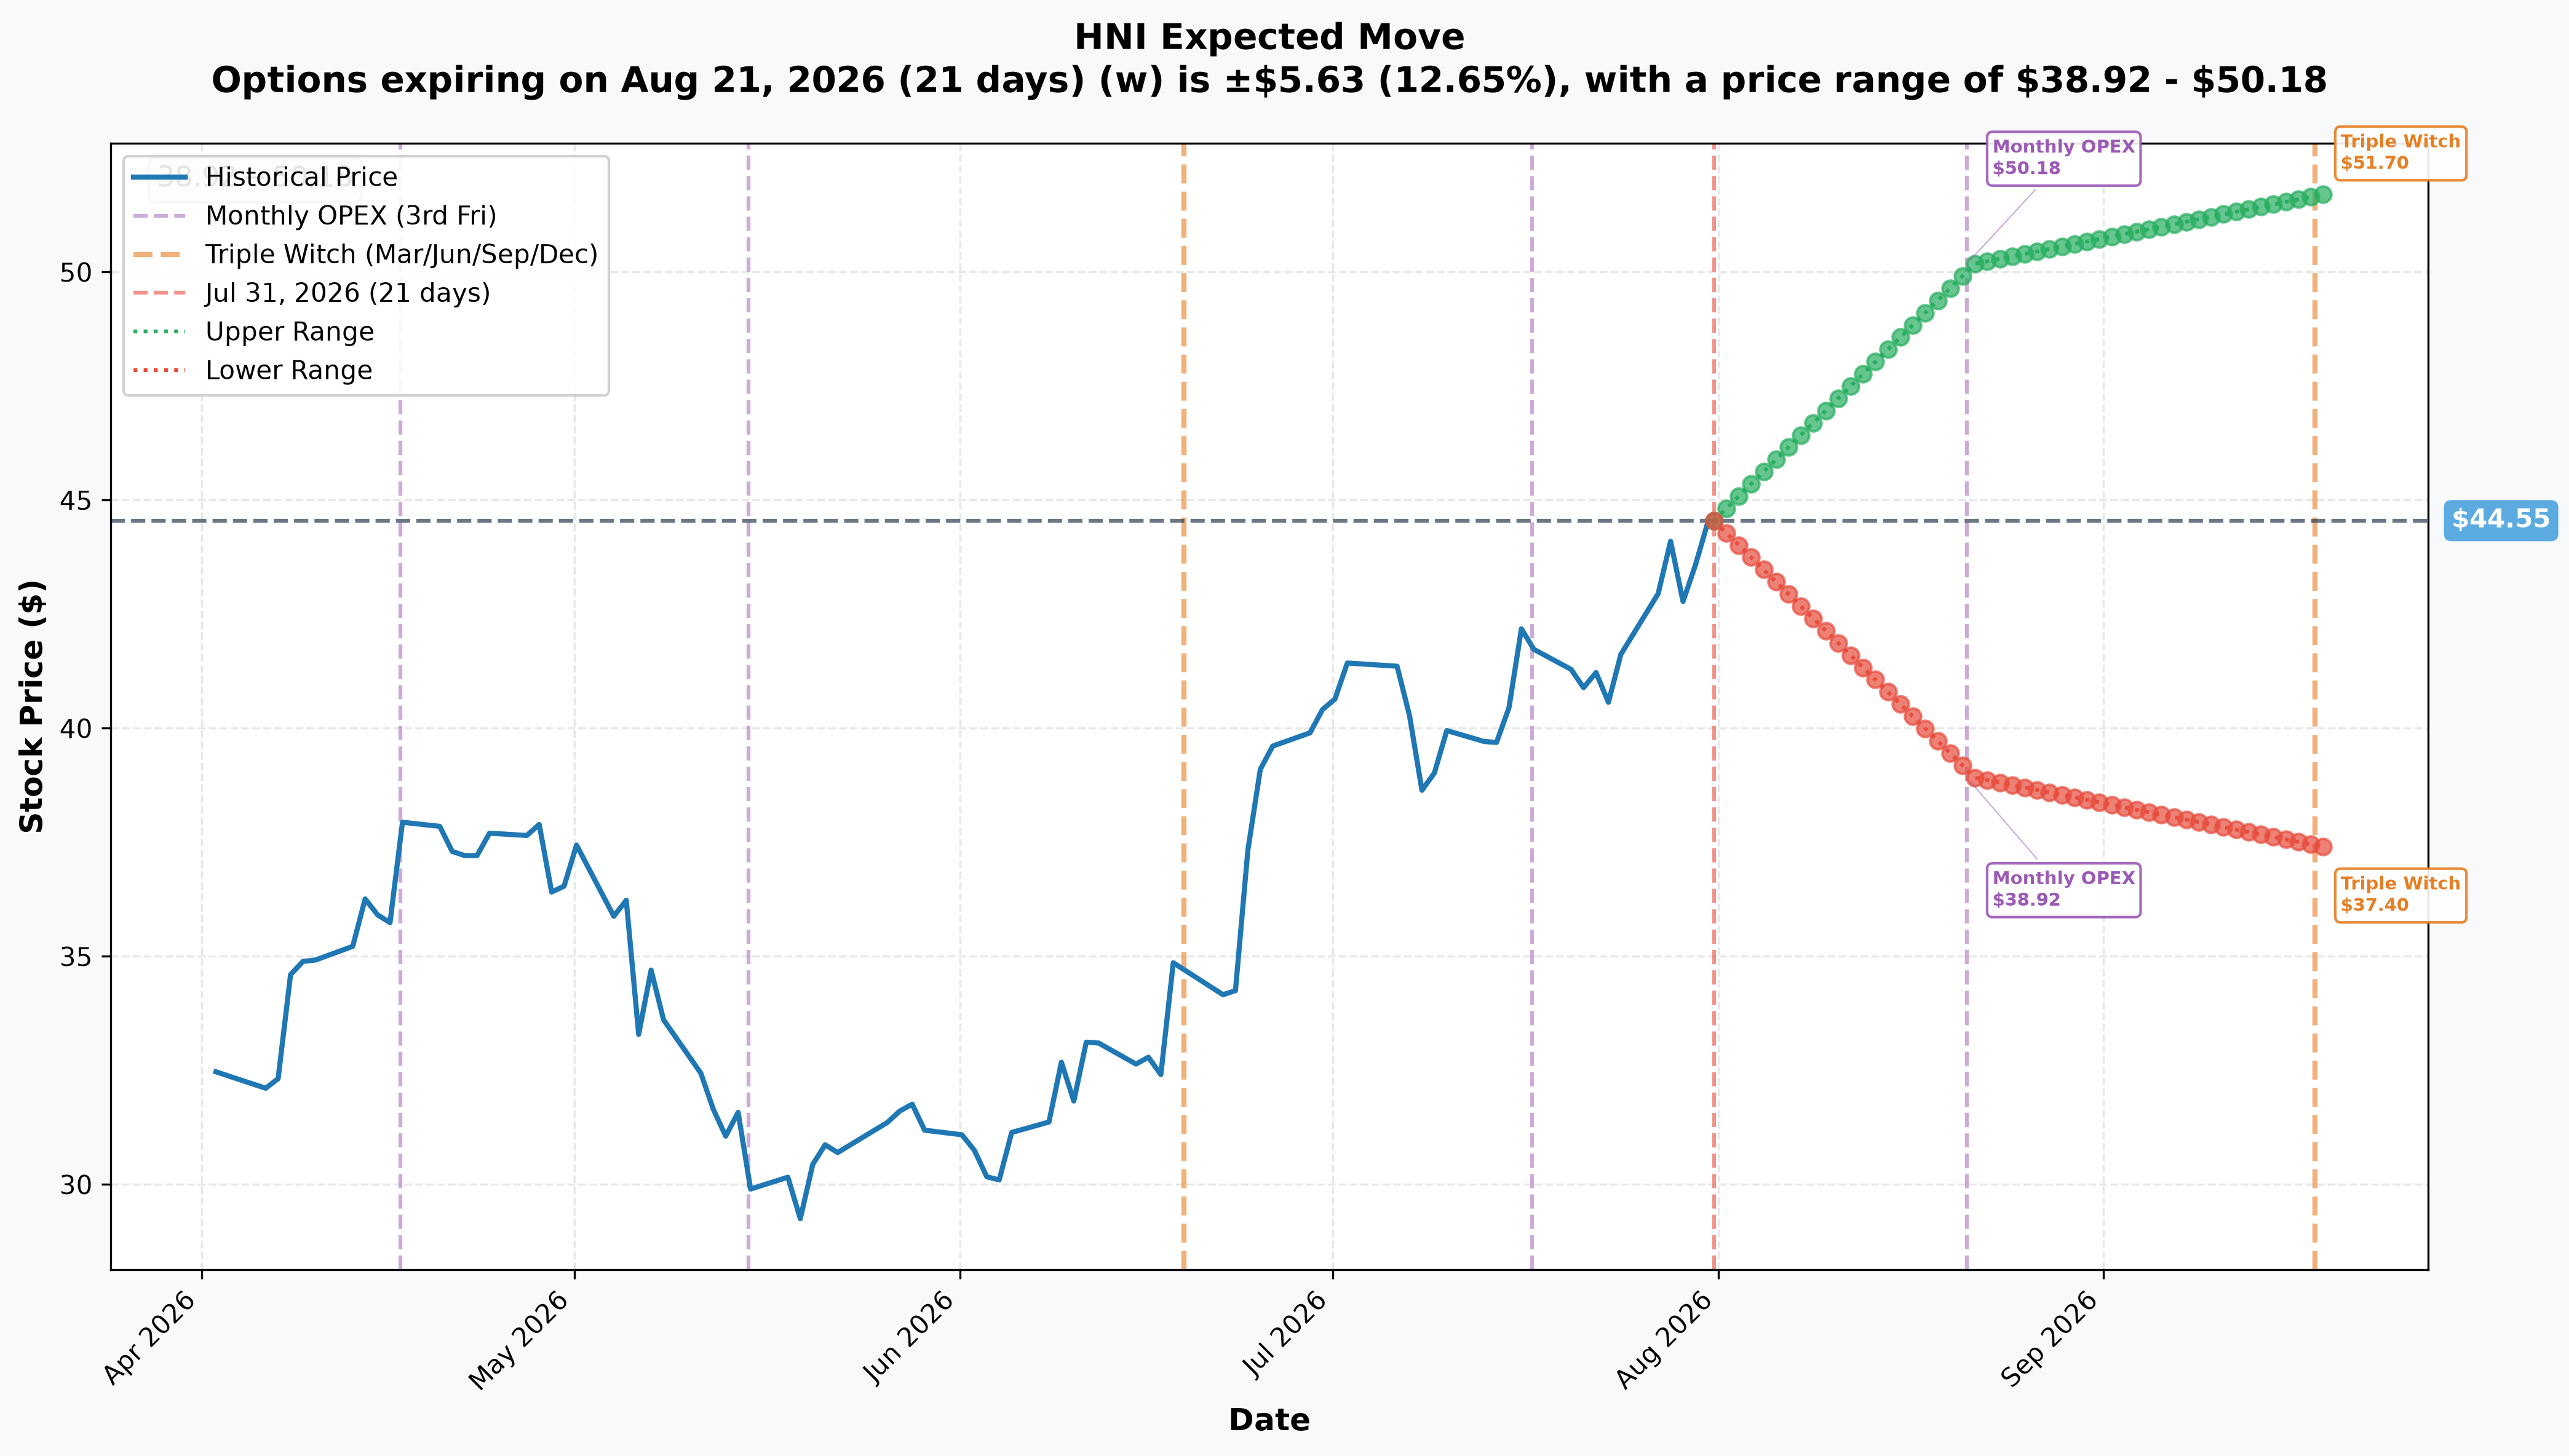
- 📅 Monthly OPEX (August 21, 2026 — 21 days): ±$5.63 (±12.65%) → range $38.92 – $50.18
- 📅 Quarterly Triple Witch (September 18, 2026 — 49 days, same day this spread expires): ±$7.15 (±16.05%) → range $37.40 – $51.70
Translation: the options market is already pricing a one-standard-deviation move for HNI, by this exact expiration date, that runs from $37.40 to $51.70. The $50 strike where this spread caps out sits comfortably inside that implied range — the market itself thinks a move to $50 (and even a bit past it, to $51.70) is a realistic single-standard-deviation outcome by September 18, not a moonshot. That context supports the idea that this was a targeted, math-driven strike selection rather than an arbitrary one.
🎪 Catalysts
✅ Already Happened — Q2 2026 Earnings (July 30, 2026)
HNI reported Q2 2026 results before market open on July 30, 2026 — the session immediately before this trade. Non-GAAP diluted EPS of $1.27 beat consensus of $1.04, but revenue of $1.472B came in just under the $1.48B estimate, even though it was up 121% year-over-year, driven almost entirely by the Steelcase acquisition that closed in December 2025. Workplace Furnishings segment sales jumped 157% to $1.32B, with segment margin up 470 basis points to 20.4%. Organic net sales were roughly flat (+0.1%), which is the softer underbelly of an otherwise strong print. Management raised full-year 2026 guidance to 20–25% non-GAAP EPS growth, citing accelerating second-half momentum and ≈$120M of Steelcase synergies at maturity (StockTitan, MarketBeat).
The stock's reaction tells the real story: HNI popped on the EPS beat but faded through the session on July 30, trading as high as $46.32 before closing at $43.58 — likely the revenue miss and flat organic growth pulling sentiment back. July 31 (today) saw a partial recovery to ≈$44.52, a ≈2.2% bounce (StockTitan, stockanalysis.com).
Because Q2 earnings already happened, this September spread is a post-earnings, structural bet — not an event bet. The trader watched the market digest the beat-and-fade reaction over two sessions and then bought the dip-into-recovery with a defined-risk spread, rather than gambling on an unknown earnings outcome.
📅 Mapped to the Sep-18 Expiry
- Next earnings (Q3 2026): estimated for late October 2026 — ⚠️ not company-confirmed. Aggregators list ≈October 27 (Benzinga), and HNI reported Q3 2025 on October 28, 2025, so late October is a reasonable estimate — but HNI has not issued a date. Either way it falls roughly five weeks after the September 18 expiration. No earnings event sits inside the life of this trade. Whoever put this on doesn't need to worry about a binary earnings gap between now and expiry — it's a clean, catalyst-light window to let a bullish thesis play out.
- Steelcase integration remains the dominant ongoing story for HNI through 2026 — watch for any synergy-realization updates or investor-conference commentary between now and September (GlobeNewswire).
- Consensus analyst rating is "Buy," with an average 12-month price target in the $67.50–$69.00 range (stockanalysis.com) — well above both strikes in this spread, though with the caveat that HNI carries thin analyst coverage and price targets on small-caps like this should be treated skeptically.
🎲 Reading the Trade Four Ways
🚀 YOLO Trader
This spread is already about as disciplined as it gets — there's not much of a "YOLO" version to layer on top without abandoning the defined-risk structure that makes it interesting. If you wanted to press this thesis harder, an outright $40 call alone would cost more (20% more per the numbers above) for uncapped upside — but on a chain this thin, with a $2.50-wide bid/ask on the $40 strike alone, that's a much worse execution environment than it looks on paper. Tread carefully.
⚖️ Swing Trader
This is the natural audience for a trade like this. A smaller version of the same $40/$50 September call spread lets you participate in a HNI move toward $50 with a known, capped max loss and a specific price target already validated by the options market's own implied range. Just expect the same illiquidity problems on a smaller scale — get quotes before assuming you can execute anywhere near the mid.
💰 Premium Collector
There isn't much of an income angle here — the short $50 call is part of a debit spread, not a covered call or credit strategy, so no net premium is being collected. A premium collector watching this name might instead look at selling further OTM calls against existing HNI shares, but that's a different trade entirely from what printed today.
🌱 Beginner
This is actually a good real-world example of a bull call spread — a strategy worth understanding even if you don't trade it yet. The lesson: buying a call and simultaneously selling a higher-strike call lowers your cost and defines your maximum loss and gain up front, in exchange for giving up unlimited upside. It's a more conservative way to express a bullish view than buying a call outright. That said, HNI's illiquid options chain makes it a poor training-wheels name — practice this structure on a name with tighter markets first.
⚠️ Risk Factors — Read This Before You Even Think About Following This Trade
- 🧊 The chain is brutally illiquid. At the time of this trade, the $40 call market was $2.50 bid / $7.20 offered — a $4.70-wide market on a $5.51 print. The $50 call was $0.00 bid / $2.10 offered — literally no displayed buyer. Our gamma extract returning zero strikes is the same story from a different angle: there simply isn't enough two-sided depth in HNI options to build a reliable structural picture. A retail trader trying to cross either of these markets at "fair value" could easily give up 20-30% of the trade's edge just on execution.
- 📏 The 12.5% hurdle is real. Max profit requires HNI at $50 or higher by September 18 — a move roughly in line with the market's own implied one-standard-deviation range, meaning the options market itself assigns it real but not overwhelming odds. Anything short of that, and the payoff shrinks fast; below $44.60, the full $2.50M debit is at risk.
- 🔍 We cannot see the trader's broader book. The 250,000-share stock block 25 seconds later is consistent with a hedge or related position, but it is an inference, not proof — we don't know if this trader owns HNI shares elsewhere, is running a larger multi-leg strategy, or if the stock print is unrelated entirely.
- 🏢 Small-cap, thin coverage. HNI's ≈$3.1B market cap and limited analyst attention mean less information flow than a mega-cap name — moves can be sharper and harder to explain in real time, as the ≈44% YTD drawdown-and-recovery round trip already shows.
- 💵 Size context: at $2.50M net debit, this is one of the smallest tickets on today's board — its significance is the clean, proven-open structure, not the dollar amount. Don't read outsized conviction into a modestly-sized trade.
Disclaimer: Options trading involves substantial risk of loss and is not suitable for all investors. This analysis is for educational purposes only and is not financial advice. The illiquidity documented above — wide bid/ask spreads, an empty gamma profile, zero prior open interest on both strikes — makes HNI options a genuinely difficult market to execute in; retail traders should expect worse fills than the prices shown here. Always do your own research and consider consulting a licensed financial advisor before trading.
Last updated: 2026-08-03 — next-day OPRA open interest confirmed both legs OPEN at exactly the print size (both strikes 0 → 5,434).