🛡️ HUBS $5.97M Put Buy — Landed Hours Before Tonight's Earnings Print
📅 2026-08-05 | 🔥 Unusual Activity Detected
🎯 The Quick Take
At 13:24:33 ET today, someone paid $5,970,000 for 3,000 August 21 $240 puts on HubSpot (HUBS) — a strike just below the $246.00 spot price at the time, expiring in 16 days. The trade printed as a stock-plus-options cross, a negotiated block with a known counterparty on the other side. What makes this trade worth a second look isn't the size — it's the price: $19.90 per contract is ≈8.1% of the share price, an unusually rich sum for two weeks of downside protection. The reason isn't a mystery: HubSpot reports Q2 2026 earnings tonight, after the close, with a 4:30 p.m. ET call — company-confirmed back in a July 22, 2026 release. This put was bought about three hours before that print.
🏢 Company Overview
HubSpot, Inc. (HUBS) runs a cloud-based marketing, sales, and customer-service software platform — what it calls a "growth platform" — sold à la carte or bundled together. Founded in 2006, HubSpot went public in 2014, is headquartered in Cambridge, Massachusetts, and employs roughly 9,021 people. It sits in the Technology sector under "Services — Prepackaged Software," trades on the NYSE, and currently carries a market cap of ≈$12.82 billion — down 51.3% as the stock has round-tripped through a brutal software-multiple-compression year (StockAnalysis).
💰 The Option Flow Breakdown
📊 What Just Happened
| Field | Value |
|---|---|
| Time (ET) | 13:24:33 |
| Buy/Sell | BUY |
| Call/Put | PUT |
| Expiration | 2026-08-21 (16 days out) |
| Strike | $240 |
| Size | 3,000 contracts |
| Option Price | $19.90 |
| Premium | $5,970,000 |
| Day Volume | 3,100 (final tape count for the contract that day: 3,142) |
| Prior OI | 171 |
| Spot at print | $246.00 |
| Delta | ≈−0.4023 (≈−120,690 share-equivalents) |
| Option Symbol | HUBS20260821P240 |
| Flow Type | 🤝 STOCK-PLUS-OPTIONS CROSS |
Size vs. prior OI: 3,000 vs. 171 — a 17.5x margin. This is about as clean a proof of a fresh opening trade as the tape provides; the existing open interest simply cannot account for a block this size.
Links: HUBS ticker page · Aug-21 $240 put
On the mechanism: the dominant print on this contract crossed as a stock-plus-options cross — a negotiated block that, by definition, pairs an options leg with a non-option (equity) leg. One broker matched both sides off the open order book; there's a known counterparty here, not an anonymous sweep. That means the aggressive/urgent framing you'd apply to a lit sweep doesn't apply — this was arranged, not chased.
✅ RESOLVED — Fully Confirmed, and Slightly Above Our Predicted Range
Updated 2026-08-06 pre-market. The ≈06:30 ET OPRA open-interest snapshot (reflecting the August 5 close) has published.
| Leg | Baseline OI (Aug-5 snap) | Predicted | Actual (Aug-6 snap) | Δ | Print size | Δ as % of print | Day vol | Verdict |
|---|---|---|---|---|---|---|---|---|
| Aug-21-2026 $240 P (bought 3,000) | 171 | ≈3,100–3,171 | 3,248 | +3,077 | 3,000 | ≈+102.6% | 3,153 | ✅ OPEN (BTO) |
Confirmed, with no transfer leakage at all. Open interest rose by 3,077 against a 3,000-lot print — slightly more than the full size, meaning every contract of this block became new open interest and a small amount of additional opening activity happened at the strike besides. It landed just above the ≈3,100–3,171 range we predicted.
This was the easy case and it behaved like one: 3,000 contracts against 171 of prior open interest left no room for a close. The surprise scenario we named — open interest barely moving, implying an off-tape rebalancing — did not occur.
What is now established: a genuinely new $5.97M long put position went on roughly three hours before HubSpot's Q2 print. What open interest still cannot show: whether the buyer holds HUBS shares this is insuring, or whether this is an outright directional bet.
🤓 What This Actually Means — Plain English
The mechanics: buying a put means paying money up front for the right to sell HUBS at $240 anytime through August 21, 2026. It's a bet that HubSpot goes down — or, just as often, insurance on shares someone already owns. With HUBS at $246 when this printed, the $240 strike was slightly out-of-the-money — the stock had to fall about 2.4% just to reach the strike, before the put made a dime.
Why $19.90 is a big number. That's not a cheap insurance premium — it's ≈8.1% of the entire share price, paid for 16 days of coverage. For comparison, a "normal" 16-day near-the-money put on a stock this size, absent a major event, typically costs somewhere in the 3-5% range. The options market is pricing this one at roughly double that, and the reason is sitting right there on the calendar: HubSpot's Q2 2026 results come out tonight, after the close, with the call at 4:30 p.m. ET — a company-confirmed date (StockTitan). This put was bought a little over three hours before that release. Almost the entire richness in this premium is earnings-event risk, not routine two-week decay.
The breakeven math. Strike $240 minus the $19.90 paid puts the breakeven at $220.10 — about 10.5% below the $246.00 print spot. That's the level HUBS needs to close under by August 21 for this position to show a profit.
Here's the useful comparison. Reading HUBS_implied_move.json, the options chain itself is pricing a ±23.45% move (±$58.66) for the August 21 expiration — a range of $191.47 to $308.79. The breakeven on this put, at ≈10.5% below spot, requires less than half (≈45%) of the full move the market is already pricing in for this earnings-dominated window. Put simply: this buyer doesn't need a catastrophic reaction to profit — just a moderately bad one, well inside what the options market itself considers plausible.
The trap: volatility crush. This is the single most important lesson from a trade like this. Because the $19.90 price already has tonight's earnings-event risk baked into it, the morning after the print — win, lose, or draw — that event-specific volatility premium evaporates almost instantly, regardless of which way the stock moves. A trader can be completely right on direction — HUBS drops — and still lose money on this put if the drop is smaller than what was already priced in, because the option was bought "expensive" and the very next session it re-prices for a world with no more earnings risk between now and expiration. Being right isn't enough here; being right by more than the market already expected is what it takes.
What the tape cannot tell us. Because this printed as a stock-plus-options cross, a non-option (equity) leg exists on this trade by definition — that's what makes it a "stock-plus-options" combo rather than a plain options trade. Whether that equity leg means this put is a hedge against shares the buyer already owns, or whether the option is a standalone directional bet with the stock leg serving some other financing purpose, is not something the options tape alone can settle. We don't have visibility into the equity-leg details, the counterparty's identity, or their cost basis — that's an honest limit of what OPRA shows us, not a gap in this analysis.
📈 Technical Setup / Chart Check-Up
YTD Chart
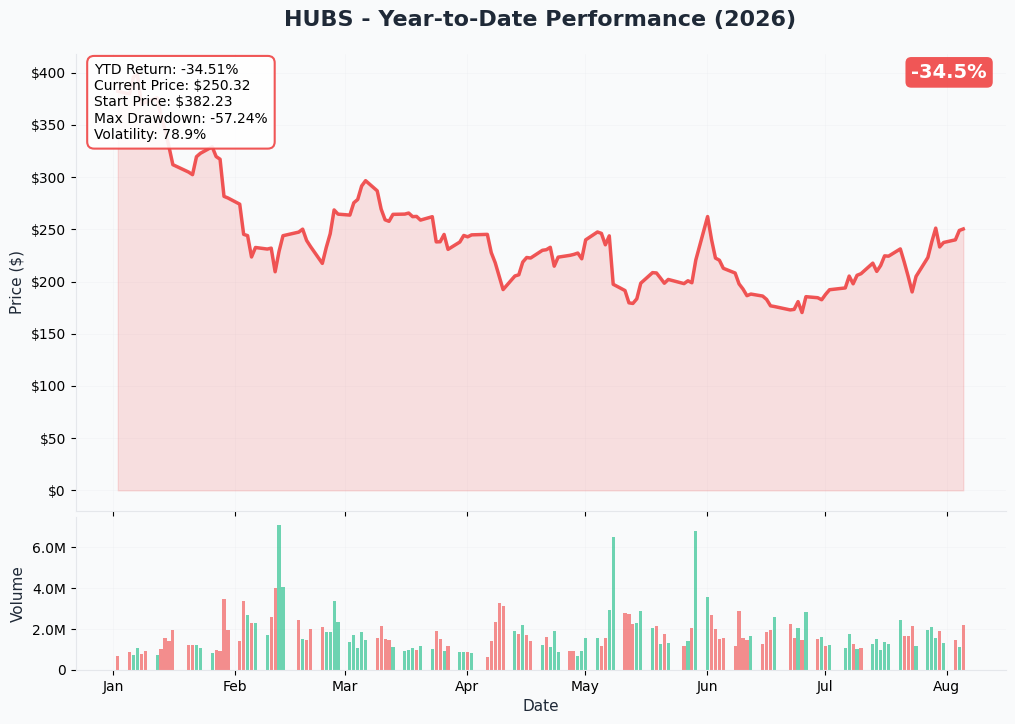
HubSpot is down ≈34.5% year-to-date, having started the year near $382 and bottomed around $172 in early July before grinding back to the $250 area — a max drawdown of ≈57% and realized volatility near 79% this year. Zoom out further and it's worse: the stock sits 52% below its 52-week high of $525.51 (StockAnalysis), a textbook software multiple-compression chart, with the AI-disruption narrative around per-seat CRM pricing now showing up explicitly in analyst notes.
Gamma-Based Support & Resistance Analysis
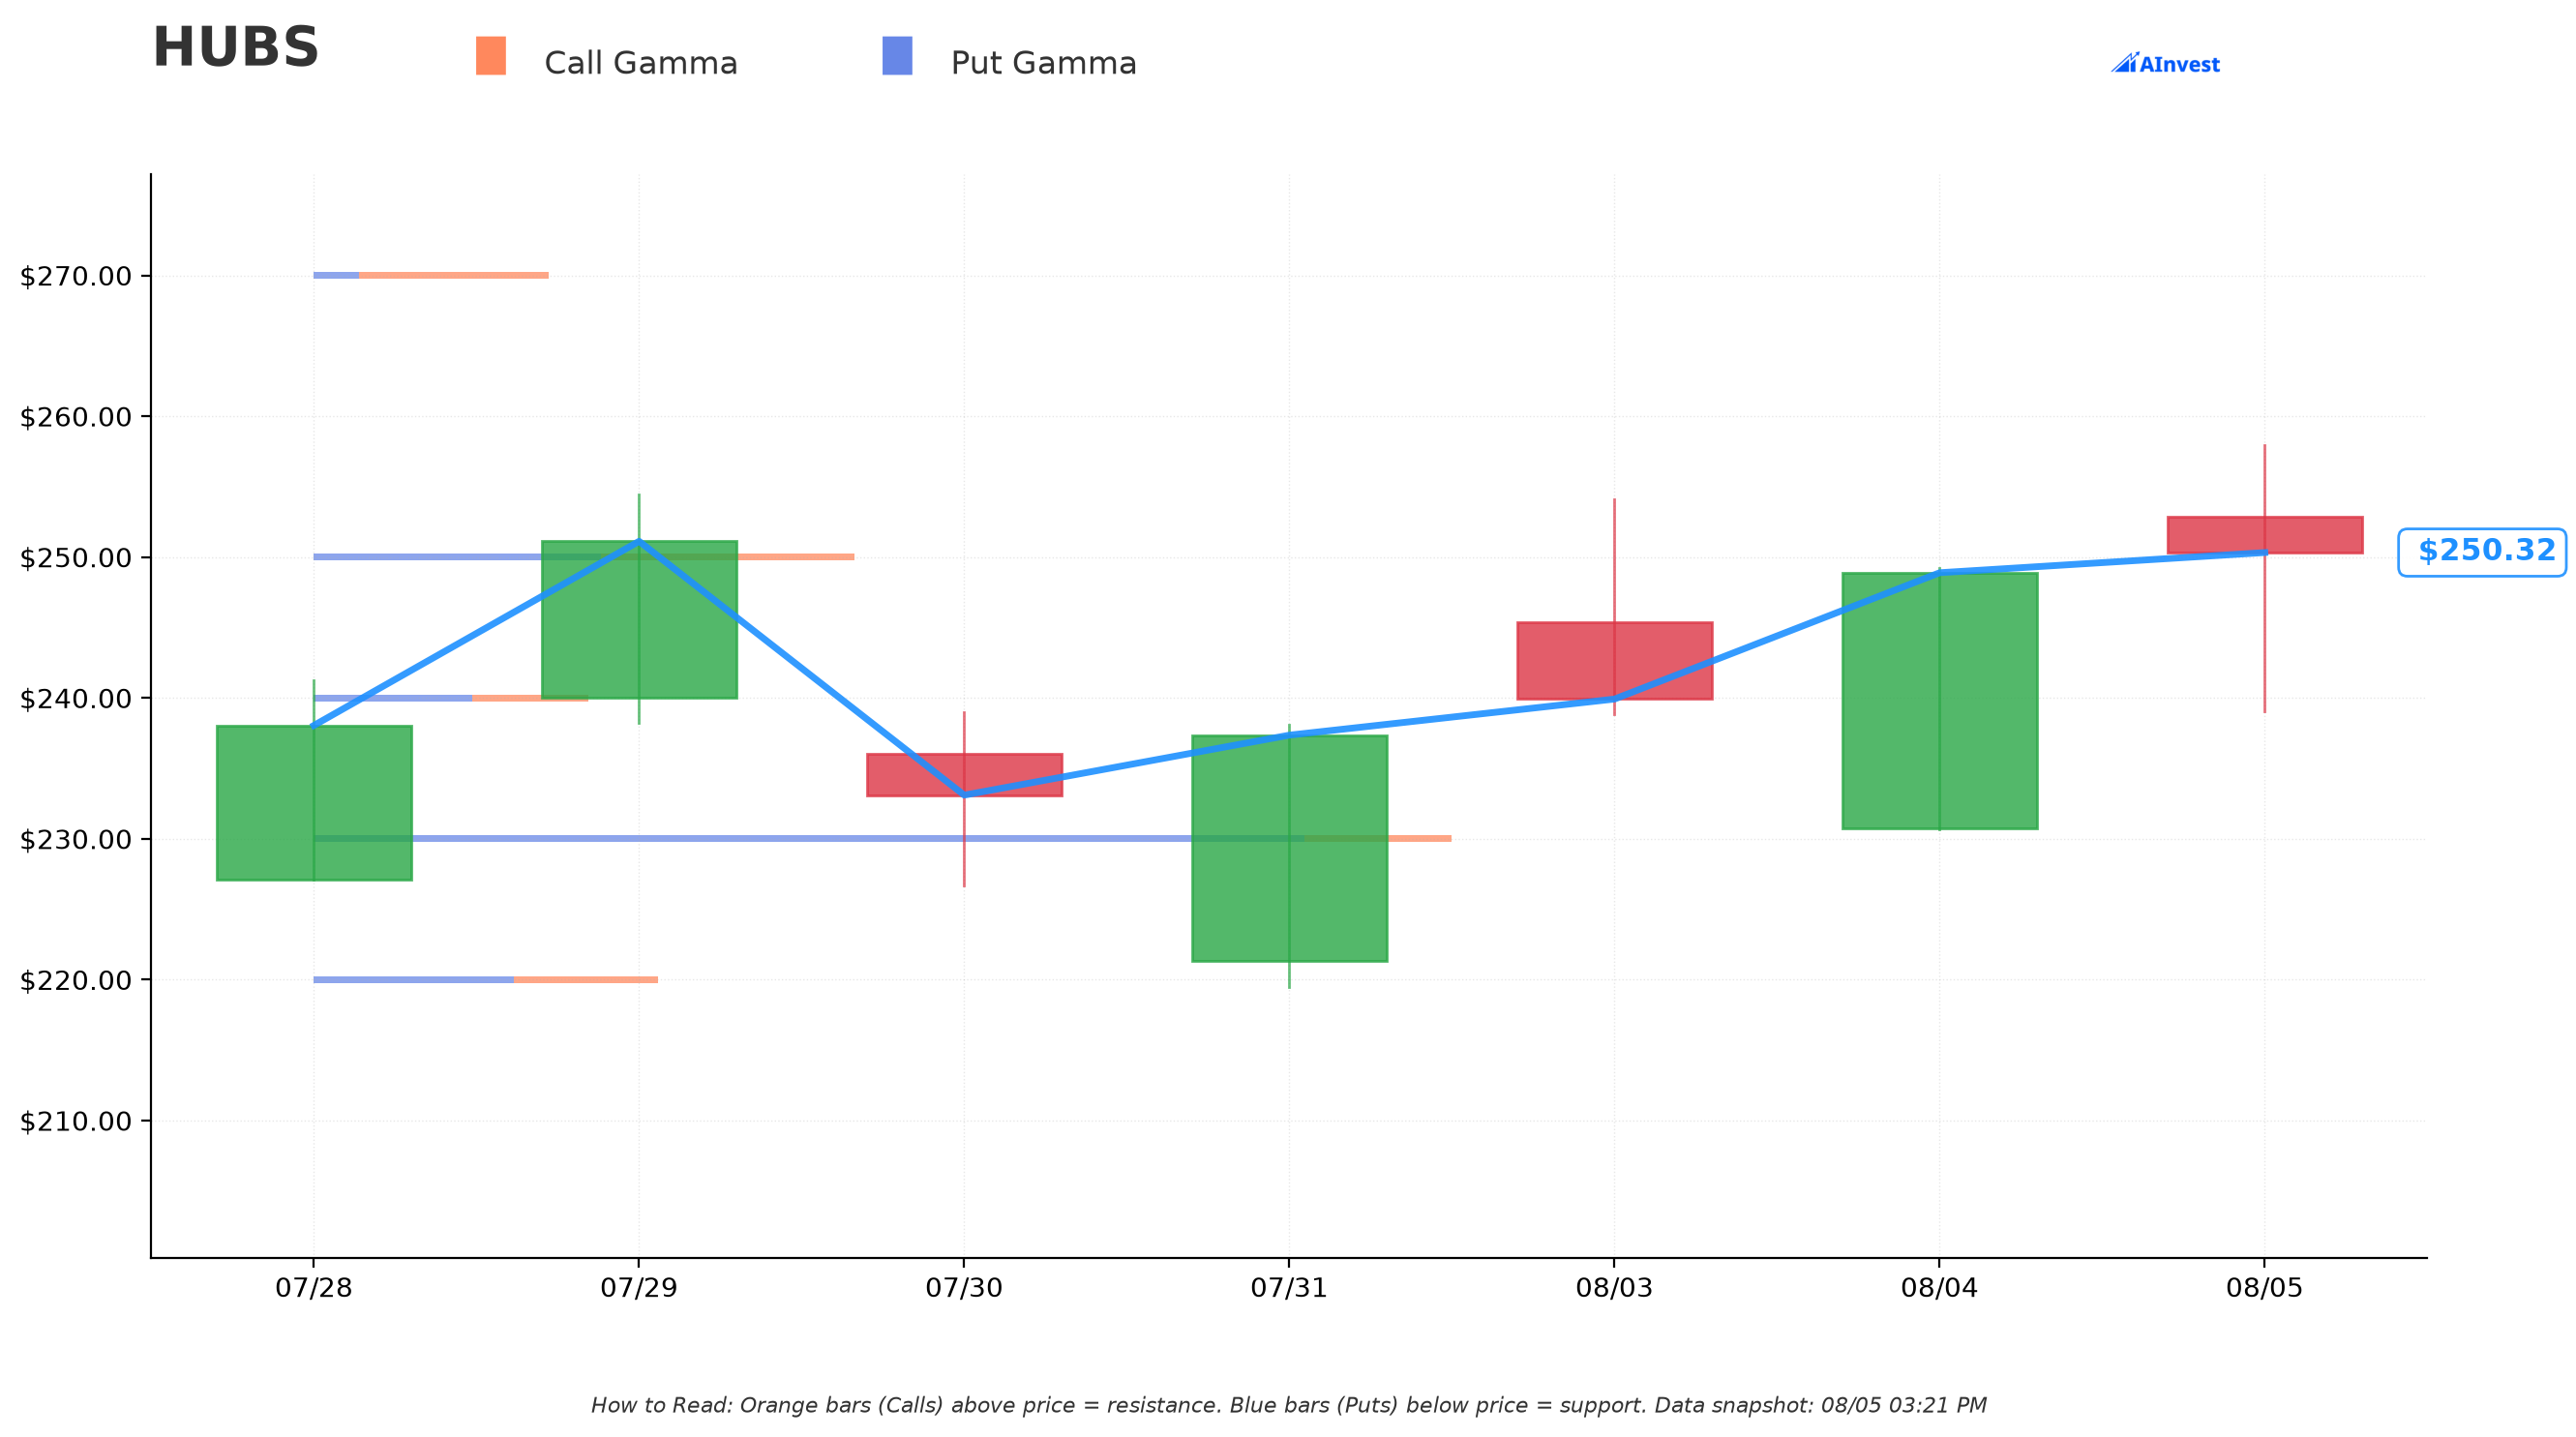
Reading gex.json with HUBS at $250.02:
- 🔵 $230 — by far the largest single gamma concentration in the chain. Put gamma of 0.4717 dwarfs everything else on the board (nearly 4x the next-largest strike), sitting ≈8.0% below spot. This is the structural floor dealers are already positioned around — and notably, it sits above this put's $220.10 breakeven, meaning a real drop through $230 still leaves room to run before the breakeven is even reached.
- 🔵 $240 — right at this trade's strike, ≈4.0% below spot, modest put lean (net gamma −0.020). Not a major structural wall on its own, but it's exactly where this 3,000-lot position is anchored.
- 🟠 $270 — nearest call-heavy resistance, ≈8.0% above spot (net gamma +0.069).
- 🟠 $300 — the single largest call gamma concentration above spot (0.139), ≈20% higher, a stretch target rather than a near-term level.
Translation: the market's own dealer positioning shows the heaviest defensive wall at $230 — well above where this put actually breaks even — meaning the $220.10 level this trade needs is genuinely a "beyond the obvious support" outcome, not a gimme.
Implied Move Analysis
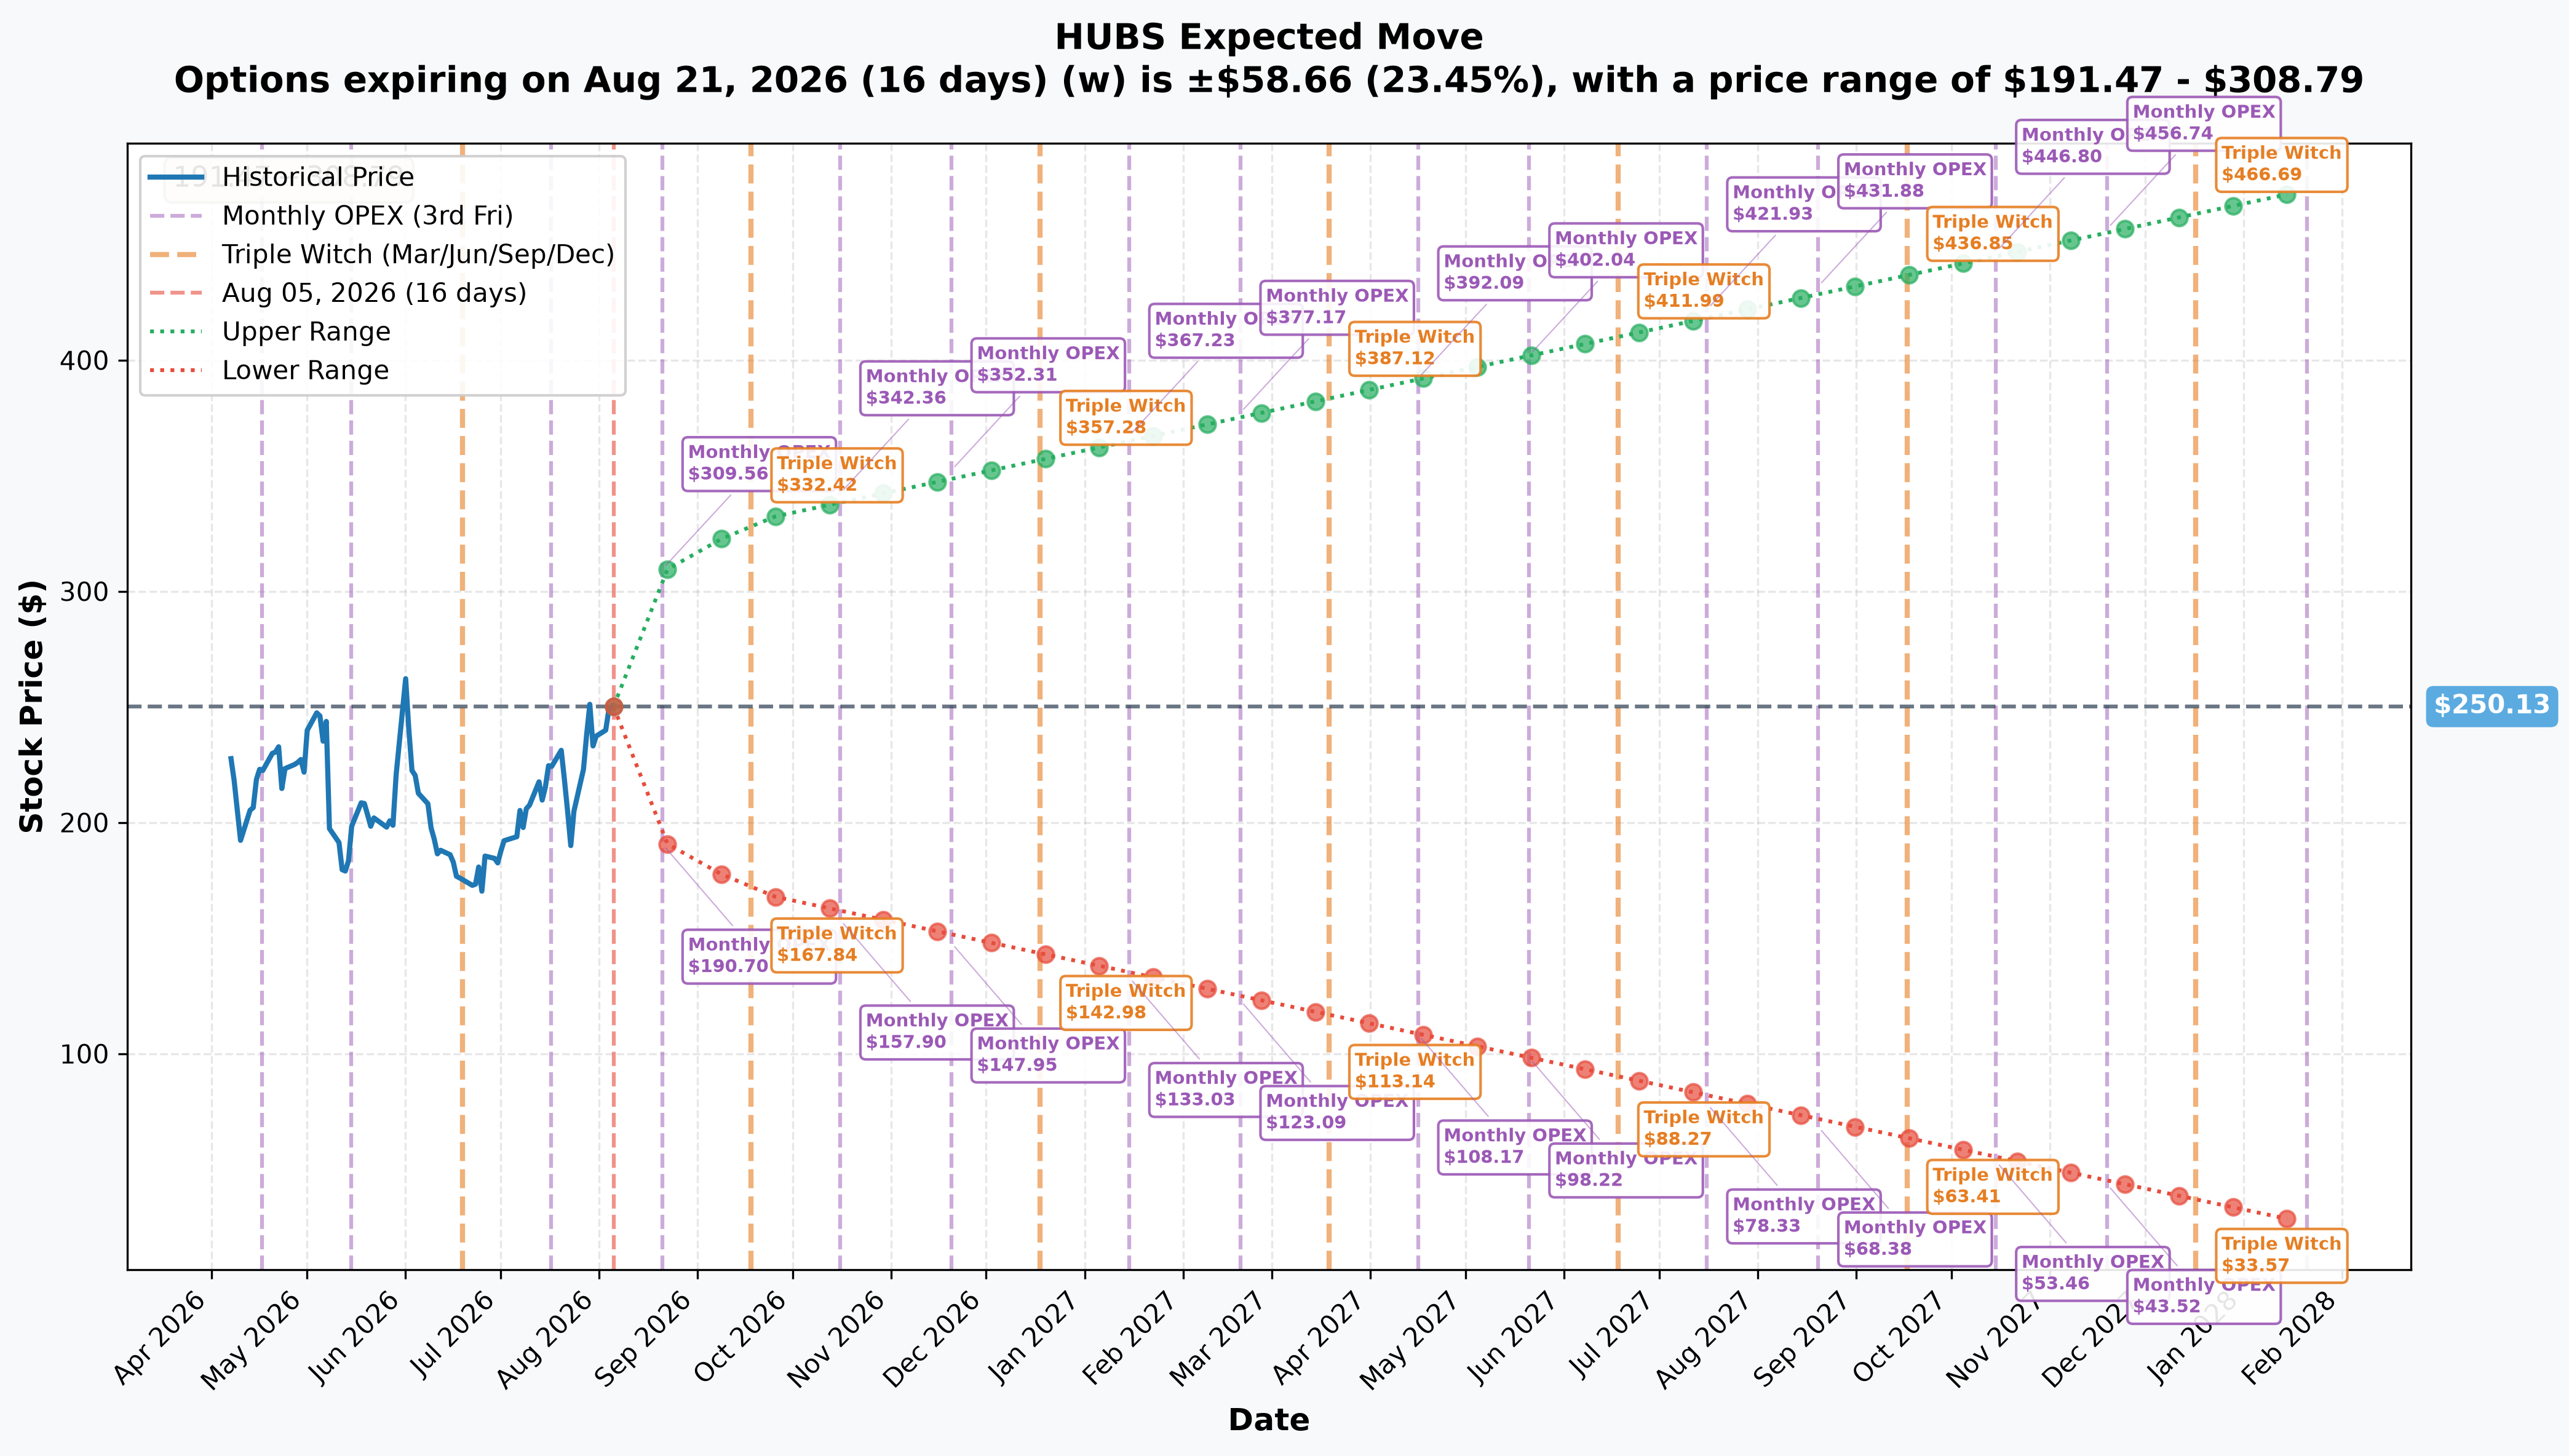
Reading HUBS_implied_move.json for HUBS at $250.13:
| Expiration | Days to expiry | Implied move | Range |
|---|---|---|---|
| Monthly OPEX (2026-08-21) — matches this trade | 16 | ±23.45% (±$58.66) | $191.47 – $308.79 |
| Quarterly triple witch (2026-09-18) | 44 | ±32.08% (±$80.24) | $169.89 – $330.37 |
| Yearly LEAPS (2028-01-21) | 534 | ±89.39% (±$223.58) | $26.55 – $473.71 |
The standout number: this put's $220.10 breakeven sits well inside the chain's own $191.47 downside boundary for the same expiration — the trade only needs roughly 45% of the priced-in move to reach profitability. That's the clearest evidence that $19.90 isn't an irrational price for this contract; it's close to what an efficient market would charge given tonight's confirmed event sits inside this window.
🎪 Catalysts
Tonight — the catalyst this trade is priced around
HubSpot reports Q2 2026 earnings TODAY, August 5, 2026, after market close, with the call at 4:30 p.m. ET. This is company-confirmed via a July 22, 2026 announcement, not an estimate (StockTitan). Consensus is $3.02 EPS (MarketBeat). Last quarter (Q1 2026, reported May 7, 2026) beat on both lines — revenue of $881.0M (+23% YoY) versus $863.32M consensus, and EPS of $2.72 versus $2.47 consensus (StockTitan; MarketBeat). The standing FY2026 guide, set that same day, calls for revenue of $3.700–3.708B and non-GAAP EPS of $13.04–13.12 (StockTitan) — whether tonight's print reaffirms, raises, or cuts that range is the single most important number for this position.
Upcoming — after this contract expires
- UNBOUND 2026 flagship conference, September 16–18, 2026, Boston — HubSpot's product/AI launch stage, expecting 13,000+ attendees (StockTitan).
- Analyst Day at UNBOUND, September 17, 2026, 10:00 a.m.–12:30 p.m. ET — where management is expected to address the AI-disruption / seat-model question directly (StockTitan). Both September events fall after this contract's August 21 expiration, meaning this specific put owns tonight's print and nothing else.
Already priced into the setup
Analyst sentiment has been cutting hard into tonight's print: 5 downgrades against 1 upgrade in the last 90 days (MarketBeat), most notably Wells Fargo's July 20, 2026 downgrade to Equal Weight with its target slashed from $300 to $225 (MarketBeat) — a target that, notably, sits almost exactly on top of this put's $220–240 strike zone. Street targets otherwise range from a $180 low to a $660 high — a 3.7x spread (MarketBeat), which is the market's way of saying nobody agrees yet on whether AI erodes or compounds HubSpot's seat-based pricing model. That dispersion is a real part of why this option is expensive: wide disagreement among sophisticated investors tends to show up as elevated implied volatility.
🎲 Price Targets & Probabilities
- Bear case / where this put profits: a close below $220.10 by August 21 — beyond even the $230 gamma support wall and inside the lower half of the chain's own $191.47–$308.79 implied-move range. Consistent with the $180 low analyst target if the AI-disruption narrative dominates tonight's reaction.
- Base case: HUBS holds the $230–$270 zone, where both the heaviest gamma concentration ($230 puts) and near-term resistance ($270 calls) sit — this put finishes worthless or near it, and the $5.97M premium is a sunk cost.
- Bull case: a beat-and-reaffirm (or raise) sends HUBS back toward the $273.96–$307.86 analyst-consensus range (StockAnalysis; MarketBeat) — this put expires worthless well before that.
💡 Trading Ideas
🛡️ Conservative
Don't chase this specific bet tonight. With implied volatility this elevated heading into a confirmed event, buying any fresh option on HUBS right now means paying a rich, event-inflated price that's likely to collapse by tomorrow morning regardless of outcome. If you want exposure, wait for the post-earnings IV reset and re-evaluate with cheaper premiums.
⚖️ Balanced
If you already hold HUBS shares and want event insurance, a smaller, further-out-of-the-money put (e.g., $210–$220 strike) costs less in absolute dollars and defines your worst case without paying up for near-the-money coverage you may not need.
🚀 Aggressive
Mirroring this trade directly (buying the $240 put outright) is a pure bet that HUBS reacts badly to tonight's print and that the reaction is larger than the ≈23% move already priced in. Size it as what it is — a binary, event-driven wager with a real chance of losing the full premium to volatility crush even if the direction call is correct.
⚠️ Risk Factors — What The Tape Cannot Prove
- Hedge vs. standalone bet is unresolved. This printed as a stock-plus-options cross, meaning a non-option leg exists by definition — but the options tape alone cannot tell us whether it offsets existing shares or stands alone as a directional position.
- No counterparty identity, no cost basis, no motive. We know a known counterparty took the other side of this negotiated block; we don't know who either side is or why.
- Volatility crush is a real, near-certain outcome by tomorrow morning — this is not a hypothetical risk, it's the standing feature of every option that's still open across a confirmed earnings date. Even a directionally correct bet can lose money here.
- Q2 2026 consensus revenue was not sourceable in this pass — only the $3.02 EPS consensus and the standing FY2026 revenue guide range are confirmed; treat any revenue-beat/miss framing as provisional until tonight's actual number is out.
- The stock's own reaction to the last (Q1 2026) print was not sourceable in this pass, so there's no clean historical earnings-day-move baseline to lean on here beyond the chain's own implied-move pricing.
👥 How Different Readers Should Think About This
🎰 YOLO Trader: This is the trade you're tempted to copy — a $240 put bought hours before a confirmed earnings print, with a breakeven inside the market's own priced range. If you play it, understand you're betting the reaction is worse than what's already baked into a 23%-plus implied move, and that IV crush works against you the second the print hits, win or lose.
📈 Swing Trader: This isn't really a swing setup — it resolves almost entirely tomorrow morning. If you're not comfortable holding overnight through an earnings gap, this specific structure isn't for you regardless of your view on HubSpot.
💰 Premium Collector: Elevated IV ahead of a confirmed catalyst is exactly the setup premium sellers watch for — but selling naked options into an earnings gap carries defined, sometimes severe, tail risk. If you're inclined to fade this vol, a defined-risk credit spread (not a naked short) is the more responsible way to participate, and only after sizing for a real overnight gap.
🌱 Beginner: The single lesson worth taking from this trade: options priced right before earnings are expensive for a reason, and that reason (the event) evaporates the instant the news is out — sometimes taking most of the option's value with it even when the stock moves in the direction you expected. This is not a beginner-friendly trade to replicate.
🎯 The Bottom Line
Real talk: someone paid $5.97 million for 3,000 near-the-money HUBS puts about three hours before a company-confirmed Q2 2026 earnings release tonight. The 8.1%-of-spot price tag looks alarming in isolation, but it's largely explained by the calendar — HubSpot reports at 4:30 p.m. ET today, and this contract's entire 16-day life is dominated by that single event. The breakeven at $220.10 requires less than half of what the options market itself is already pricing as a plausible move, which is a genuinely reasonable bet structure, not a reckless one.
What it isn't is a free read on what happens next. Size at 3,000 versus 171 prior open interest makes this about as confirmed an opening trade as the tape provides — but confirmed size doesn't mean confirmed outcome. Mark tonight, 4:30 p.m. ET, on your calendar, and remember: this trade can be right on direction and still lose to volatility crush if the market's own ≈23% expected move turns out to be roughly correct.
This is options flow analysis, not investment advice. Options trading involves substantial risk of loss and is not suitable for all investors. Position sizes, strikes, and structures discussed here reflect institutional-scale flow observed on the tape; retail traders should size any position to their own risk tolerance and account size.
Last updated: 2026-08-06 (pre-market) — next-day OPRA open interest confirmed the put as a full fresh open (171 → 3,248, +3,077 on a 3,000-lot print), slightly above the predicted range.