🛡️ HYG $1.13M Deep Tail Hedge: A Floor Trade Buys 75,000 January 2027 $65 Puts, 18.2% Below the Tape
📅 2026-08-05 | 🤝 Negotiated Floor Trade — A Credit-Crash Hedge, Not a Directional Bet
🎯 The Quick Take
At 14:05:40 ET, with HYG trading at $79.48, a single print bought 75,000 January 15, 2027 $65 puts for $0.15 each — $1,125,000 total, negotiated as a floor trade on the exchange floor rather than swept off the lit book. The strike sits ≈18.2% below the tape, and the size (75,000) dwarfs the prior open interest (1,842), so this is a proven new position, not a guess. The story here isn't direction — it's asymmetry: for ≈0.19% of the ≈$596M of credit exposure it covers, someone just bought the right to be paid if high-yield bonds fall out of bed.
📊 Company Overview
HYG — iShares iBoxx $ High Yield Corporate Bond ETF is BlackRock's flagship high-yield bond ETF, launched April 4, 2007. It holds 1,333 below-investment-grade (junk) corporate bonds, has ≈$17.37B in assets, and charges a 0.49% expense ratio (StockAnalysis). It's the deepest, most liquid listed vehicle for high-yield credit exposure — and by extension, the most liquid listed way to bet on or hedge against corporate credit stress, the kind of event that hits weak-balance-sheet borrowers first and equity indices second.
- Price at the time of this trade: $79.48 (current price $79.46, essentially unchanged, −0.11% on the session — StockAnalysis)
- 52-week range: $78.57 – $81.36 — HYG sits ≈1.1% off its 52-week low, while SPY sits within ≈1% of its all-time high (StockAnalysis SPY)
- Dividend yield: 5.90% trailing, paid monthly, most recent distribution $0.38429, ex-date August 3, 2026 (StockAnalysis)
- 1-year total return: +4.98% including dividends — meaning price decline has eaten roughly a full point of coupon over the past year (StockAnalysis)
💰 The Option Flow Breakdown
📊 What Just Happened — 🤝 Negotiated Floor Trade
This print was manually negotiated on the exchange floor — brokers arranged buyer and seller directly rather than the order hitting the open, displayed book. That means it's a facilitated block with a known counterparty, not an aggressive sweep. The print landed ≈75% of the way from the bid to the ask (closer to the ask side), which is consistent with the buy side we already know from the tape — but on a floor-negotiated trade, that percentage is context, not proof of urgency, since there's no lit order book being taken.
| Time | Symbol | Buy/Sell | Call/Put | Expiration | Premium | Strike | Volume | OI (prior) | Size | Spot | Option Price | Option Symbol |
|---|---|---|---|---|---|---|---|---|---|---|---|---|
| 14:05:40 | HYG | BUY | PUT | 2027-01-15 | $1,125,000 | $65 | 75,516 | 1,842 | 75,000 | $79.48 | $0.15 | HYG20270115P65 |
🤝 Negotiated Floor Trade — Long Put, size 41× prior open interest. This is about as clean a "proven open" as the tape gets: 75,000 contracts against only 1,842 existing contracts at that strike means the overwhelming majority of this size did not exist an hour earlier.
✅ RESOLVED — 100% of the Size Became New Open Interest
Updated 2026-08-06 pre-market. The ≈06:30 ET OPRA open-interest snapshot (reflecting the August 5 close) has published.
| Leg | Baseline OI (Aug-5 snap) | Predicted | Actual (Aug-6 snap) | Δ | Print size | Δ as % of print | Day vol | Verdict |
|---|---|---|---|---|---|---|---|---|
| Jan-15-2027 $65 P (bought 75,000) | 1,842 | ≈76,800 | 77,359 | +75,517 | 75,000 | ≈+100.7% | 75,517 | ✅ OPEN (BTO) |
A textbook clean open. We predicted ≈76,800 and it printed 77,359 — the full 75,000-lot size converted into new open interest, with a few hundred contracts of additional opening on top. The AMAT-style transfer pattern we warned about (where part of a large block turns out to be existing holders trading among themselves) simply did not appear here: day volume of 75,517 exactly matched the open-interest gain, which is the signature of every contract being brand new.
So the headline is real at full size. Someone now owns 75,000 January-2027 $65 puts on HYG that nobody owned two days ago — ≈$596 million of high-yield credit notional covered for ≈$1.13M, or about 0.19% of notional. The tail hedge is as big as it looked.
What the tape still cannot tell us: who bought it, what book it sits alongside, and whether it is a hedge against a credit portfolio or a standalone view. The structure argues strongly for insurance, but that remains an inference.
🤓 What This Actually Means — Plain English
Let's be clear about what this trade is not: it is not a bet that HYG's price falls in the normal course of business. The $65 strike is ≈18.2% below today's $79.48 — HYG's entire 52-week range is only ≈3.5% wide ($78.57–$81.36). A move to $65 isn't a bad week for bonds; it's a regime break.
Here's the math that makes this trade interesting. 75,000 contracts × 100 shares each = 7,500,000 share-equivalents. At $79.48, that's ≈$596 million of high-yield credit notional. The premium paid to control all of that for the next ≈five months is $1,125,000 — about 0.19% of the notional. That ratio is the whole trade: it's cheap because the odds of a 18%+ crash in a diversified junk-bond ETF are low, and it pays enormous convexity if that low-probability event happens. Delta on this put is ≈−0.0325, meaning right now it behaves like ≈243,750 shares of short exposure — a small fraction of the $596M it's designed to protect once things get ugly, because deep out-of-the-money options only "wake up" as the underlying approaches the strike.
Why HYG and not a rate instrument? A HYG put is not simply a rates trade. HYG's price is hit by two separate forces: (1) the discount rate applied to every bond's future cash flows (duration), and (2) the market's assessment of default risk on the 1,333 sub-investment-grade issuers it holds (credit spread). A Treasury-future put only captures the first. A HYG put captures both — which is exactly why institutions use HYG, not TLT, to express or hedge a "credit event" view specifically, as opposed to a pure rates view.
This reads as insurance, not speculation. Someone is paying a small, known premium to be compensated in a scenario most portfolios aren't otherwise protected against — a genuine high-yield credit event. It is not sized or structured like a trade meant to be profitable on its own; it's sized like a hedge sitting alongside a much larger book (equity, credit, or both).
📈 Technical Setup / Chart Check-Up
YTD Performance Chart
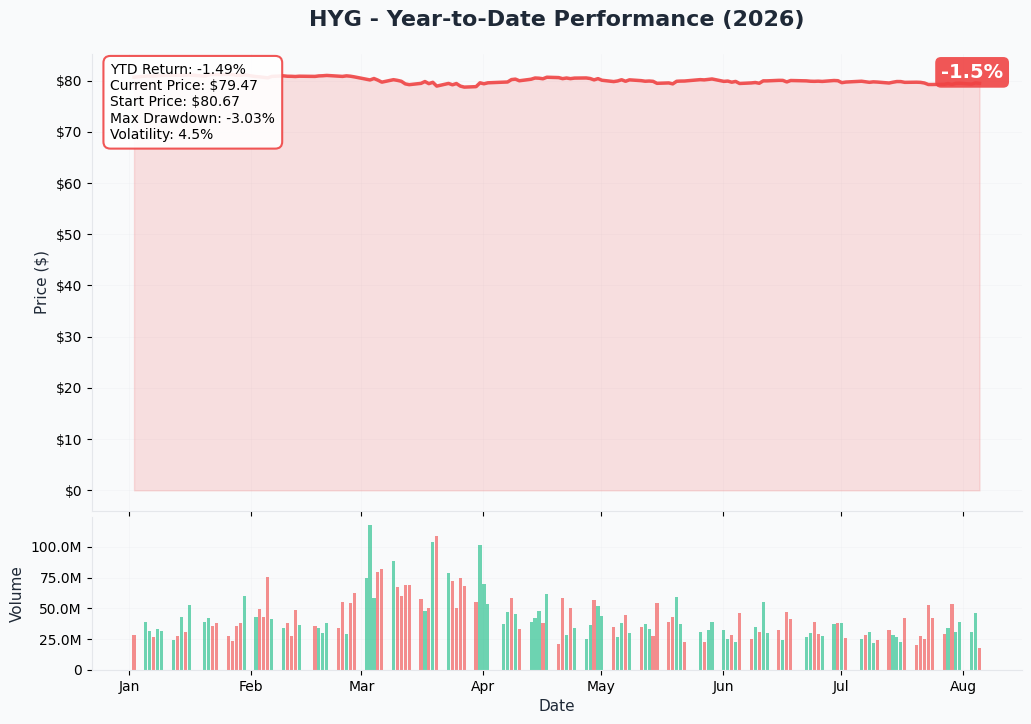
HYG is sitting ≈1.1% off its 52-week low of $78.57, in a tight $78.57–$81.36 range, while equities (SPY) trade near all-time highs. That's the divergence underpinning this trade: credit is not confirming the "everything's fine" read that equity indices are currently sending.
🔵🟠 Gamma-Based Support & Resistance Analysis
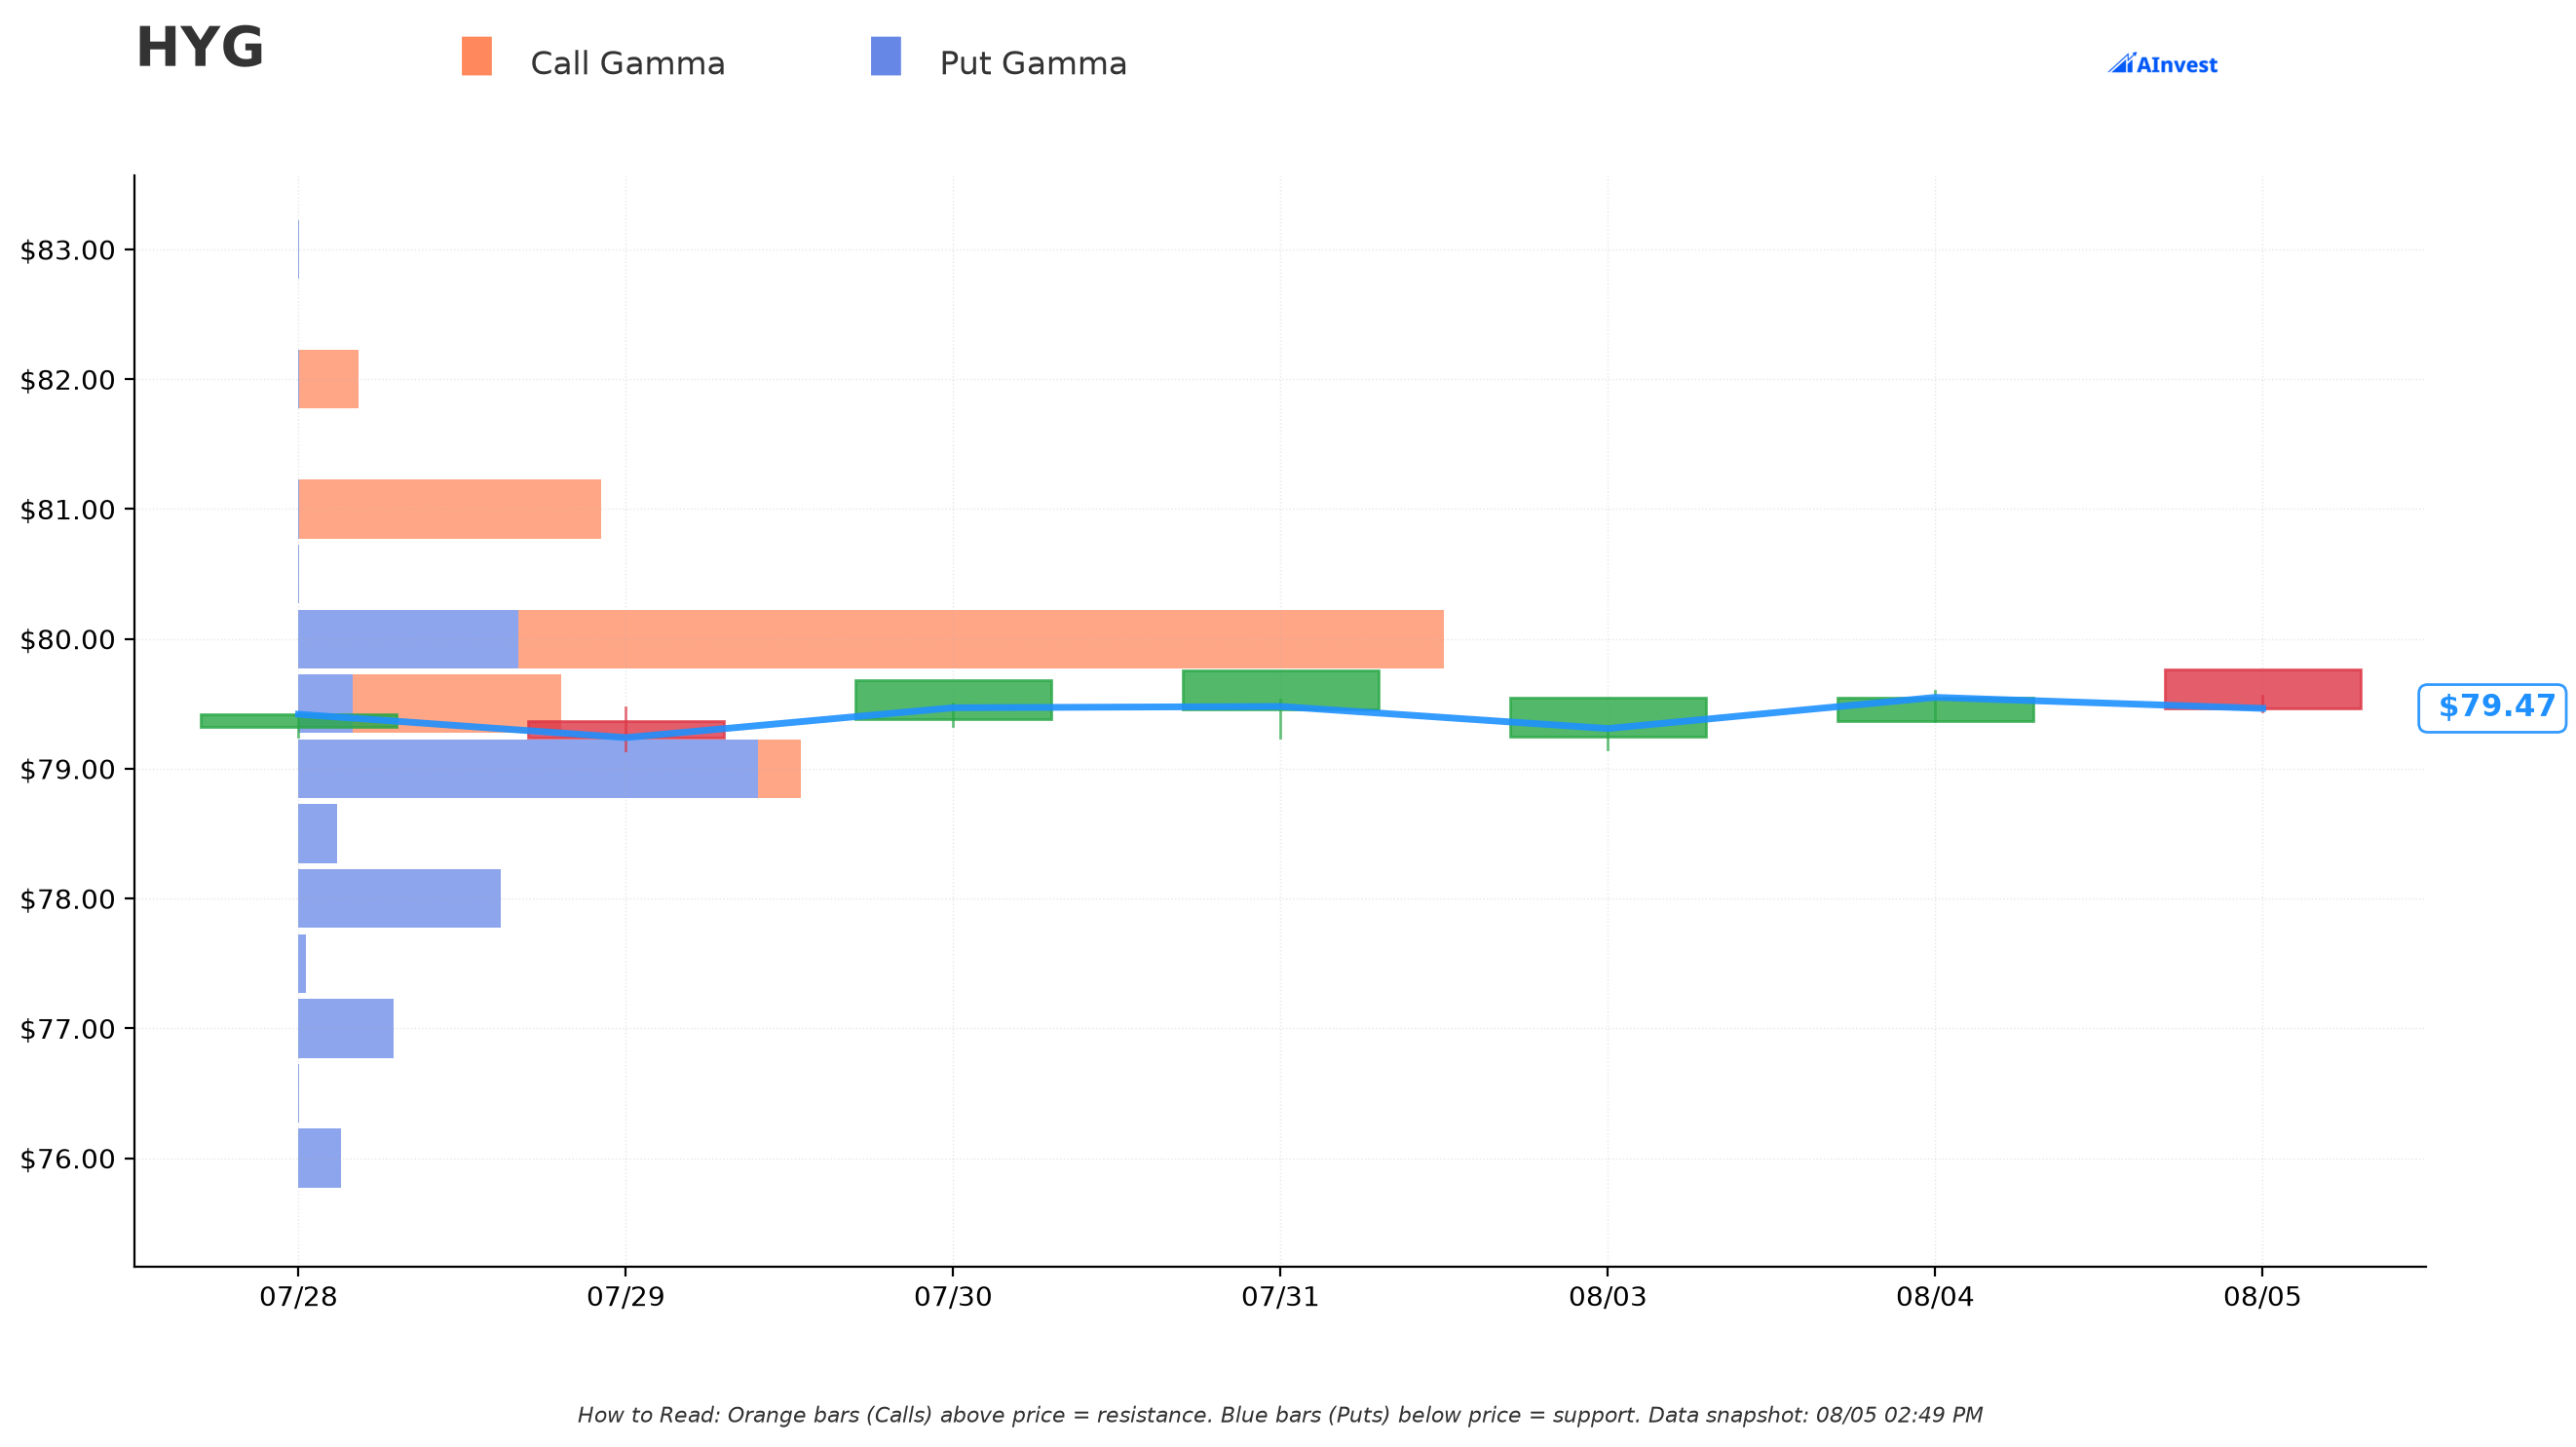
Current price: $79.46. The gamma map is tightly clustered right around spot, which is typical for a low-volatility ETF like HYG:
🟠 Resistance (call gamma above price):
- $80.00 — Very strong resistance, the single largest gamma concentration on the chain, mostly call-side (≈0.68% above spot)
- $79.50 — Strong resistance, mixed call/put (essentially at-the-money, ≈0.05% above spot)
- $81.00 — Strong resistance, mostly call-side (≈1.94% above spot)
- $82.00 — Lighter resistance, call-side (≈3.20% above spot)
🔵 Support (put gamma below price):
- $79.00 — Very strong support, mostly put-side, the second-largest concentration on the chain (≈0.58% below spot)
- $78.00 — Support, put-side (≈1.84% below spot)
- $77.00 — Support, put-side (≈3.10% below spot)
- $75.00 — Support, put-side (≈5.61% below spot)
- $70.00 — The lowest strike carrying meaningful gamma weight, and it's already a weak one (≈11.9% below spot)
What stands out: there is essentially no dealer gamma structure anywhere near $65 — the chain's gamma weight thins out dramatically below $75 and is close to negligible by $70. That confirms this put isn't targeting a technical level or a dealer-hedging pivot at all. It's parked well outside the zone where market-maker hedging flows currently matter, which is exactly where you'd expect a tail hedge to sit — it isn't meant to interact with day-to-day price action, only with a genuine breakdown.
🎯 Implied Move Analysis
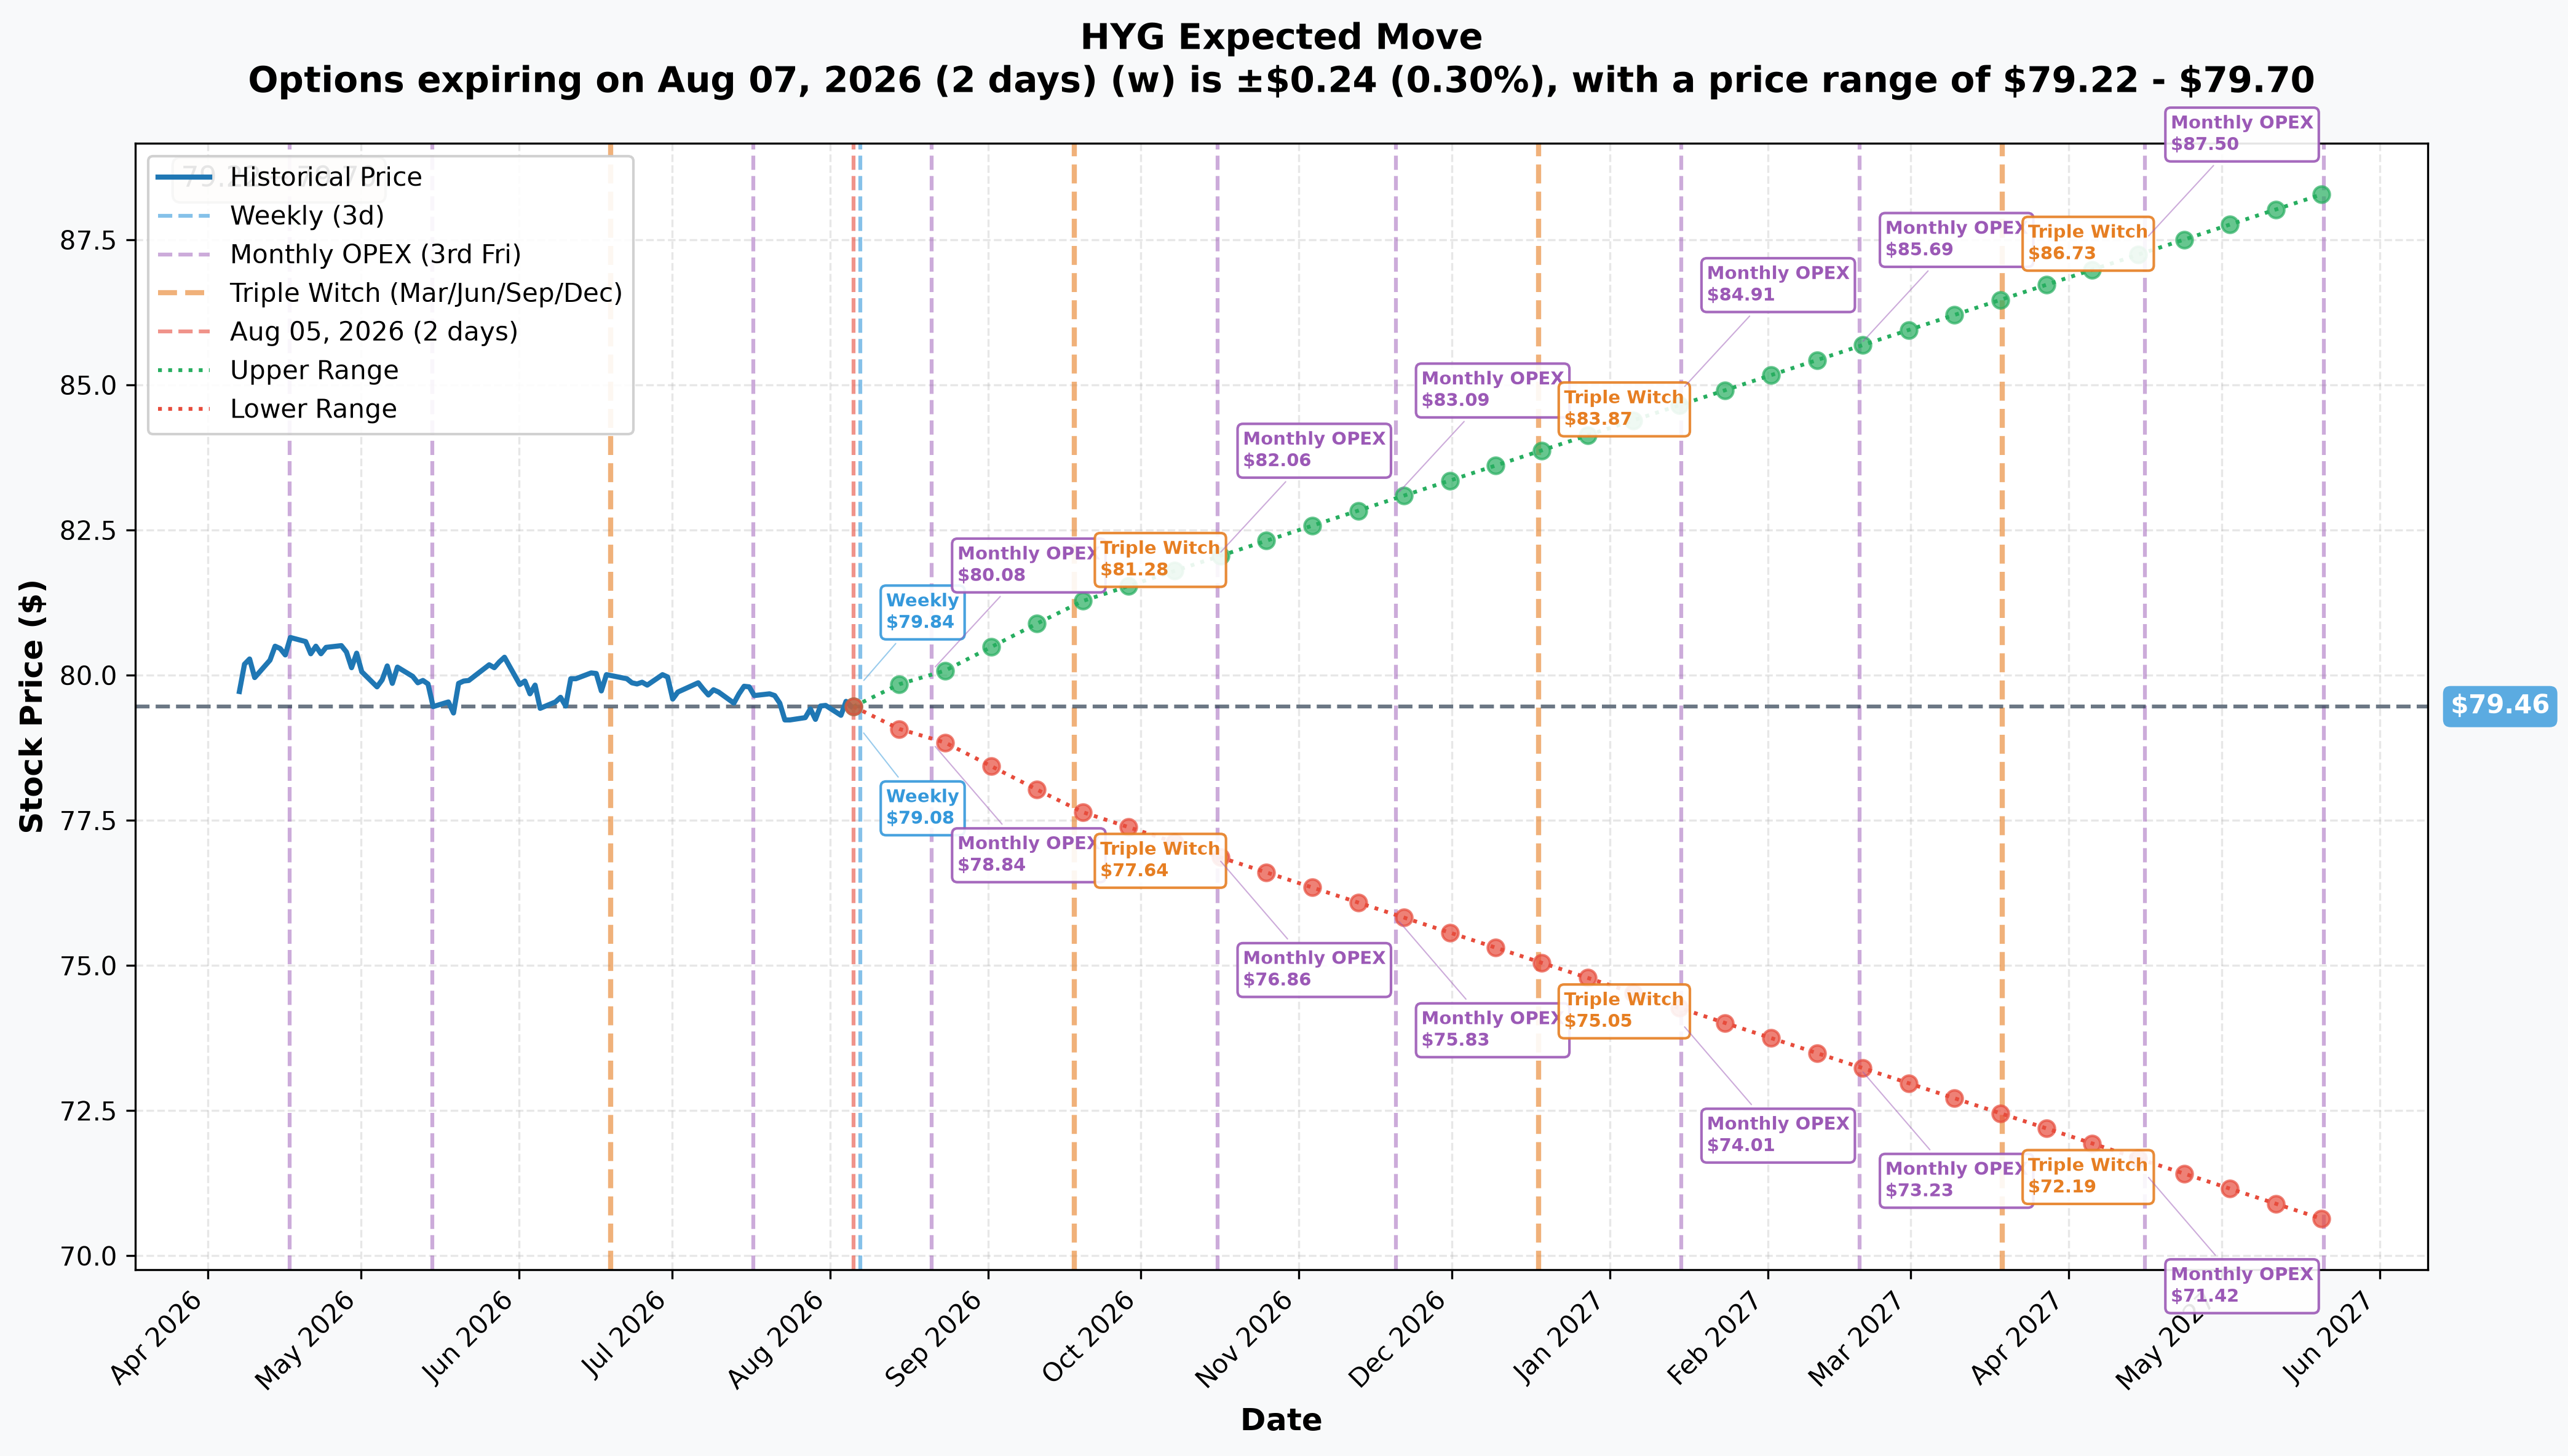
This is the most useful comparison in the whole trade. Options pricing from the current $79.46 spot:
- 📅 Weekly (Aug 7, 2 days): ±0.30% (±$0.24) → Range: $79.22 – $79.70
- 📅 Monthly OPEX (Aug 21, 16 days): ±0.67% (±$0.53) → Range: $78.93 – $79.99
- 📅 Quarterly Triple Witch (Sep 18, 44 days): ±2.25% (±$1.79) → Range: $77.67 – $81.25
- 📅 Monthly OPEX (Jan 15, 2027, the SAME expiry as this trade): ±≈6.86% → Range: ≈$74.01 – $84.91
- 📅 LEAPS (May 21, 2027, 289 days — the longest-dated cycle the chain prices): ±11.14% (±$8.85) → Range: $70.61 – $88.31
Sit with that for a second. The options market, pricing HYG's own chain out to the exact same January 15, 2027 expiration as this trade, implies a move of only ≈±6.9% — a range of roughly $74–$85. Even stretching all the way out to the longest-dated LEAPS cycle the chain offers (289 days out, four months later than this trade's expiry), the implied range only reaches down to $70.61 — still nowhere near the $65 strike, which requires an 18.2% decline. This put isn't priced to the market's own expectation of "normal" volatility; it's priced for an outcome the options chain itself currently treats as a low-probability tail, which is precisely what makes it cheap and precisely what makes it a hedge rather than a trade on the base case.
🎪 Catalysts
✅ Already Happened (last 3 months)
The Fed held on July 29, 2026 — with three members wanting to hike, not cut. The FOMC kept the target range at 3.50–3.75% in a 9–3 vote, and Beth Hammack, Neel Kashkari, and Lorie Logan all preferred a 25bp increase (Federal Reserve). This is a double-negative setup for high yield specifically: a hike (or hike risk) lifts the discount rate on every bond HYG holds and raises refinancing costs for the sub-investment-grade issuers inside it, pushing forward default expectations at the same time. Any thesis built around "rate cuts help HYG" contradicts what the primary source actually shows right now.
Labor data added a credit-negative cross-current. July 2026 ADP private payrolls came in at +44K actual vs +68K forecast (released August 5, 2026, Investing.com). Weaker labor is rate-friendly for HYG's duration leg, but it's not the clean positive it is for Treasuries — a labor slowdown historically precedes deteriorating corporate cash flow and rising high-yield default rates.
Sentiment has been souring. HYG's own news feed has recently carried headlines like "High-Yield Bonds Face Rising Downside Risk," alongside coverage describing investors "stepping up bets against the high-yield sector" (StockAnalysis) — consistent with HYG sitting near 52-week lows while equities sit near highs.
🔮 Coming Up (next 6 months, inside this trade's January 15, 2027 expiry window)
September 15–16, 2026 — FOMC + updated dot plot. The highest-impact date on the calendar for this position (Federal Reserve FOMC calendar). A hike, or a dot plot that shows a higher terminal rate, would hit duration and credit spreads together — the exact combination this put is built to pay on.
October 27–28, 2026 — FOMC, six days before the midterms (Federal Reserve FOMC calendar).
November 3, 2026 — U.S. midterm elections. Falls inside this put's window. Midterms reprice fiscal expectations — deficit trajectory, tax policy, divided-government odds — and a contested or delayed result is a classic risk-off trigger where high-yield spreads can gap wider before equity indices fully react, since HY is thinner and dealer balance sheets shrink fastest into uncertainty.
December 8–9, 2026 — FOMC + updated dot plot, setting the tone for 2027 refinancing costs (Federal Reserve FOMC calendar).
Monthly PCE / GDP releases land August 26, September 30, October 29 (with Q3 GDP advance), November 25, and December 23, 2026, all at 8:30 AM ET (BEA release schedule). The October 29 Q3 GDP advance is arguably as important for credit as any single PCE print, since growth feeds directly into default expectations.
Data gaps, stated plainly. The underlying catalyst research could not source a live high-yield option-adjusted spread (FRED's BAMLH0A0HYM2 returned an access error), HYG's effective duration (the issuer's product page returned an access error), or fund-flow data. Anyone sizing a trade off this article should pull the live high-yield spread directly from FRED's BAMLH0A0HYM2 series before acting — we are not going to guess at a number we couldn't verify.
🎲 Price Targets & What the Levels Say
- Base case: HYG continues to chop inside its tight $78.57–$81.36 range, gravitating toward the $79–$80 gamma cluster that currently holds most of the chain's dealer positioning. The weekly and monthly-OPEX implied ranges (≈$79.22–$79.70, ≈$78.93–$79.99) capture this well. In this scenario, the $65 put simply decays toward zero — the base case for the overwhelming majority of deep out-of-the-money hedges.
- Bear case (rates): A September hike or a hawkish dot plot pushes HYG toward the lower gamma supports at $77–$75, inside the quarterly implied-move range of $77.67–$81.25. That's a real but contained move — nowhere near the $65 strike.
- Tail case (credit event): A genuine high-yield credit event — a default cluster, a spread-widening shock tied to the September/December FOMC or the November midterms — is the only scenario that gets this put in the money. The chain's own longest-dated implied move (±11.14% to the LEAPS cycle) doesn't even reach $65; this strike sits below what the options market currently treats as plausible, which is exactly the definition of a tail hedge.
🧭 How Four Different Readers Should Think About This
🎰 YOLO Trader: There is very little to chase here. Buying $65 puts today to mirror this trade means paying up after a 41×-OI print already moved the strike's liquidity, on a contract that needs an 18%+ crash in a diversified bond ETF to pay off. If you want the same convexity idea, treat it as a tiny, defined-risk lottery ticket sized in the low hundreds of dollars, not a core position — and understand you are very likely buying something that expires worthless.
📈 Swing Trader: This print isn't a swing signal on HYG's price. There's no near-term technical read here beyond "credit is diverging from equity, watch the September FOMC." If you trade HYG's range, the gamma-defined $77–$82 band and the confirmed dividend ex-dates (mechanical small gaps, not credit signals) are more useful than this specific put print.
💰 Premium Collector: This is someone else buying protection, which means someone else sold it. If you're comfortable with tail risk, selling far-dated, far OTM HYG puts against a covered position can be a way to collect that same $0.15-per-contract premium others are paying for insurance — but understand you're on the other side of a hedge, not picking up "free" money, and a genuine credit event is exactly the scenario where this kind of short put position hurts most, at the worst possible time.
🌱 Beginner: This is a great real-world example of why cheap options are cheap. A $0.15 option costs almost nothing per contract because the market thinks it's very unlikely to pay off — HYG would need to fall more than 18% by January 2027, on an ETF whose entire 52-week range so far is only 3.5% wide. Most deep out-of-the-money puts like this one expire completely worthless, and that's not a flaw — it's the whole point of insurance. You pay a small, known cost for protection against a rare, severe event, and most of the time you don't collect. Don't read a trade like this as "someone thinks HYG is crashing soon" — read it as "someone is paying a little bit to be covered if it does."
⚠️ Honest Risk + What the Tape Cannot Prove
- We don't know who placed this trade, their broker, their order ID, or what else is in their book. OPRA data shows price, size, timing, and mechanism — never identity or motive. This could be a portfolio hedge, a macro fund expressing a credit view, an insurer or pension managing tail risk, or something else entirely.
- Open/close is proven for this leg (size 41× prior OI), but the exact new-OI number is a prediction, not a fact yet. We expect OI to rise from 1,842 to roughly ≈76,800 at the next OPRA snapshot; if the increase comes in meaningfully lower, part of today's size was existing holders trading with each other rather than 100% brand-new contracts.
- This trade tells us nothing about probability, only about payoff structure. A cheap, deep out-of-the-money put doesn't mean a crash is likely — it means someone decided the asymmetric payoff was worth a small premium. Most of the time, hedges like this simply expire worthless, and that is the expected, "working as intended" outcome, not a failure.
- Key data gaps acknowledged, not guessed at: live high-yield credit spreads (OAS), HYG's portfolio duration, and fund-flow data could not be sourced for this article. Anyone using this print to size their own credit-hedging decision should pull those numbers directly — starting with FRED's BAMLH0A0HYM2 high-yield OAS series — rather than relying on this article alone.
- Options trading involves substantial risk of loss and may not be suitable for all investors. This analysis is for educational purposes only and is not financial advice. Always do your own research and consider your own risk tolerance before trading.
About HYG — iShares iBoxx $ High Yield Corporate Bond ETF: BlackRock's benchmark listed high-yield corporate bond ETF, holding 1,333 sub-investment-grade bonds with ≈$17.37B in assets, and the deepest options market for expressing or hedging U.S. credit risk.
Last updated: 2026-08-06 (pre-market) — next-day OPRA open interest confirmed the full 75,000-lot size as new open interest (1,842 → 77,359, +75,517), slightly above the predicted ≈76,800 with no transfer leakage.