🤝 IBM $14.1M Block Cross: A Desk Sold Calls Betting Big Blue Doesn't Reclaim Its Own June Price for 17 Months
2026-08-12 | 🔥 Unusual Activity — 5,000 Jan-2028 $300 Calls Sold
✅ Updated 2026-08-13 pre-market — the next-day OPRA open interest confirmed the short, landing 313 contracts above our published number. Open interest at the January-2028 $300 strike rose 1,307 → 6,620 (+5,313) against 5,000 sold; we predicted ≈6,307. The STO label stands, and the position is slightly larger than the block alone. See the ✅ RESOLVED box.
🎯 The Quick Take
At 12:54:12 ET, a desk sold 5,000 IBM January 21, 2028 $300 calls at $28.11, collecting ≈$14.06M in a negotiated block cross — printed at the midpoint, so it took no liquidity and the SELL label is reported, not tape-proven. On the surface the $300 strike looks like a comfortable ≈28% out-of-the-money cushion against IBM's $234.39 spot. It isn't nearly that comfortable: IBM closed at $329.23 on June 2, 2026 — barely ten weeks ago — and the $328.11 breakeven sits below the stock's own 52-week high of $332.46. This seller isn't fading some far-fetched moonshot. They're betting IBM doesn't reclaim a price it traded at this past summer, at any point between now and January 2028.
🏢 Company Overview
International Business Machines Corporation (NYSE: IBM), founded in 1911 and headquartered in Armonk, New York, is a Technology / Information Technology Services company (GICS classification) with a current market cap of ≈$220.3B. CEO Arvind Krishna runs a company organized into four reporting segments: Software (hybrid cloud + AI platforms, ≈45% of revenue), Consulting (strategy and technology services), Infrastructure (servers and storage), and Financing.
Red Hat lives inside Software as the Hybrid Cloud line and is currently IBM's healthiest growth engine — +11% in Q2 2026, accelerating from +8% constant currency in FY2025. Quantum computing is a separate, heavily funded strategic bet: on June 2, 2026, IBM committed more than $10 billion over five years toward the world's first fault-tolerant quantum computer, targeted for 2029 — a year past this option's expiration.
The dividend is central to this stock's identity. IBM pays $6.76/year (2.89% yield), has raised its payout for 30 consecutive years, and has maintained payments for over 110 years. But dividend growth is nearly flat — just +0.60% over the past year — and IBM's share count is actually rising (+1.26% year-over-year) with no offsetting buyback. This is a high-current-yield, near-zero-growth income stock, not a dividend-growth compounder.
💰 The Trade, Plain English
A desk printed a block cross — a pre-negotiated trade between two counterparties who already agreed on price, matched off the open book — selling 5,000 January 2028 $300 calls and collecting ≈$14.06M up front. Prior open interest at this strike was 1,307 contracts against 5,000 traded today, so this is a proven new position, not a closing trade.
| Field | Value |
|---|---|
| Time | 12:54:12 ET |
| Buy/Sell | SELL (reported — mid-priced cross, no aggressor read possible) |
| Call/Put | CALL |
| Expiration | 2028-01-21 |
| Premium | $14,055,000 (5,000 × 100 × $28.11) |
| Strike | $300 |
| Volume | 5,000 |
| OI (prior) | 1,307 |
| Size | 5,000 |
| Spot | $234.39 |
| Option Price | $28.11 |
| Option Symbol | IBM20280121C300 |
🤝 Flow type: BLOCK CROSS. No urgency verbs apply here — this was a negotiated, known-counterparty trade, not a lit sweep hitting the offer.
Full contract detail lives on IBM's flow page and the option's own chart.
✅ RESOLVED — A Genuinely New 5,000-Lot Short, Plus 313 More
Updated 2026-08-13 pre-market. Resolving OPRA snapshot timestamped August 13 (reflects the August 12 close, after this print); baseline is the August 12 snapshot (reflects the August 11 close, before this print).
| Leg | Baseline (Aug-12) | Resolving (Aug-13) | Δ | Print size | What we published | Verdict |
|---|---|---|---|---|---|---|
| Jan-21-2028 $300 call (sold) | 1,307 | 6,620 | +5,313 | 5,000 | "rise to roughly ≈6,307 (1,307 + 5,000)" | ✅ OPEN (STO) — 106% of size |
Confirmed open with no transfer drag. The +5,313 exceeds the 5,000 print by 313 contracts, so not only did the entire block become new open interest, additional selling arrived at the same strike. The falling-OI case that would have made this a buy-back never materialised.
The premium was collected against new risk. A desk now carries a 5,000-lot short call obligation at $300 into January 2028 that did not exist on August 11.
Still unproven: whether the seller holds IBM shares behind the calls. Open interest is identical for a covered write and a naked one, and the tape cannot see the equity side.
🤓 What This Actually Means — Plain English
Selling a call you don't own shares against is called a naked short call, and this is about as textbook as it gets: 5,000 contracts, no offsetting long stock or long call visible in this print, sold for $28.11 each = $14.06M collected today.
Here's the deal on what "collected" means. The seller pockets the full $14.06M right now, in cash. That's their maximum possible profit — full stop. If IBM sits anywhere at or below $300 on January 21, 2028, every one of those 5,000 contracts expires worthless and the seller keeps every dollar. That's the entire upside of this trade.
Now here's why "open-ended" is not a figure of speech. If IBM is above $300 at expiration, the seller owes the buyer the difference — and there is no ceiling on how high IBM can go. At $400, the seller is on the hook for $100 per share on 500,000 shares' worth of exposure, partially offset by the $28.11 they already collected. At $500, it's worse. There is no cap. This is fundamentally different from a covered call (where you already own the stock) or a spread (where a bought option caps the loss). Selling this call is short 500,000 shares of upside with unlimited downside on the short side of that bet.
Look at the option price itself: $28.11, against zero intrinsic value — the stock is nowhere near $300, so 100% of that premium is pure time value, a bet on what might happen over 17 months. That's the seller's entire edge: time decay. Every day that passes without IBM rallying meaningfully, that $28.11 erodes toward zero, and the seller's paper position gets closer to being able to buy back the call for less than they sold it (or just let it expire worthless). Selling 17 months of time value on a name that just fell 25% in a single session is a bet that the recent chaos settles down — not that IBM can't ever move, but that it doesn't move up 40% before January 2028.
The math that matters: $300 is ≈24.3× and the $328.11 breakeven is ≈26.6× FY2026 consensus EPS of $12.33 — against IBM's own forward multiple today of ≈18.6×. Getting there requires either a big re-rating, a big earnings step-up, or both.
📈 Technical Setup
One-year chart
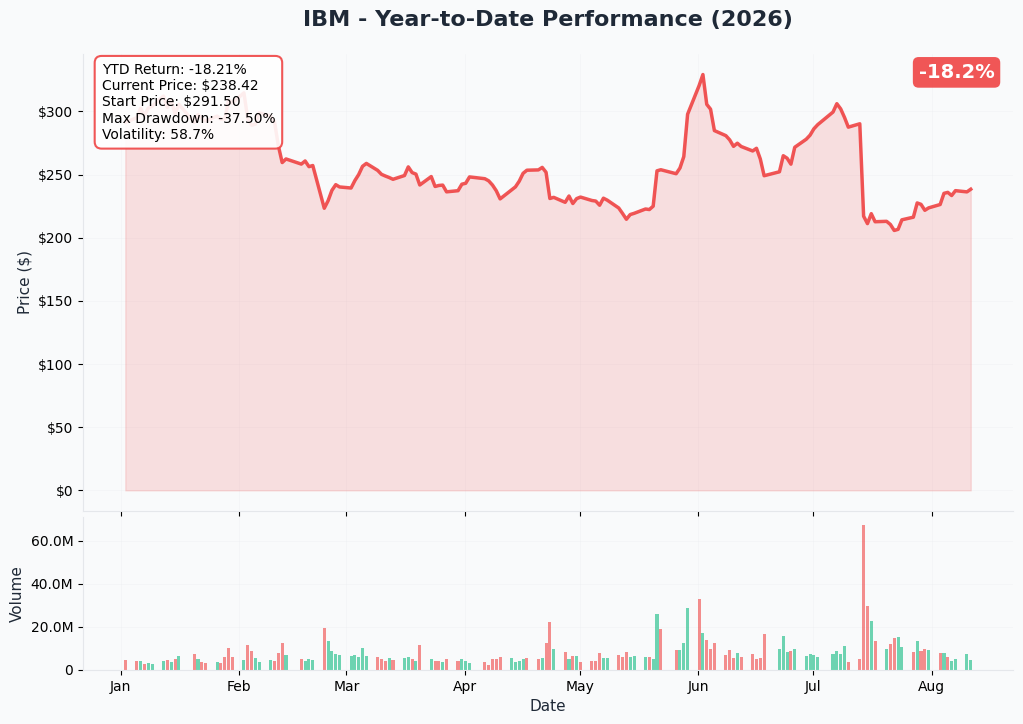
The one-year chart tells its own story: IBM is down ≈18% over the period, and the shape is dominated by one thing — a violent round trip. The stock ran up to a 52-week high of $332.46, then cratered on the July 14 pre-announcement, bottomed near $199, and has spent the past three weeks clawing back to the low $230s. This is not a steady climb the seller is fading — it's a stock that just proved it can move 25% in a single session in either direction.
Gamma-based support & resistance
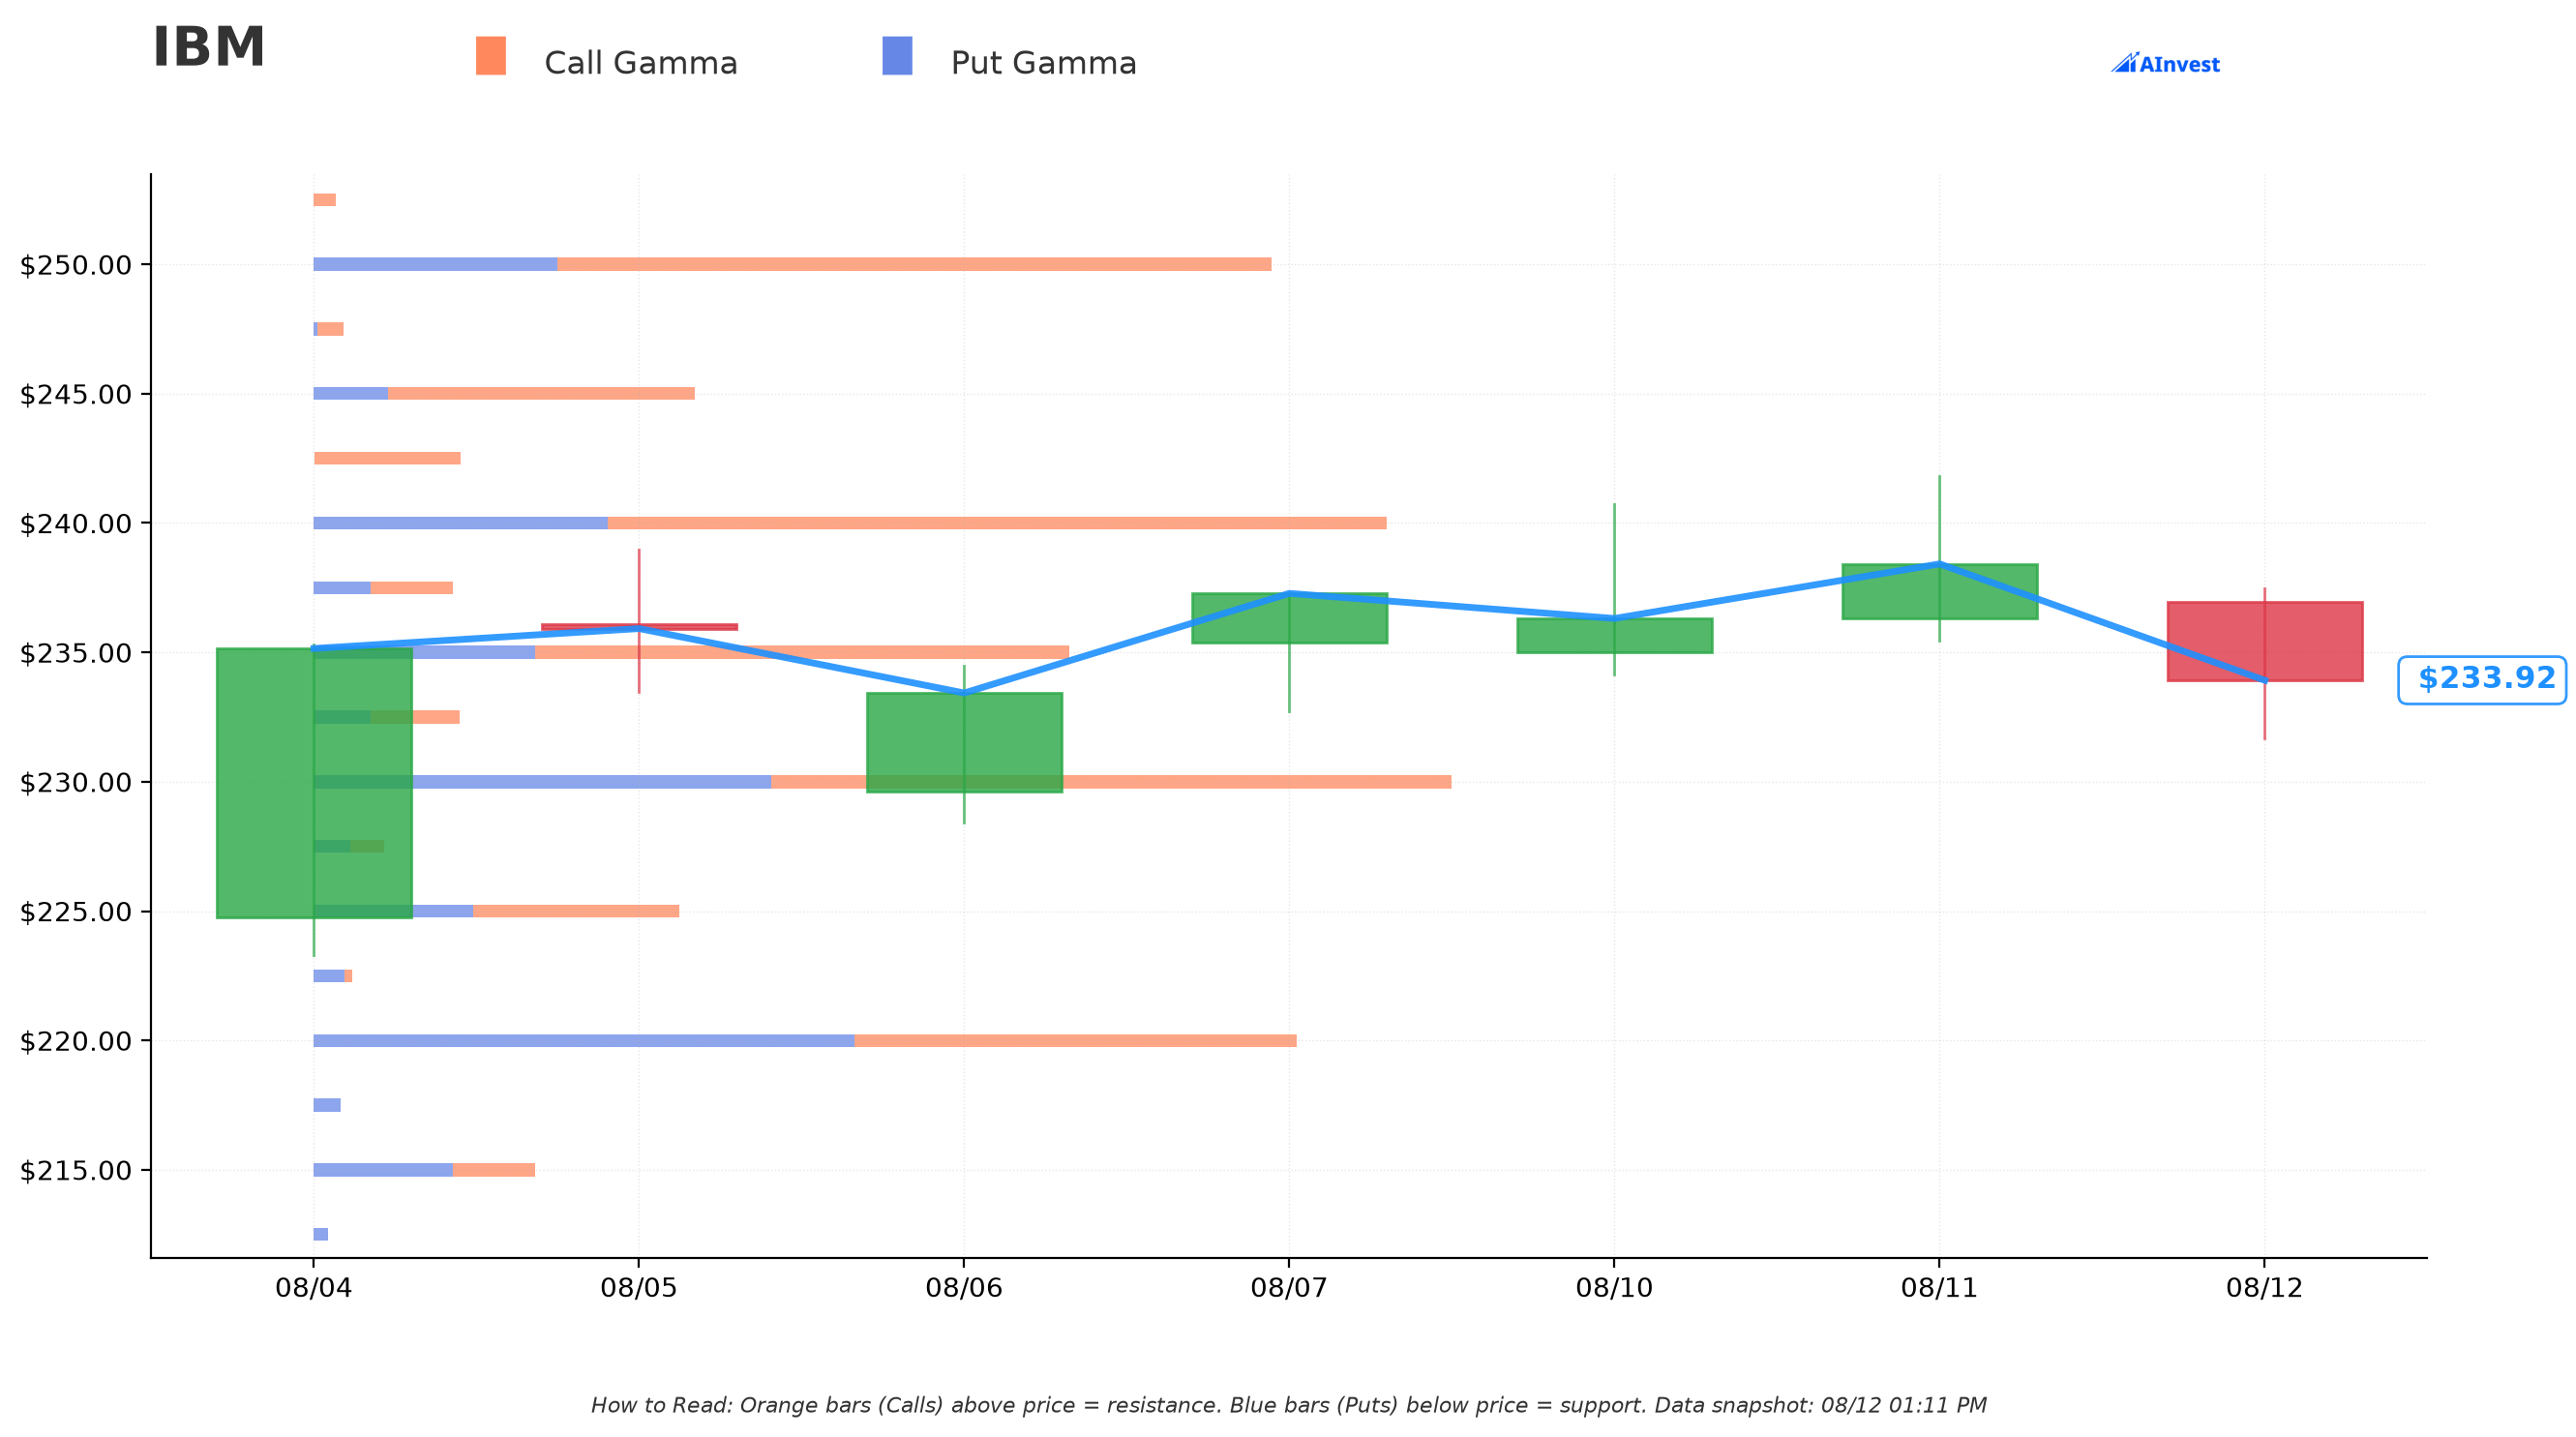
Per today's dealer-positioning read (spot $233.80): the nearest resistance sits at $235 (Strong), with a heavier wall at $240. On the downside, $230 is Very Strong support — the biggest gamma concentration on the board — backed up by $220 (Strong) further below. In plain terms: dealer hedging flows currently cluster tightly around the $230–$235 range, meaning short-term price action is likely to be pinned near here barring a fresh catalyst. None of this says anything about where IBM sits in 17 months — it's a snapshot of today's options positioning, not a forecast for 2028.
Implied move
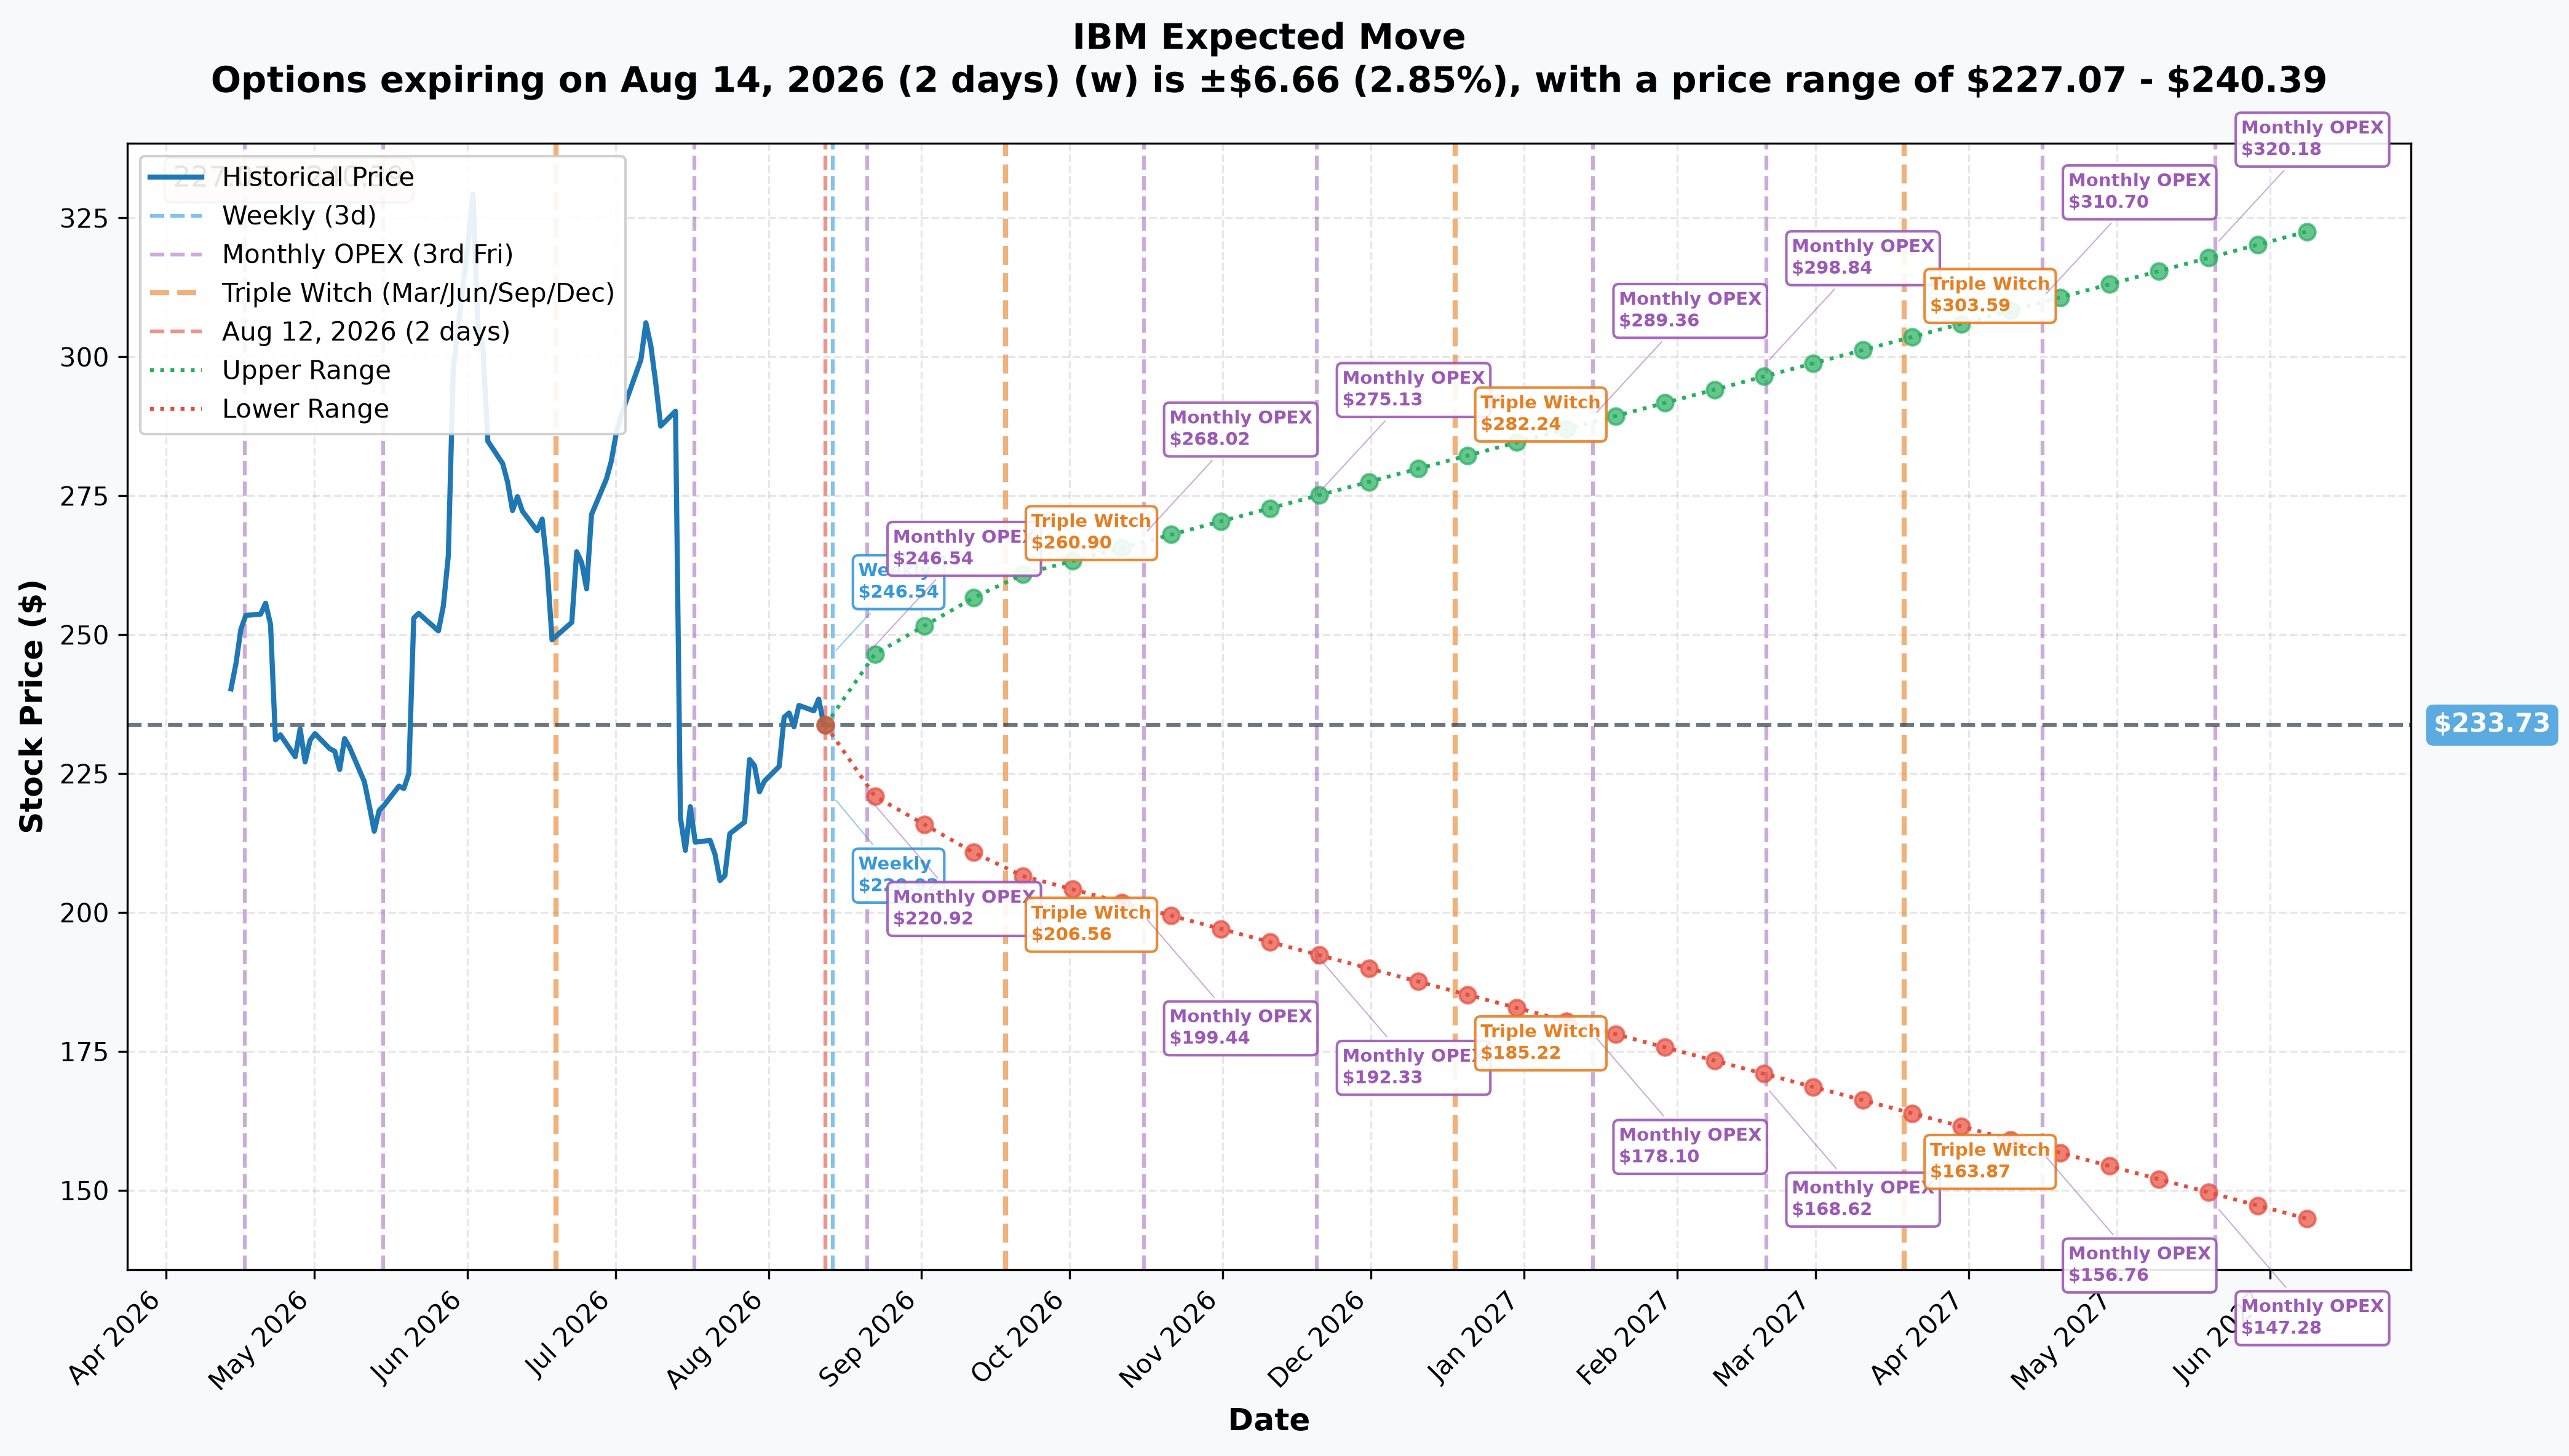
The options market is currently pricing:
- ±2.85% by August 14 (2 days) → $227.07–$240.39
- ±5.26% by August 21 (monthly opex) → $221.43–$246.03
- ±11.32% by September 18 (quarterly triple-witch) → $207.27–$260.19
Even the widest near-term window here — 37 days out — doesn't get remotely close to the $300 strike, let alone the $328.11 breakeven. That's expected and normal; this is a 527-day trade, and short-dated implied move isn't meant to price a 17-month tail. It does underscore how far away $300 currently sits from where the market expects IBM to trade over the next five weeks.
🎪 Catalysts
Keep these separate: the option expires 2028-01-21. Every date below is a company event with its own date — none of them is the expiration.
What already happened (last three months)
The dominant event of the quarter, and the reason IBM sits where it does today: on July 14, 2026, IBM released a preliminary CEO letter disclosing that Q2 revenue would come in at only +1%, driven by a shortfall in IBM Z (mainframe) performance. The stock fell −25.21% in a single session — from $290.23 to $217.07 on 67.4M shares — and eventually bottomed at $199.19 on July 23, its current 52-week low.
The actual Q2 2026 results, reported July 22: revenue $17.162B (+1.09%), operating EPS $2.93 — exactly in line with consensus, ending a run of seven beats in the prior eight quarters. IBM Z fell 42% and Transaction Processing software fell 8%, while Red Hat grew 11%, Data grew 19%, and Distributed Infrastructure grew 37% with a ≈$500M order backlog. Full-year revenue guidance was cut from "more than 5%" constant-currency growth to "4-to-5%."
Importantly, free cash flow guidance was NOT cut — IBM still guides to FY2026 FCF of roughly $15.7B, up ≈$1B from FY2025's $14.7B, per the Q2 2026 release. The catch: H1 2026 FCF was flat year-over-year at $4.8B, meaning the entire increase has to show up in the second half — a fully back-loaded guide.
Analysts responded with a uniform round of cuts: Morgan Stanley $293→$190, Susquehanna $303→$225, Argus $360→$280, Jefferies $320→$260, all per the MarketBeat price target history. Consensus now sits at $244.16 (25 analysts) or $265.40 (27 analysts, per MarketBeat's forecast) — with zero Strong Buy ratings on the stock. Only the single highest target on the Street, $350, clears the $328.11 breakeven.
Since the drop, multiple law firms have opened securities investigations into whether IBM misrepresented the Z slowdown — these are investigation notices, not filed class actions, and should be treated as an overhang to monitor, not a confirmed liability.
What's ahead — the expiration alignment worth noting
Five quarterly earnings reports land inside this option's window, based on IBM's observed reporting cadence (none of these dates are company-confirmed yet):
- ≈October 21, 2026 — Q3 2026
- ≈January 27, 2027 — Q4/FY2026 + initial FY2027 guidance
- ≈April 21, 2027 — Q1 2027
- ≈July 21, 2027 — Q2 2027
- ≈October 20, 2027 — Q3 2027
The sixth report — Q4/FY2027 — is estimated to land ≈January 26, 2028, roughly five days after the January 21, 2028 expiration. That's a real structural asymmetry in the seller's favor: the option dies just before the report that would carry full-year results and the next year's guidance. This pattern is showing up more than once on today's board — a different desk used this exact same January 2028 expiration to sell Cisco puts today, which supports reading it as simply the longest-dated standard listing available, not a deliberate bet tied to any specific IBM event. Nothing here is company-confirmed.
Five ex-dividend dates also fall inside the window — ≈November 10, 2026, ≈February 10, 2027, ≈May 10, 2027, ≈August 10, 2027, and ≈November 10, 2027 (the August 10, 2026 ex-date already passed two days before this trade). Because this is a short call, each ex-date is a genuine early-assignment risk if IBM is ever meaningfully above $300 — an in-the-money call holder can exercise early to capture the dividend, forcing the writer to deliver both the shares and the payout. Right now that risk is dormant: the option carries $28.11 of pure time value against a $1.69 quarterly dividend, a cushion of roughly 16.6x. It concentrates almost entirely on the final ex-date, ≈November 10, 2027, roughly ten weeks before expiry, when remaining time value on a deep-in-the-money call could realistically shrink below the dividend. Roughly $8.50/share (≈3.6% of spot) pays out across the five ex-dates inside the window — a structural tailwind for the seller, since dividends paid out reduce the stock's expected forward path.
🎲 Four Ways to Read This
🎲 The YOLO trader
You're not going to sell 5,000 naked LEAP calls collecting $14M — that's an institutional-scale, margin-heavy position most retail accounts can't even open. But you can express the opposite side cheaply: a small handful of the same $300 calls, or further-out $350s, is a lottery ticket on IBM re-rating back to its June multiple. Just understand you're betting against the exact flow described in this article, and the desk on the other side is pricing you as the long shot. Size it like a lottery ticket, because that's what it is.
📈 The swing trader
This trade tells you almost nothing about the next few days or weeks — it's a 527-day position, and the gamma levels here ($230 support, $235 resistance) are the more relevant map for swing timeframes. If you're trading IBM's bounce off the $199 low, watch the $230 Very Strong support / $235 Strong resistance band from the gamma read, and use the implied-move ranges (±2.85% to Aug 14, ±5.26% to Aug 21) to size stops. This block cross is background noise for a trade measured in days.
💰 The premium collector
This is the trade to study, because it's the same one the desk just put on — just smaller. The core case for selling far-dated OTM IBM calls: you're capturing 17 months of time decay on a low-beta (0.71), dividend-anchored Dow stock that's unlikely to string together a sustained +40% move, and the dividend payouts inside the window (≈$8.50/share) work in your favor by depressing the stock's expected forward price. The case against it, and it's a real one: the $328.11 breakeven sits below a price IBM traded at just ten weeks ago (June 2's $329.23), and below its own 52-week high of $332.46. This isn't an unvisited strike — it's a level the stock cleared recently, on a name that just proved it can move 25% in a day. If you're going to run this strategy, do it with position sizing that assumes IBM could revisit $300+ inside the window, and understand your risk is genuinely unlimited above the strike — this is not a defined-risk spread. Consider whether a credit spread instead of a naked call (selling the $300 and buying a $340 or $350 call against it) caps your risk at a small fraction of the premium collected, in exchange for giving up some of the credit.
🌱 The beginner
Selling a call you don't own shares against is one of the highest-risk things you can do in options — full stop. The person on this trade collected $14.06M today, and that's the most they can ever make. If IBM goes to $400, $500, or higher, their losses have no ceiling, and it doesn't matter how "far away" the strike looked when they sold it. If you're new to options, this is a strategy to understand, not to copy at this scale — and if you ever do sell a call, only do it against shares you already own (a "covered call"), where your downside is limited to the stock you hold, not open-ended.
⚠️ Honest Limits — What We Don't Know
What the tape cannot prove: This printed as a block cross at the midpoint, meaning it took no liquidity — there's no aggressor signal to lean on, so the SELL label here is reported by the capture, not proven by NBBO positioning. We don't know the broker, the counterparty's identity, whether either side has an offsetting position elsewhere (stock, other options, or a hedge in another instrument), or the seller's true motive — this could be pure premium collection, a hedge against another position, or something else entirely.
Research gaps, disclosed honestly: The catalyst research behind this article was compiled entirely through direct page fetches after the search budget was exhausted for the session — IBM's own investor-relations page, its investor-events calendar, the SEC EDGAR filing system, the exchange's LEAPS education page, and several individual press-release URLs all returned errors and could not be retrieved. As a result: there is no updated generative-AI book-of-business figure available past the last reported >$12.5B at FY2025; no consulting bookings or backlog figure was disclosed in the Q2 2026 release; no FY2027 or FY2028 consensus estimates exist yet (only FY2026); no mainframe-successor date has been announced by IBM (any 2027 timing discussion is speculative); and no exact year-to-date return figure was sourceable — performance here is anchored to specific sourced closes ($329.23 on June 2, $306.13 on July 7, $217.07 on July 14, $234.11 on August 12) rather than a clean YTD number.
Nothing here is a recommendation. Confirm all forward dates against IBM's own announcements before acting on any of them, and remember that selling naked calls carries genuinely unlimited risk — size accordingly.
Last updated: 2026-08-13 (pre-market) — the next-day OPRA open-interest snapshot confirmed the open. Jan-2028 $300C 1,307 → 6,620 (+5,313 against 5,000, 106% of size): OPEN (STO). The ⏳ callout was replaced with the ✅ RESOLVED box; no thesis or title change was required.