🛡️ IGV $9.50M December $90 Put Buy — A Software ETF Just Bought Insurance on Its Own Melt-Up
2026-08-11 | 🤝 Floor Block | Proven Open
🔄 Updated 2026-08-12 pre-market — the open is confirmed, and the hedge is far bigger than the captured blocks showed. Open interest on the December $90 put went 2,742 → 52,572 (+49,830) — against the ≈37,000 we published from the two blocks we captured. Nearly all of the strike's 52,020-contract day volume turned into new open interest, so the protection bought here is roughly 45% larger than this article's trade table implies. See the ✅ RESOLVED box.
🎯 The Quick Take
Someone put on ≈$9.50 million of downside protection on the iShares Expanded Tech-Software Sector ETF (IGV) today — 34,368 December 18, 2026 $90 puts, bought in two floor-negotiated blocks against a fund trading at $104.39. That strike sits ≈13.8% below spot, and prior open interest was only 2,742 contracts, so this is a genuinely new position — not someone closing an old one. This isn't a bet that software crashes tomorrow; it's a hedge that only starts paying if the entire summer rally gets given back.
🏢 What IGV Actually Is Now
The iShares Expanded Tech-Software Sector ETF tracks the S&P North American Expanded Technology Software Index — a market-cap-weighted basket of US and Canadian software names. Fast facts, current:
- AUM: ≈$14.72B
- Expense ratio: 0.39%
- Holdings: 110, but top 10 = 62.57% of the fund
- 52-week range: $73.93 – $117.99
- YTD return: −1.78%, despite being +12.34% in the last month
Top 10 holdings (weights as of ≈August 6, 2026):
| # | Ticker | Company | Weight |
|---|---|---|---|
| 1 | PANW | Palo Alto Networks | 10.11% |
| 2 | MSFT | Microsoft | 10.00% |
| 3 | PLTR | Palantir Technologies | 9.52% |
| 4 | CRWD | CrowdStrike Holdings | 7.32% |
| 5 | ORCL | Oracle | 5.67% |
| 6 | CRM | Salesforce | 5.30% |
| 7 | NOW | ServiceNow | 4.23% |
| 8 | ADBE | Adobe | 3.68% |
| 9 | FTNT | Fortinet | 3.49% |
| 10 | CDNS | Cadence Design Systems | 3.26% |
Here's the part that actually matters for this trade. IGV calls itself a software fund, but do the math on the weights: Palo Alto (10.11%) + Microsoft (10.00%) + Palantir (9.52%) + CrowdStrike (7.32%) = 36.95% of the fund is AI-momentum and cybersecurity names trading at extreme multiples. The classic seat-based SaaS complex — Salesforce, ServiceNow, Adobe, Intuit, Workday — adds up to just 17.53%. So a put on IGV is mostly a bet against an AI/cybersecurity momentum unwind, and only secondarily a bet on the "AI eats SaaS" thesis that gets all the headlines.
💰 The Trade, Plain English
Two clips, same contract, same day. Both printed as 🤝 floor blocks — negotiated on the exchange floor between a broker and a known counterparty, not aggressive orders slamming into the lit book. No urgency here; this was arranged.
| Time (ET) | Buy/Sell | Call/Put | Expiration | Strike | Size | Prior OI | Spot | Option Price | Premium | Order Type | Strategy |
|---|---|---|---|---|---|---|---|---|---|---|---|
| 10:03:08 | BUY | PUT | 2026-12-18 | $90 | 25,000 | 2,742 | $104.39 | $2.78 | $6,950,000 | BTO | Long Put – Portfolio Hedge |
| 11:17:00 | BUY | PUT | 2026-12-18 | $90 | 9,368 | 2,742 | $104.30 | $2.72 | $2,548,096 | BTO | Long Put – Portfolio Hedge |
| Total | 34,368 | ≈$9,498,096 |
Option symbol: IGV20261218P90 Combined size: 34,368 contracts ≈ 3,436,800 shares of underlying exposure ≈ 2.4% of IGV's 140.35 million shares outstanding Weighted average premium paid: $2.764 per contract
✅ RESOLVED — Open Confirmed, and the Position Is ≈45% Bigger Than We Captured
Updated 2026-08-12 pre-market. Resolving OPRA snapshot timestamped August 12 (reflects the August 11 close, after this print); baseline is the August 11 snapshot (reflects the August 10 close, before this print).
| Leg | Baseline (Aug-11) | Resolving (Aug-12) | Δ | Captured size | What we published | Verdict |
|---|---|---|---|---|---|---|
| Dec-18 $90 put (bought) | 2,742 | 52,572 | +49,830 | 34,368 | "approximately 2,742 + 34,368 ≈ 37,000" | ✅ OPEN (BTO) — and larger than predicted |
The open is not in doubt, and it is bigger than the table below. We flagged that the strike's full-day volume ran to 52,020 contracts against the 34,368 we captured in two blocks, and said the open-interest print would tell us how much of that extra flow was also new. The answer is: essentially all of it. Open interest rose 49,830 — roughly 97% of the strike's entire day volume converted into new open interest, and ≈15,500 contracts more than our captured blocks alone would produce.
What that changes. Every dollar figure in the analysis below is a floor. On the $2.72–$2.78 prices that printed, ≈49,830 new contracts represents roughly $13.6M–$13.8M of premium committed to December $90 puts on a single session, against the ≈$9.50M headline. The notional protected rises in the same proportion — this is a materially larger hedge than the two captured floor blocks describe, and the "someone is buying insurance on the software melt-up in size" reading gets stronger, not weaker.
Nothing in the direction or thesis below needs revision; only the magnitude was understated.
🤓 What This Actually Means — Plain English
This is portfolio insurance, not a short position. A put option gives its buyer the right to sell IGV at $90 anytime before December 18, 2026. Someone here paid ≈$9.50 million for that right on 3.44 million shares' worth of exposure. If IGV stays above $90 through expiry, the entire premium is lost — the put expires worthless, exactly like an insurance policy you never file a claim on. If IGV falls below $90, the put pays off dollar-for-dollar below that strike, offsetting losses on a long stock/fund position.
What 13.8% out-of-the-money costs. $2.78 per contract on a $104.39 fund is ≈2.7% of spot for roughly 4.2 months of coverage. Do the arithmetic on the breakeven: $90 strike minus the ≈$2.76 average premium paid = ≈$87.24. That's ≈16.4% below today's price. Below $87.24, the position is profitable in its own right; between $90 and $87.24, it recovers some but not all of the premium; above $90, it's a pure cost — the price of not having to watch the position unhedged.
What it protects. A move back down toward where IGV traded before this summer's rally — the fund was near $90.80 in early May and $92.50 on July 10, so the strike is placed almost exactly at the pre-melt-up level. This hedge starts earning the moment the entire +12.34% one-month run gets erased.
What it does NOT protect. Anything short of that. A garden-variety pullback from $104 to $95 — an 8.9% drawdown — pays essentially nothing at expiry; the hedge is designed for a full round-trip, not routine chop. It also doesn't isolate which part of the fund breaks: IGV is a blend of AI-momentum names (Palo Alto, Microsoft, Palantir, CrowdStrike, ≈37% of the fund) and legacy SaaS names under separate multiple-compression pressure (Salesforce, ServiceNow, Adobe, ≈17.5%). A single fund-level put can't tell you which story played out — only that "software, broadly, gave it back."
One condition that must be said plainly: we could not verify that hedging demand across the software sector is broadly elevated. No IGV skew, put/call ratio, or sector-wide options-flow data was available for this research. What we can say is that the ingredients that typically produce hedging demand are all present and dated — a fast, narrow +12.34% rally into a still-negative YTD print; ≈17.4% of the fund (Palo Alto + CrowdStrike) making fresh all-time highs on ≈August 10 and trading above their own analyst targets; a named short seller publicly positioned against Oracle; and three FOMC dissents in favor of a rate hike at the July 29 meeting against a 35.74 fund P/E. That's a coherent case for why someone might hedge — it is not proof that this trade reflects a broader wave of hedging.
📈 Technical Setup
YTD Chart
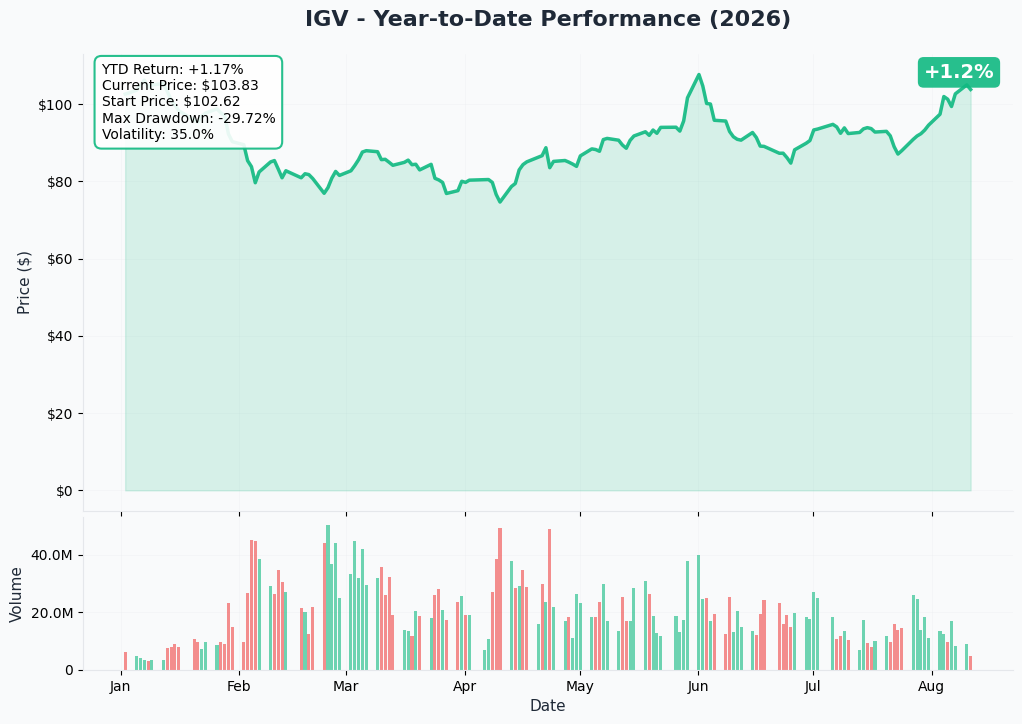
IGV's past year tells the whole story in one picture: a violent January–February de-rating to the 52-week low of $73.93, a slow spring base, and then a sharp mid-July-to-August rip back to $103.82–$104.39 on cybersecurity strength. The fund is still −5.29% over 12 months even after that rally.
Gamma-Based Support & Resistance
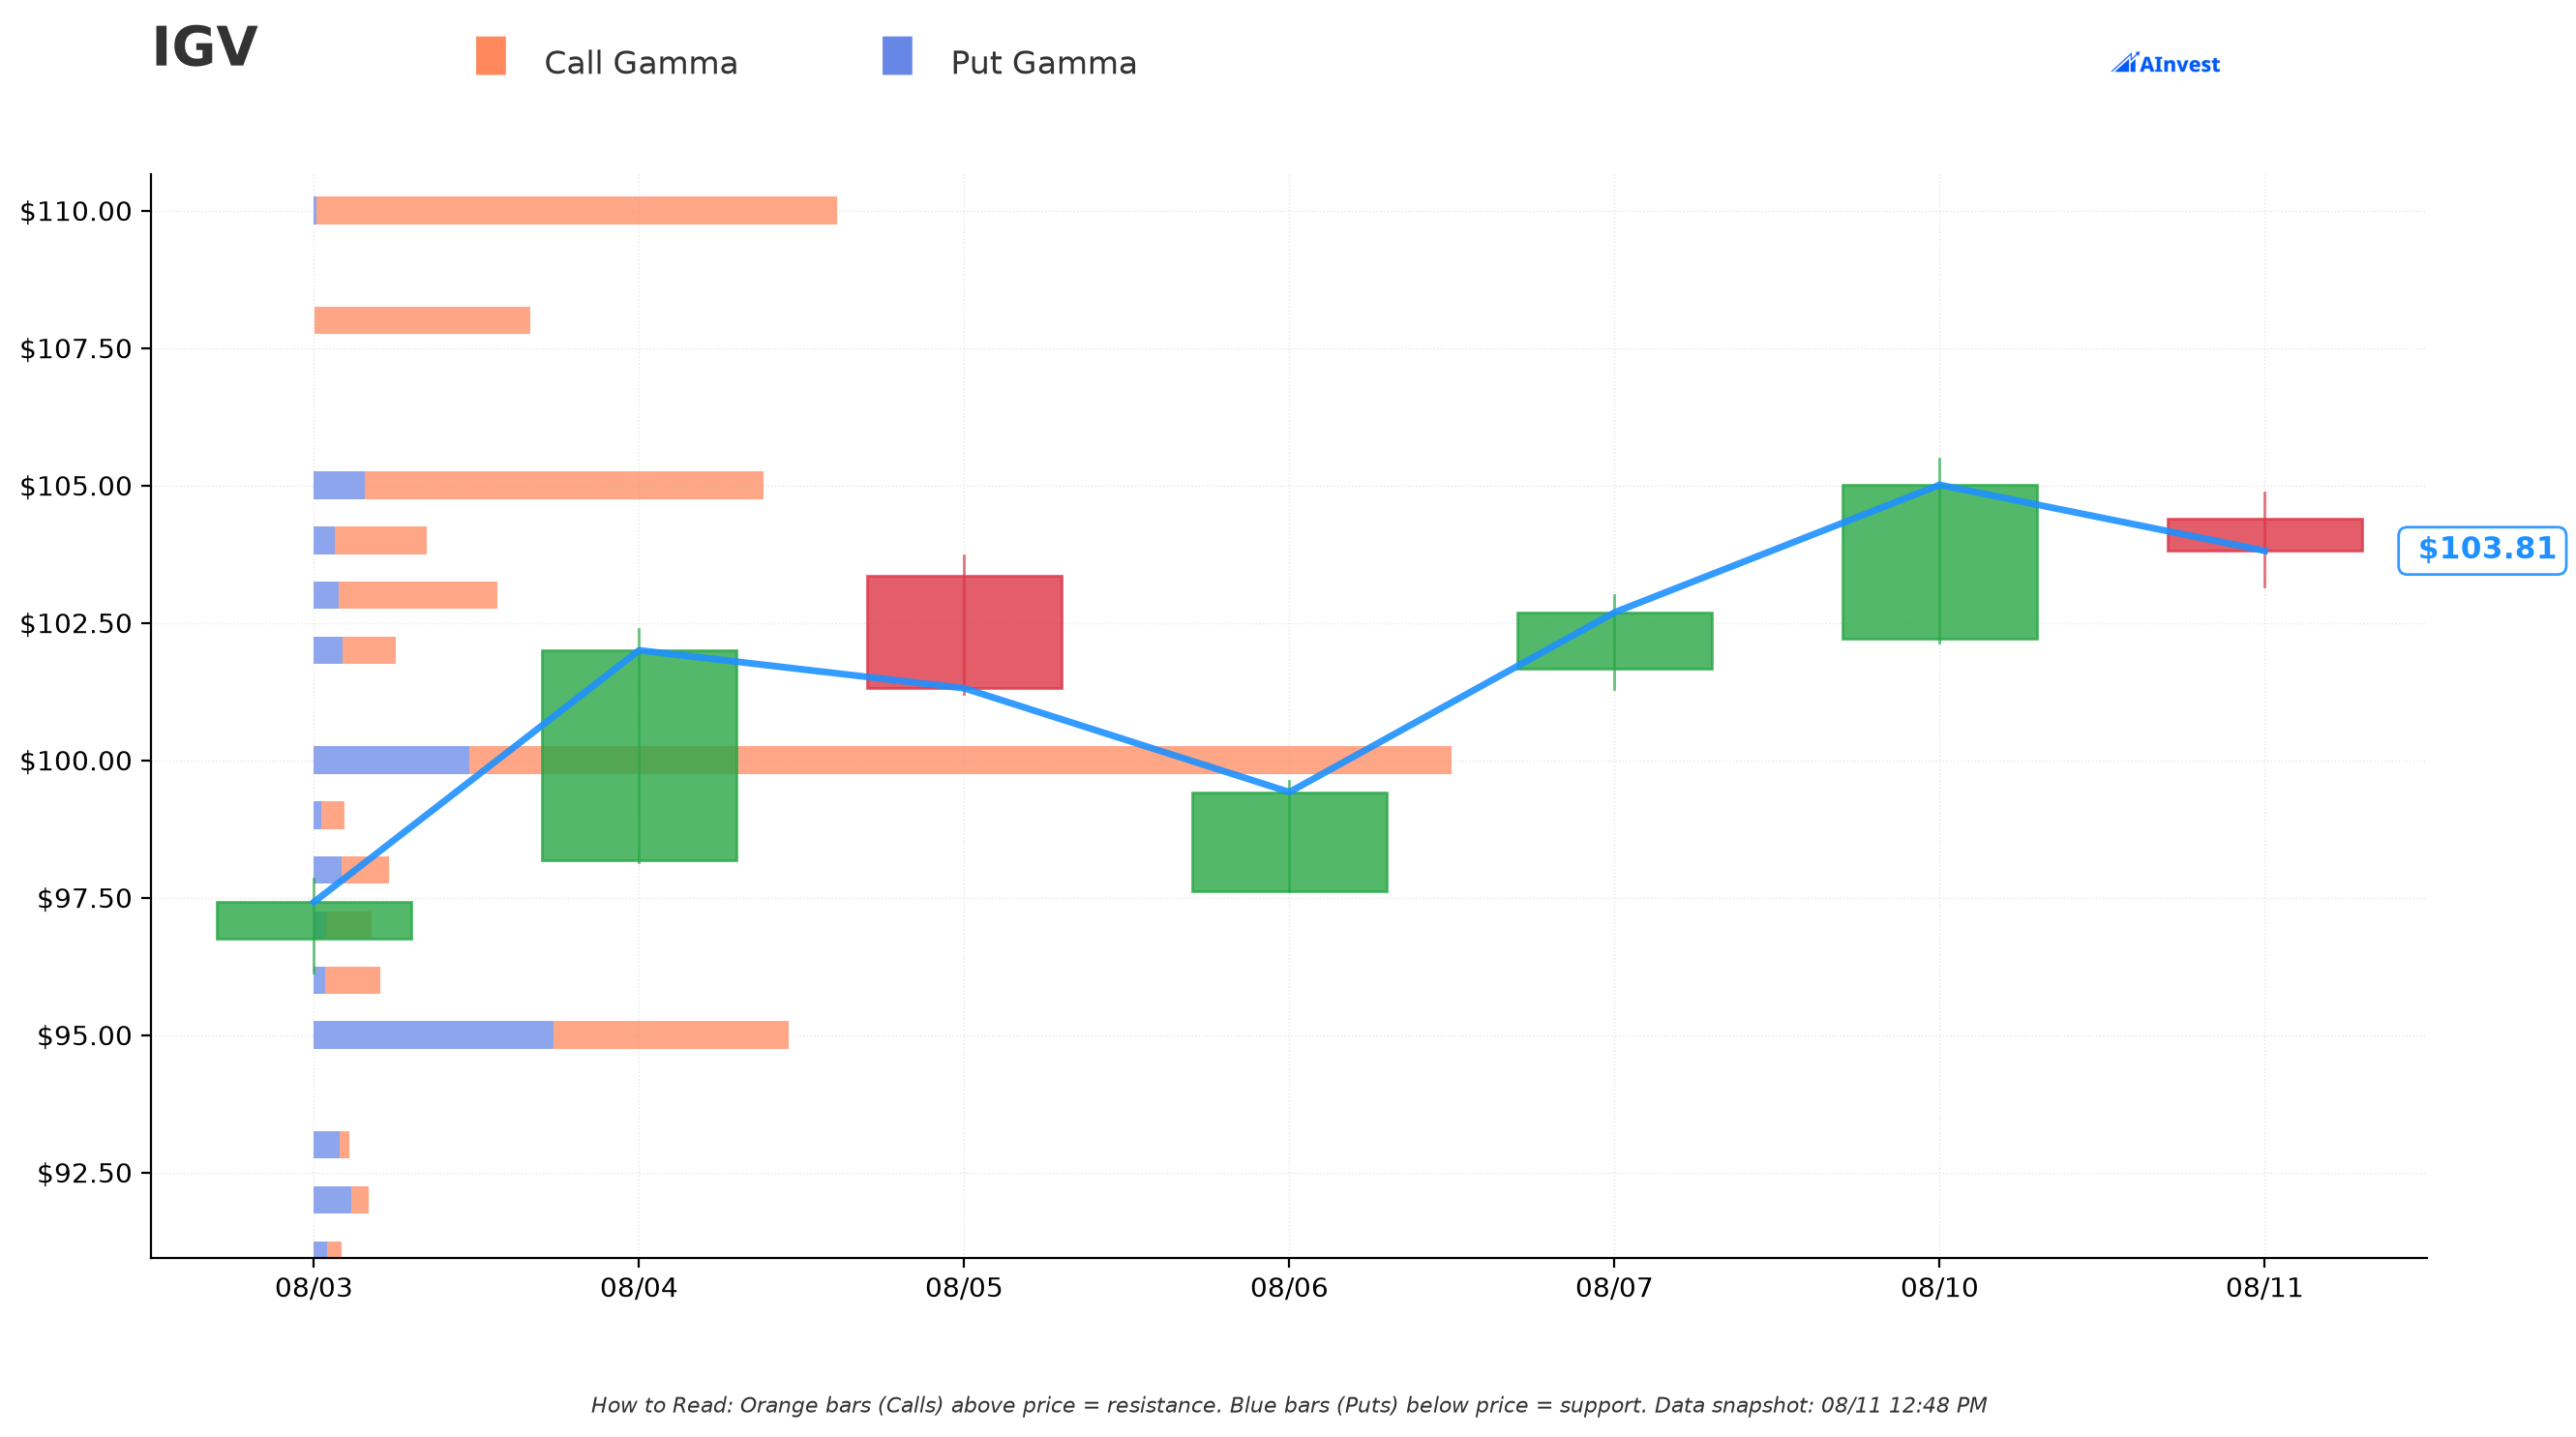
Reading the current gamma map with spot at $103.93:
- Resistance walls: $105 (Very Strong, ≈1.0% away) and $110 (Very Strong, ≈5.8% away) — dealer hedging flow tends to dampen moves through these.
- Support walls: $103 (Strong, right under spot), then $100 (Very Strong) as the first real floor.
- The $90 strike itself already sits on a Support Wall in today's gamma map — total gamma exposure of ≈22.1, split 14.87 puts / 7.20 calls, ≈13.4% below spot. Today's 34,368-contract put buy adds directly onto a level dealers were already watching, which means the $90 strike carries more structural significance than an arbitrary round number.
Implied Move
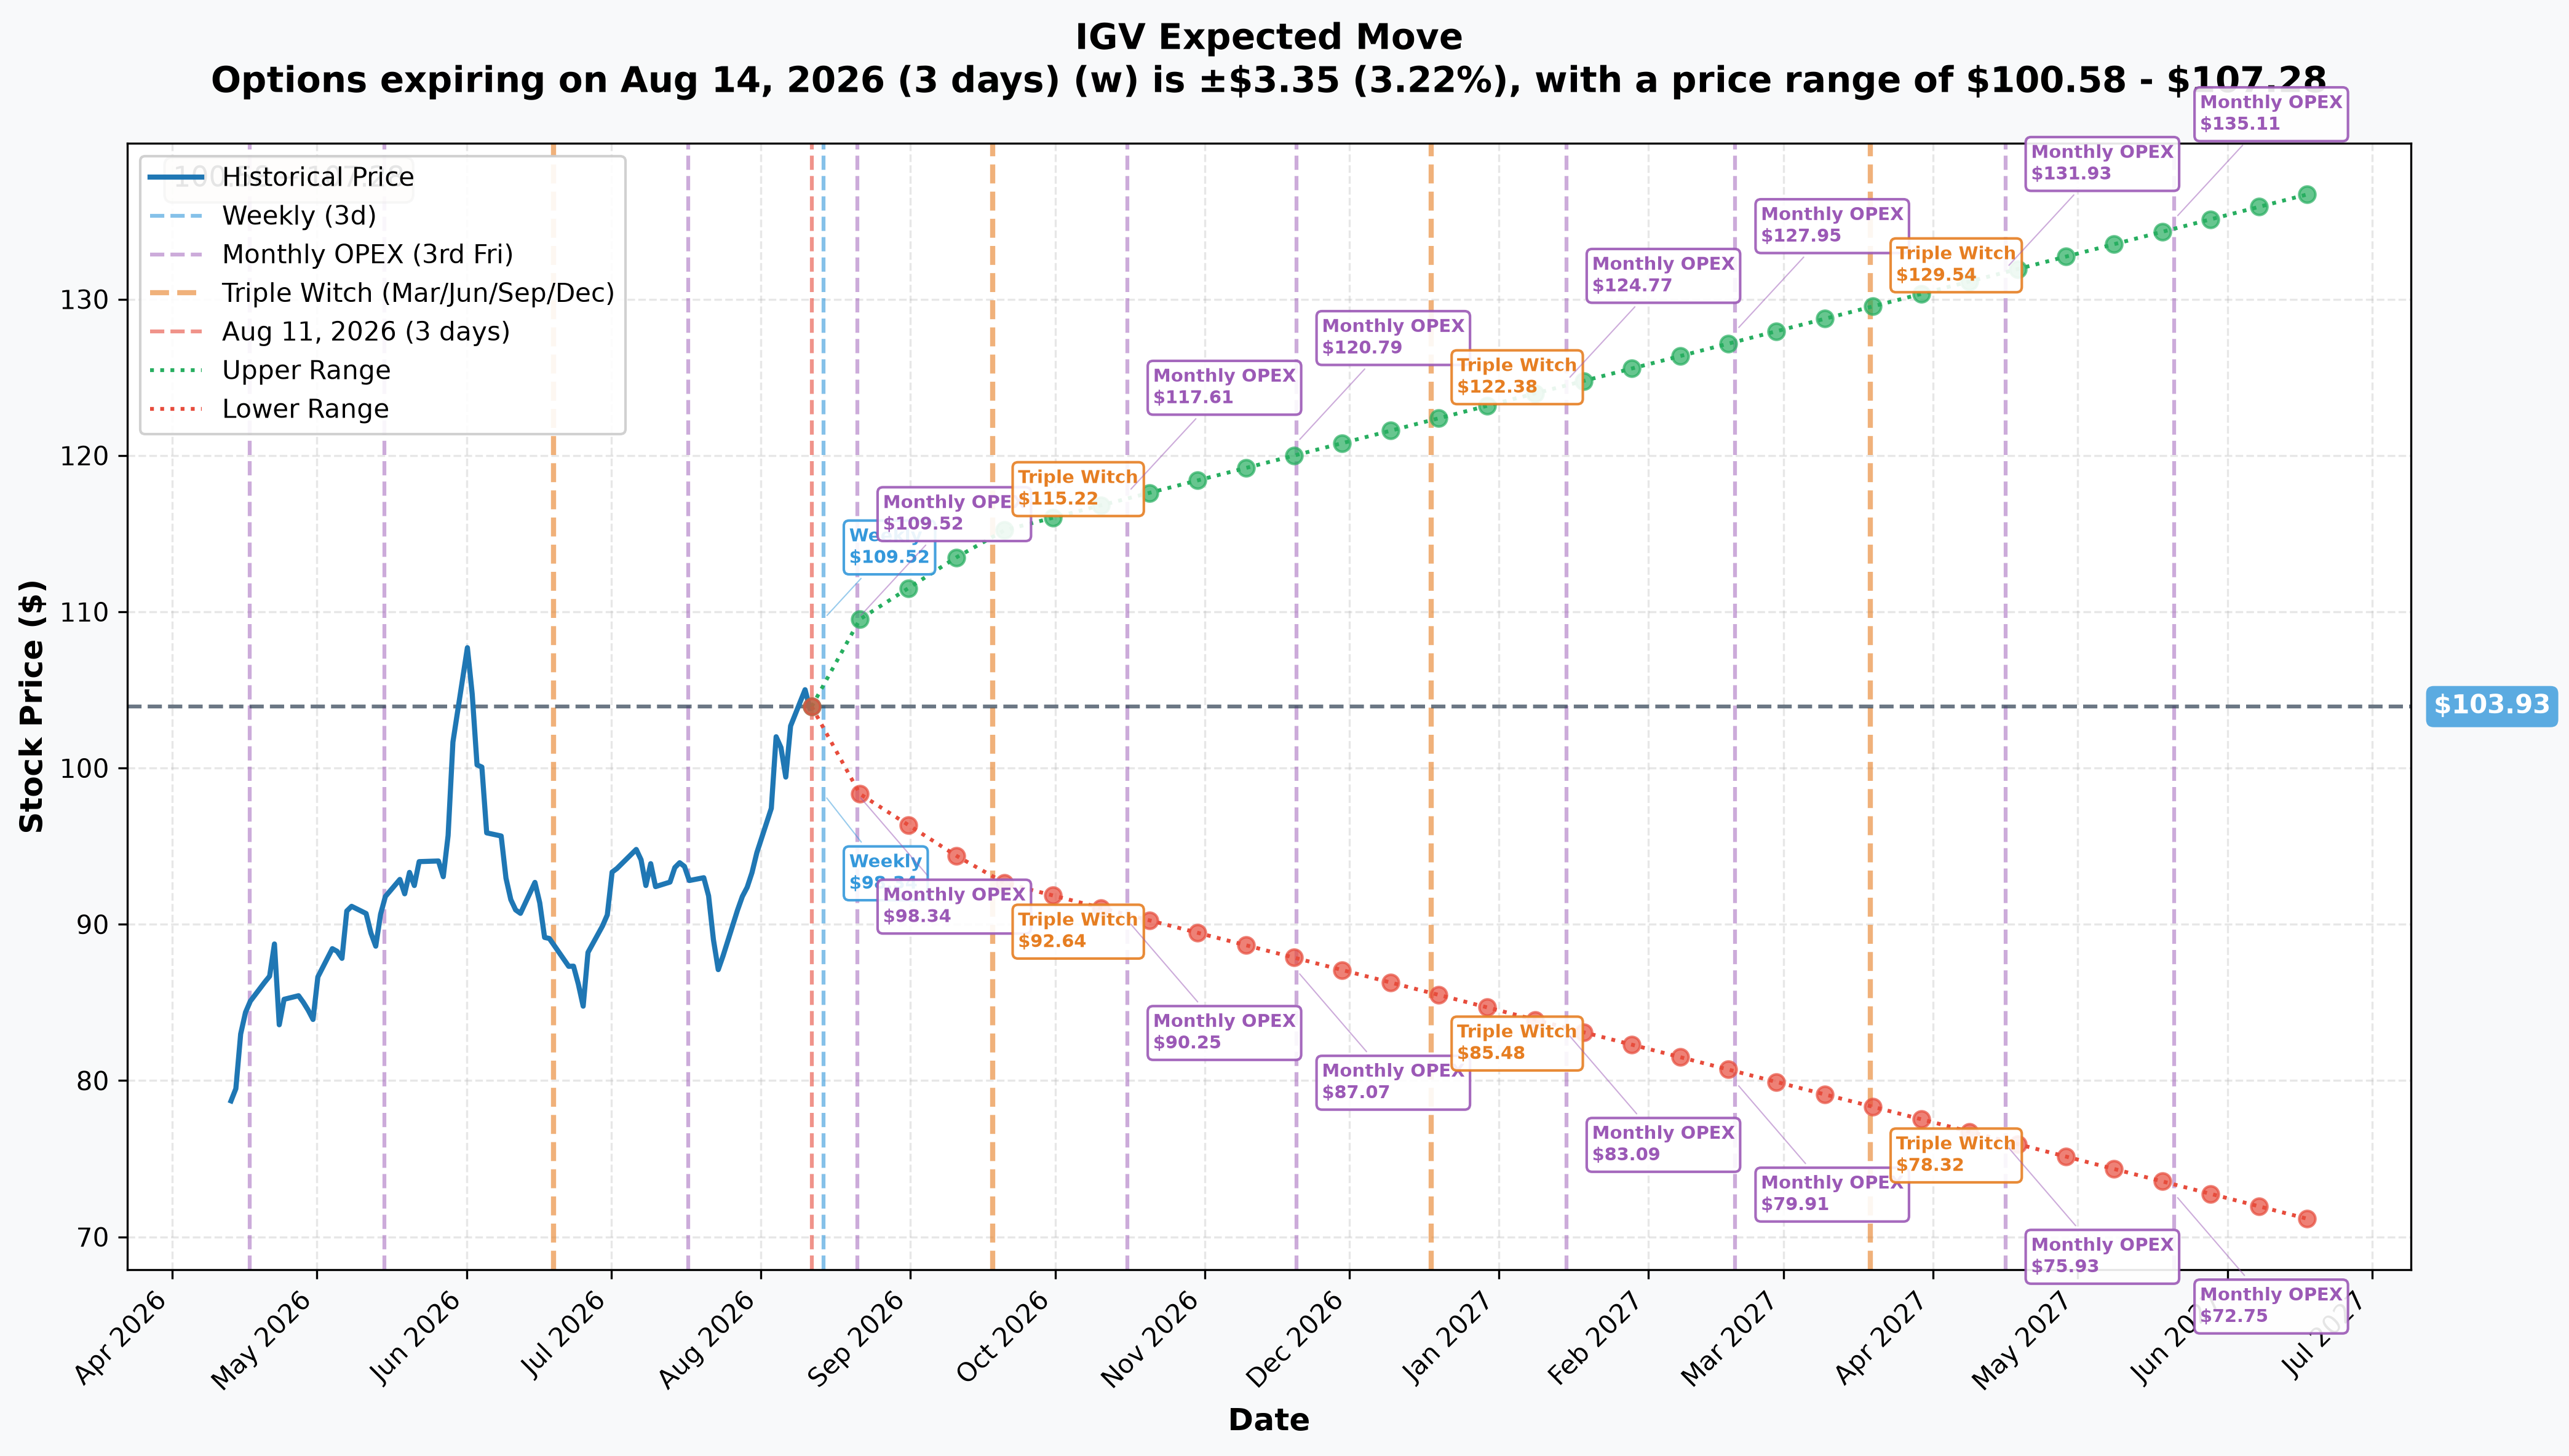
Straight from the current options-priced expected ranges:
| Window | Expiry | Implied move | Range |
|---|---|---|---|
| Weekly | 2026-08-14 | ±3.22% | $100.58 – $107.28 |
| Monthly OPEX | 2026-08-21 | ±5.38% | $98.34 – $109.52 |
| Quarterly / triple witch | 2026-09-18 | ±10.71% | $92.80 – $115.06 |
| December 18 expiry (this trade's window) | 2026-12-18 | — | $85.48 – $122.38 |
That December band matters directly: the market's own volatility pricing already puts the low end of the expected range at $85.48 — below the $90 strike. In other words, a move that reaches this put's strike isn't a tail-risk fantasy; it's within one standard deviation of where the options market already expects IGV could trade by expiry. That doesn't mean it's likely — it means it's not being priced as a lottery ticket.
🎪 Catalysts
Inside the December 18, 2026 expiry window
The December expiry is unusually catalyst-dense — every one of IGV's top-10 holdings reports at least once before expiry, and half of them (32.08% of the fund) report twice, covering roughly 1.5 full earnings cycles, plus three FOMC meetings.
- Wednesday, August 12, 2026 — CPI report, flagged across market commentary as the key near-term input to Fed rate-hike odds.
- August 25 — Intuit FQ4/FY2026 (3.11% weight)
- August 26 — Salesforce FQ2 FY2027 (5.30%) and CrowdStrike Q2 (7.32%)
- August 27 — Workday Q2 (1.21%)
- September 1 — Palo Alto Networks FQ4, the fund's largest holding (10.11%)
- September 8 — Oracle FQ1 FY2027 (5.67%) — the debt/capex referendum, see below
- September 10 — Adobe FQ3 (3.68%)
- September 15–16 — FOMC meeting with a Summary of Economic Projections
- September 18 — quarterly index rebalance / triple witching
- October 27–28 — FOMC meeting
- Late October–early November — expected (unconfirmed) second-cycle prints from Microsoft, ServiceNow, Cadence, Fortinet, Palantir, AppLovin and Datadog
- December 8–9 — FOMC meeting with a Summary of Economic Projections, just 7 trading days before expiry
- Mid-to-late December — expected second-cycle prints from Salesforce, CrowdStrike, Oracle and Adobe, landing in the final two weeks before the December 18 expiry, which also coincides with the quarterly index rebalance and triple witching.
The backdrop driving the hedge
- CNBC's "SaaSpocalypse" debate has become a named market narrative as software stocks swing on AI-disruption fears.
- A concrete demand-side data point: Business Insider reported that Curative's CEO said the company dropped a $600,000-a-year Salesforce contract for an internally AI-built alternative.
- On the consumption-pricing side, the Wall Street Journal reported "Datadog Says Lower Usage From Major AI Customer Could Dent Growth," and the stock fell ≈18% despite beating estimates.
- Oracle (5.67% of IGV) is down ≈42% over 52 weeks, carries $167.43B in debt against −$23.69B of free cash flow, and Reuters described it as "on the cusp of a junk-grade credit rating." Michael Burry has disclosed a short position.
- On the other side of the ledger, Palo Alto Networks and CrowdStrike jumped ≈5% to record highs following the Black Hat cybersecurity conference on ≈August 10, and Microsoft posted FY2026 revenue of $331.84B, +17.8% YoY, with Bernstein raising its price target to $660.
- At the July 29, 2026 FOMC meeting, the Fed held rates at 3.50%–3.75% on a 9–3 vote, with all three dissents favoring a hike — a materially hawkish configuration for a fund carrying a 35.74 P/E.
👥 How Different Readers Should Think About This
🎰 YOLO Trader
You are not the natural buyer of an ETF put that's 13.8% out of the money and floor-negotiated. This structure was built by someone protecting an existing position, not chasing a fast payout — even a sharp 8-9% pullback likely leaves this expiring worthless. If you want convex downside exposure on the AI/software unwind theme specifically, you'd be looking at single names inside the 36.95% momentum cluster (Palo Alto, Palantir, CrowdStrike) where the multiple compression risk is more concentrated, not the diluted ETF. Understand you'd be taking outright directional risk with full loss of premium as the base case, not "riding someone else's smart money."
📊 Swing Trader
The interesting read here is structural, not directional-timing. The $90 strike sits on an existing gamma support wall and lines up with the pre-rally price levels from May and July — that's a level worth having on your chart regardless of this specific trade. If IGV rolls over toward $100 or $95 in the next few weeks, that's normal implied-move-range noise (weekly range alone is $100.58–$107.28); this hedge isn't designed to pay on that kind of move, so don't read a pullback to $98 as confirmation of "the big money was right." The trade only really validates if price approaches $90-$92 into year-end.
💰 Premium Collector
There's no credit-collection angle in today's flow — this was a straight debit put purchase, not a spread or a short premium structure. What it does tell you is where a large, patient position wants a floor: $90. If you already run covered calls or cash-secured puts on IGV, that level (and the $100/$103 gamma support walls above it) are reasonable reference points for strike selection, but you'd be selling premium into a name that just had one of its largest holdings' options desks pay up for protection — worth factoring into your own implied-volatility assumptions rather than assuming today's IV is "expensive" without cause.
🌱 Beginner
This is the cleanest real-world example of what a "protective put" actually is. Imagine you own a house that just went up 12% in value in a month. You don't want to sell it, but you're nervous the gain could evaporate — so you buy an insurance policy that pays you if the value falls below a certain point. That's exactly this trade: someone who likely already owns software exposure paid ≈$9.50 million (about 2.7% of the value being protected) for the right to "sell" IGV at $90 through December, no matter how low it actually falls. If software keeps grinding higher, that $9.50 million is simply the cost of the policy, like a homeowner's premium you never claim on. It is not a bet that the fund crashes tomorrow — it is patience, dressed up as protection.
⚠️ Honest Limits — What the Tape Cannot Prove
- We cannot see the counterparty, the broker, or whether this was a real institution hedging an actual long book versus a standalone speculative bet. Floor blocks are negotiated privately; the tape shows the print, not the intent behind it.
- We cannot confirm there is a broader wave of software hedging demand. No skew, put/call ratio, or sector options-flow data was available — see the callout above.
- We cannot rule out that some of the volume beyond these two blocks (tape showed 52,020 total contracts on this strike today, versus the 34,368 in these two captured clips) reflects other, unrelated activity — that will only sort out once tomorrow's OI print lands.
- This is a single fund-level hedge; it cannot tell us which specific holding(s) the buyer is most worried about — Oracle's debt, the AI-momentum names' multiples, or the seat-based SaaS disruption story could each independently drive a move through $90.
- Options trading involves substantial risk of loss and may not be suitable for all investors. Nothing here is investment advice; verify all figures independently before acting, and size any position — hedge or speculation — to what you can afford to lose.
Last updated: 2026-08-12 (pre-market) — the next-day OPRA open-interest snapshot confirmed the open and revised the size upward. Dec-18 $90P 2,742 → 52,572 (+49,830) against 34,368 captured contracts and 52,020 day volume: OPEN (BTO), ≈15,500 contracts above the published ≈37,000 prediction, meaning ≈97% of the strike's day volume became new open interest. The thesis is unchanged; premium and notional figures in the article are floors, not ceilings. The ⏳ callout was replaced with the ✅ RESOLVED box.