🐋 INDA $1.3M Cheap Bullish Bet on India Into Autumn — Economy Booming, ETF Beaten Down
📅 June 15, 2026 | 🔥 Unusual Activity Detected
✅ Updated 2026-06-16: Next-day OPRA OI confirms a clean open — the Sep $52 call rose 119 → 13,664 (Δ +13,545 ≈ the 13,000 traded). Fresh bullish call position confirmed.
🎯 The Quick Take
Someone just dropped $1.3M on a single call option betting INDA — the iShares MSCI India ETF rallies from ≈$49 to above $52 by September 18. Here's the wild part: India's economy just grew 7.7% in FY26 — one of the fastest in the world — yet INDA is down ≈10% this year. That gap between "booming economy" and "beaten-up ETF" is exactly the disconnect this trade is betting on. The setup into autumn is rich: a landmark US-India trade deal, a massive oil-price catalyst just days away, and Indian corporate earnings re-accelerating. A patient bullish bet with a 3-month runway — let's dig in.
📊 ETF Overview
iShares MSCI India ETF (INDA) is the largest US-listed India equity ETF:
- AUM: ≈$6.59B (as of late May 2026; bled ≈$2.51B over the past year with FII selling)
- Expense Ratio: 0.61%
- What it tracks: The MSCI India Index — large and mid-cap Indian equities across sectors (financials, IT, consumer, energy, materials). Top-10 holdings make up ≈37% of the fund. Names you'd recognize: Reliance Industries, Infosys, HDFC Bank, ICICI Bank, TCS.
- Sector / Asset class: Emerging Markets — India Country Equity ETF
- YTD 2026: Down ≈10.2%; 1-year ≈−10.6% — almost entirely driven by record foreign-investor (FII) selling, NOT a deteriorating economy.
- What they do: INDA gives US investors one-click exposure to the India growth story — the country's GDP, consumption boom, IT exports, and demographic dividend — without having to navigate rupee-denominated accounts directly.
💰 The Option Flow Breakdown
The Tape — June 15, 2026 @ 14:19:12: single-leg auction
| Time | Buy/Sell | Call/Put | Expiration | Premium | Strike | Volume | OI | Size | Spot | Option Price | Option Symbol |
|---|---|---|---|---|---|---|---|---|---|---|---|
| 14:19:12 | BUY | CALL | 2026-09-18 | ≈$1.3M | $52 | 13,000 | 119 | 13,335 | $49.26 | $0.97 | INDA20260918C52 |
Flow type: Single-Leg Auction — this was a facilitated price-improvement auction. A broker worked this large order through an exchange auction process to get the best possible price. This is NOT a lit-book panic sweep and NOT a block cross. It's a deliberate, size-appropriate mechanism for a 13,000+ contract order — the desk chose patience and price efficiency over speed.
✅ RESOLVED — Next-Day OI Confirms a Clean Open (2026-06-16)
| Leg | Pre-print baseline (EOD 2026-06-12) | Resolving (EOD 2026-06-15) | Δ | Verdict |
|---|---|---|---|---|
| Sep-18 $52C | 119 | 13,664 | +13,545 | OPEN — fresh bullish call confirmed |
The next-morning OPRA snapshot confirms a textbook open: open interest rose from 119 to 13,664, a +13,545 gain that matches the 13,000 calls traded. This is a brand-new bullish position betting beaten-down India re-rates — fresh contracts, not a transfer or a close.
🤓 What This Actually Means — Plain English
Let's break this down the way we'd explain it to a friend.
INDA trades at ≈$49.26. The desk bought the right — but not the obligation — to purchase INDA shares at $52 anytime up to September 18, 2026. They paid just $0.97 per share for that right — ≈$1.3M total across 13,335 contracts. That's a cheap call.
The $52 strike is ≈5.5% above current price. So INDA needs to climb ≈5.5% just to reach the strike. For the trade to profit at expiration, it needs to exceed ≈$52.97 (the strike + the $0.97 premium paid). That's the breakeven.
Here's the story this trade is telling: India's economy grew 7.7% in FY26 — with Q4 coming in at a blowout 7.8%. Yet INDA is down 10% this year. Why the gap? Pure flows: foreign investors (FIIs) have pulled out more than ₹2.54 lakh crore (≈$30B+) from Indian equities in 2026 alone — more than they sold in all of 2025. The economy is fine. The stock market has just been starved of foreign buyer demand.
This call is a bet that the flows eventually reverse and the price catches up to the fundamentals. With 3 months to expiry, the desk is patient — they're not looking for a spike this week. They're positioned for Q1 FY27 earnings (which land in July), festive-season demand data, and an easing of the oil/rupee headwind that just got a major catalyst: the US-Iran peace deal is set to sign June 19, four days from now.
Why a cheap OTM call and not stock?
- 🎯 Paid ≈$1.3M instead of ≈$65.6M for equivalent 13,335 × 100 share exposure.
- 🛡️ Defined max loss: the $1.3M premium is ALL they can lose (can't lose more, no matter what).
- 🚀 Leveraged upside: if INDA reaches $55 by September, these calls could be worth 3-4× the purchase price.
- 📅 95 days of runway: enough time for earnings, monsoon progress, FII flows, and RBI to all play out.
Order type: BTO — Buy to Open. A fresh bullish position. Not a hedge, not a roll, not a closing trade.
📈 Technical Setup / Chart Check-Up
YTD Performance
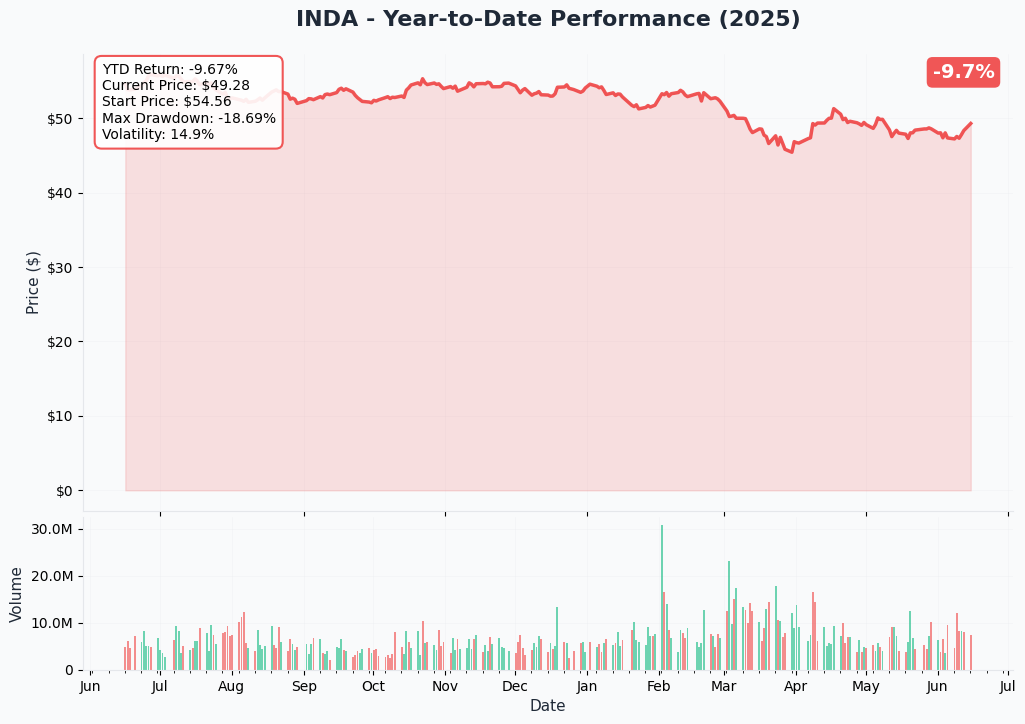
INDA has had a rough 2026 — down ≈10% on the year as record FII selling has overwhelmed domestic buyers. But here's what the chart doesn't show: domestic institutional investors (DIIs) injected ₹82,668 crore in May alone — more than offsetting FII outflows that month. The floor is being defended. The ETF needs a catalyst for FIIs to turn from sellers to buyers, and the pipeline into September is full of them.
Key observations:
- 📉 Down ≈10% YTD on FII outflows, NOT fundamental deterioration
- 🏗️ Domestic investors (DIIs) actively defending the floor, cushioning every dip
- 🎯 Spot at ≈$49.26 puts the ETF ≈5.5% below the $52 strike — achievable in a 95-day window if the narrative shifts
Gamma-Based Support & Resistance
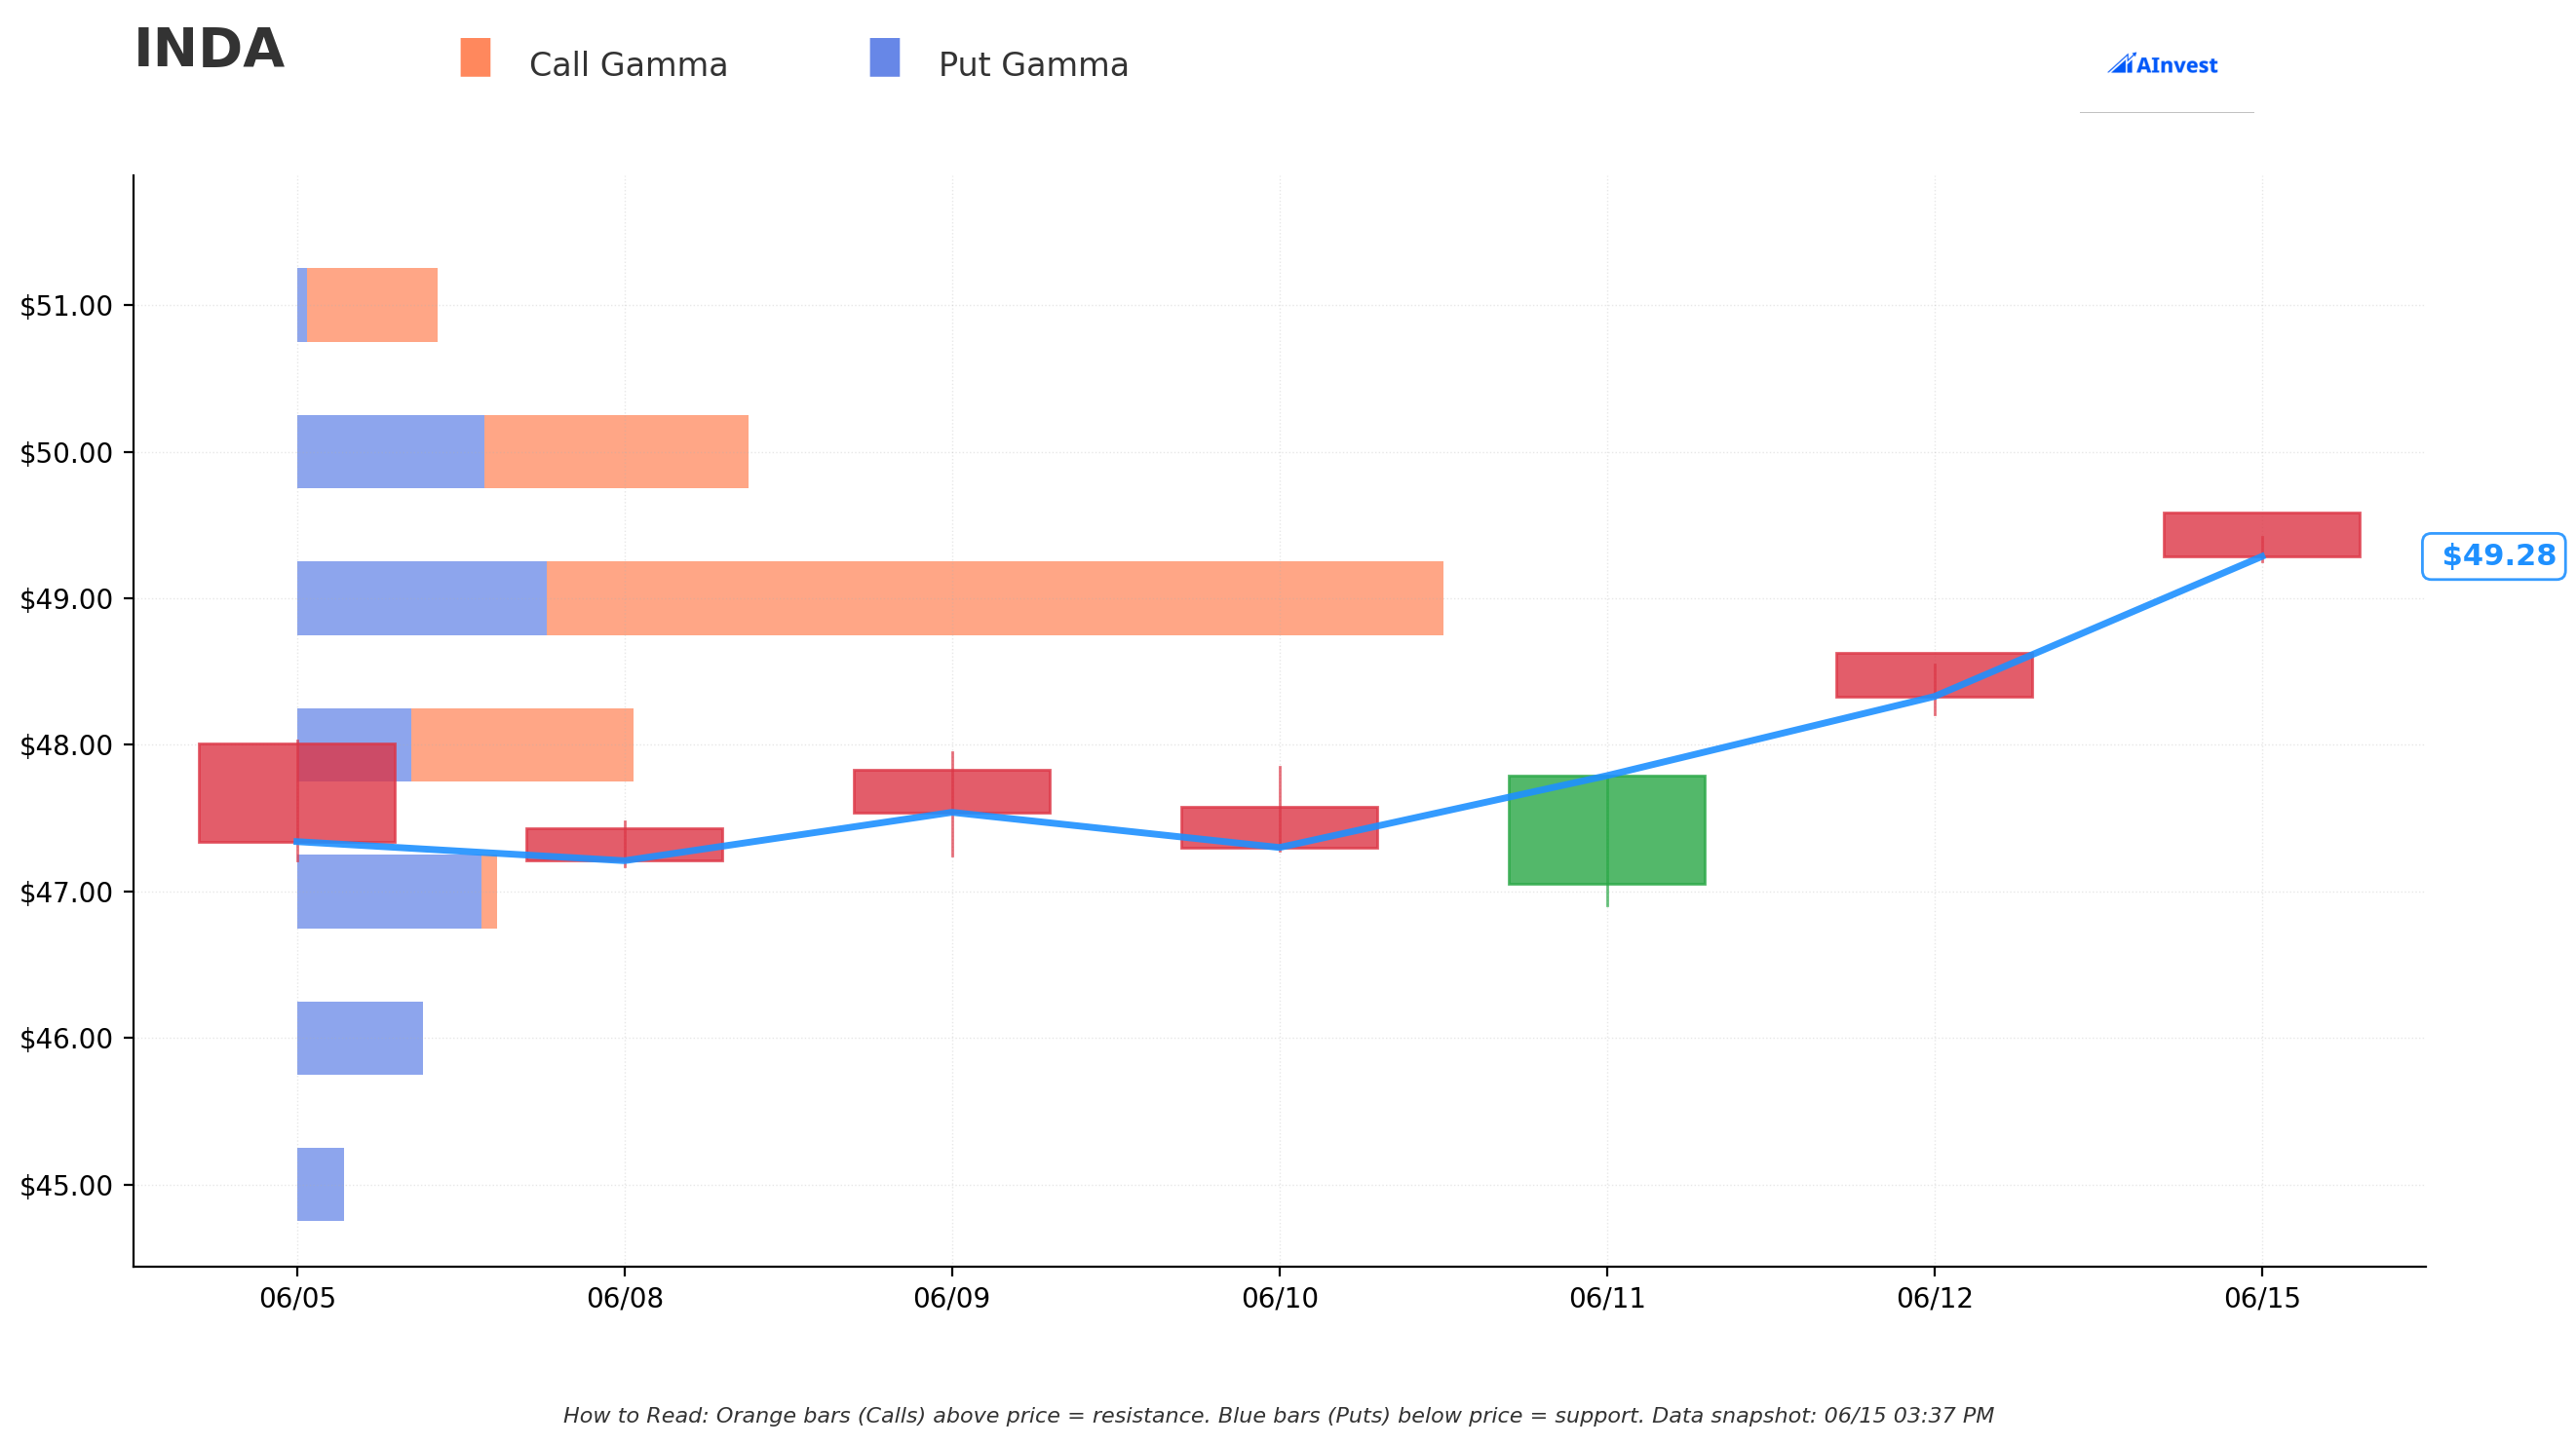
Current Price: ≈$49.26
The gamma map reveals a tightly structured setup right where INDA is trading:
🔵 Support Level (Put Gamma Below Price):
- $49.00 — Very Strong Support. This is the dominant gamma floor from
gex.json: 13.5 total GEX units, the single most powerful level on the board. Market makers are effectively pinned here — they buy dips toward $49 mechanically. This is why INDA has been sticky in the $49 area despite sustained FII selling. If $49 holds, it acts as a launchpad; if it breaks, expect a faster move toward $47–$46.
🟠 Resistance Levels (Call Gamma Above Price):
- $50.00 — Moderate Resistance (5.3 GEX units). The first speed bump above current price. If INDA pushes through $50, it clears a meaningful call gamma wall — that's the first sign momentum is shifting.
- $52.00 — Strong Resistance (7.6 GEX units). This is exactly where the call was struck. The gamma here is substantial — which is no coincidence. A large institutional call buyer at $52 creates options-market gravity at that level. Breaking through $52 with conviction would signal a structural shift in India positioning.
- $54.00 — Next Resistance (5.8 GEX units). If $52 falls, $54 is the next meaningful level above — the quarterly implied move upper cone puts it well within range.
Translation for traders: INDA is pinned in a $49–$52 corridor right now. The $49 gamma floor is keeping the bears at bay; the $52 gamma wall is the ceiling the bull thesis needs to crack. The September expiry gives enough time for the options-market dynamics to cycle and reset before the call needs to pay off.
Implied Move Analysis
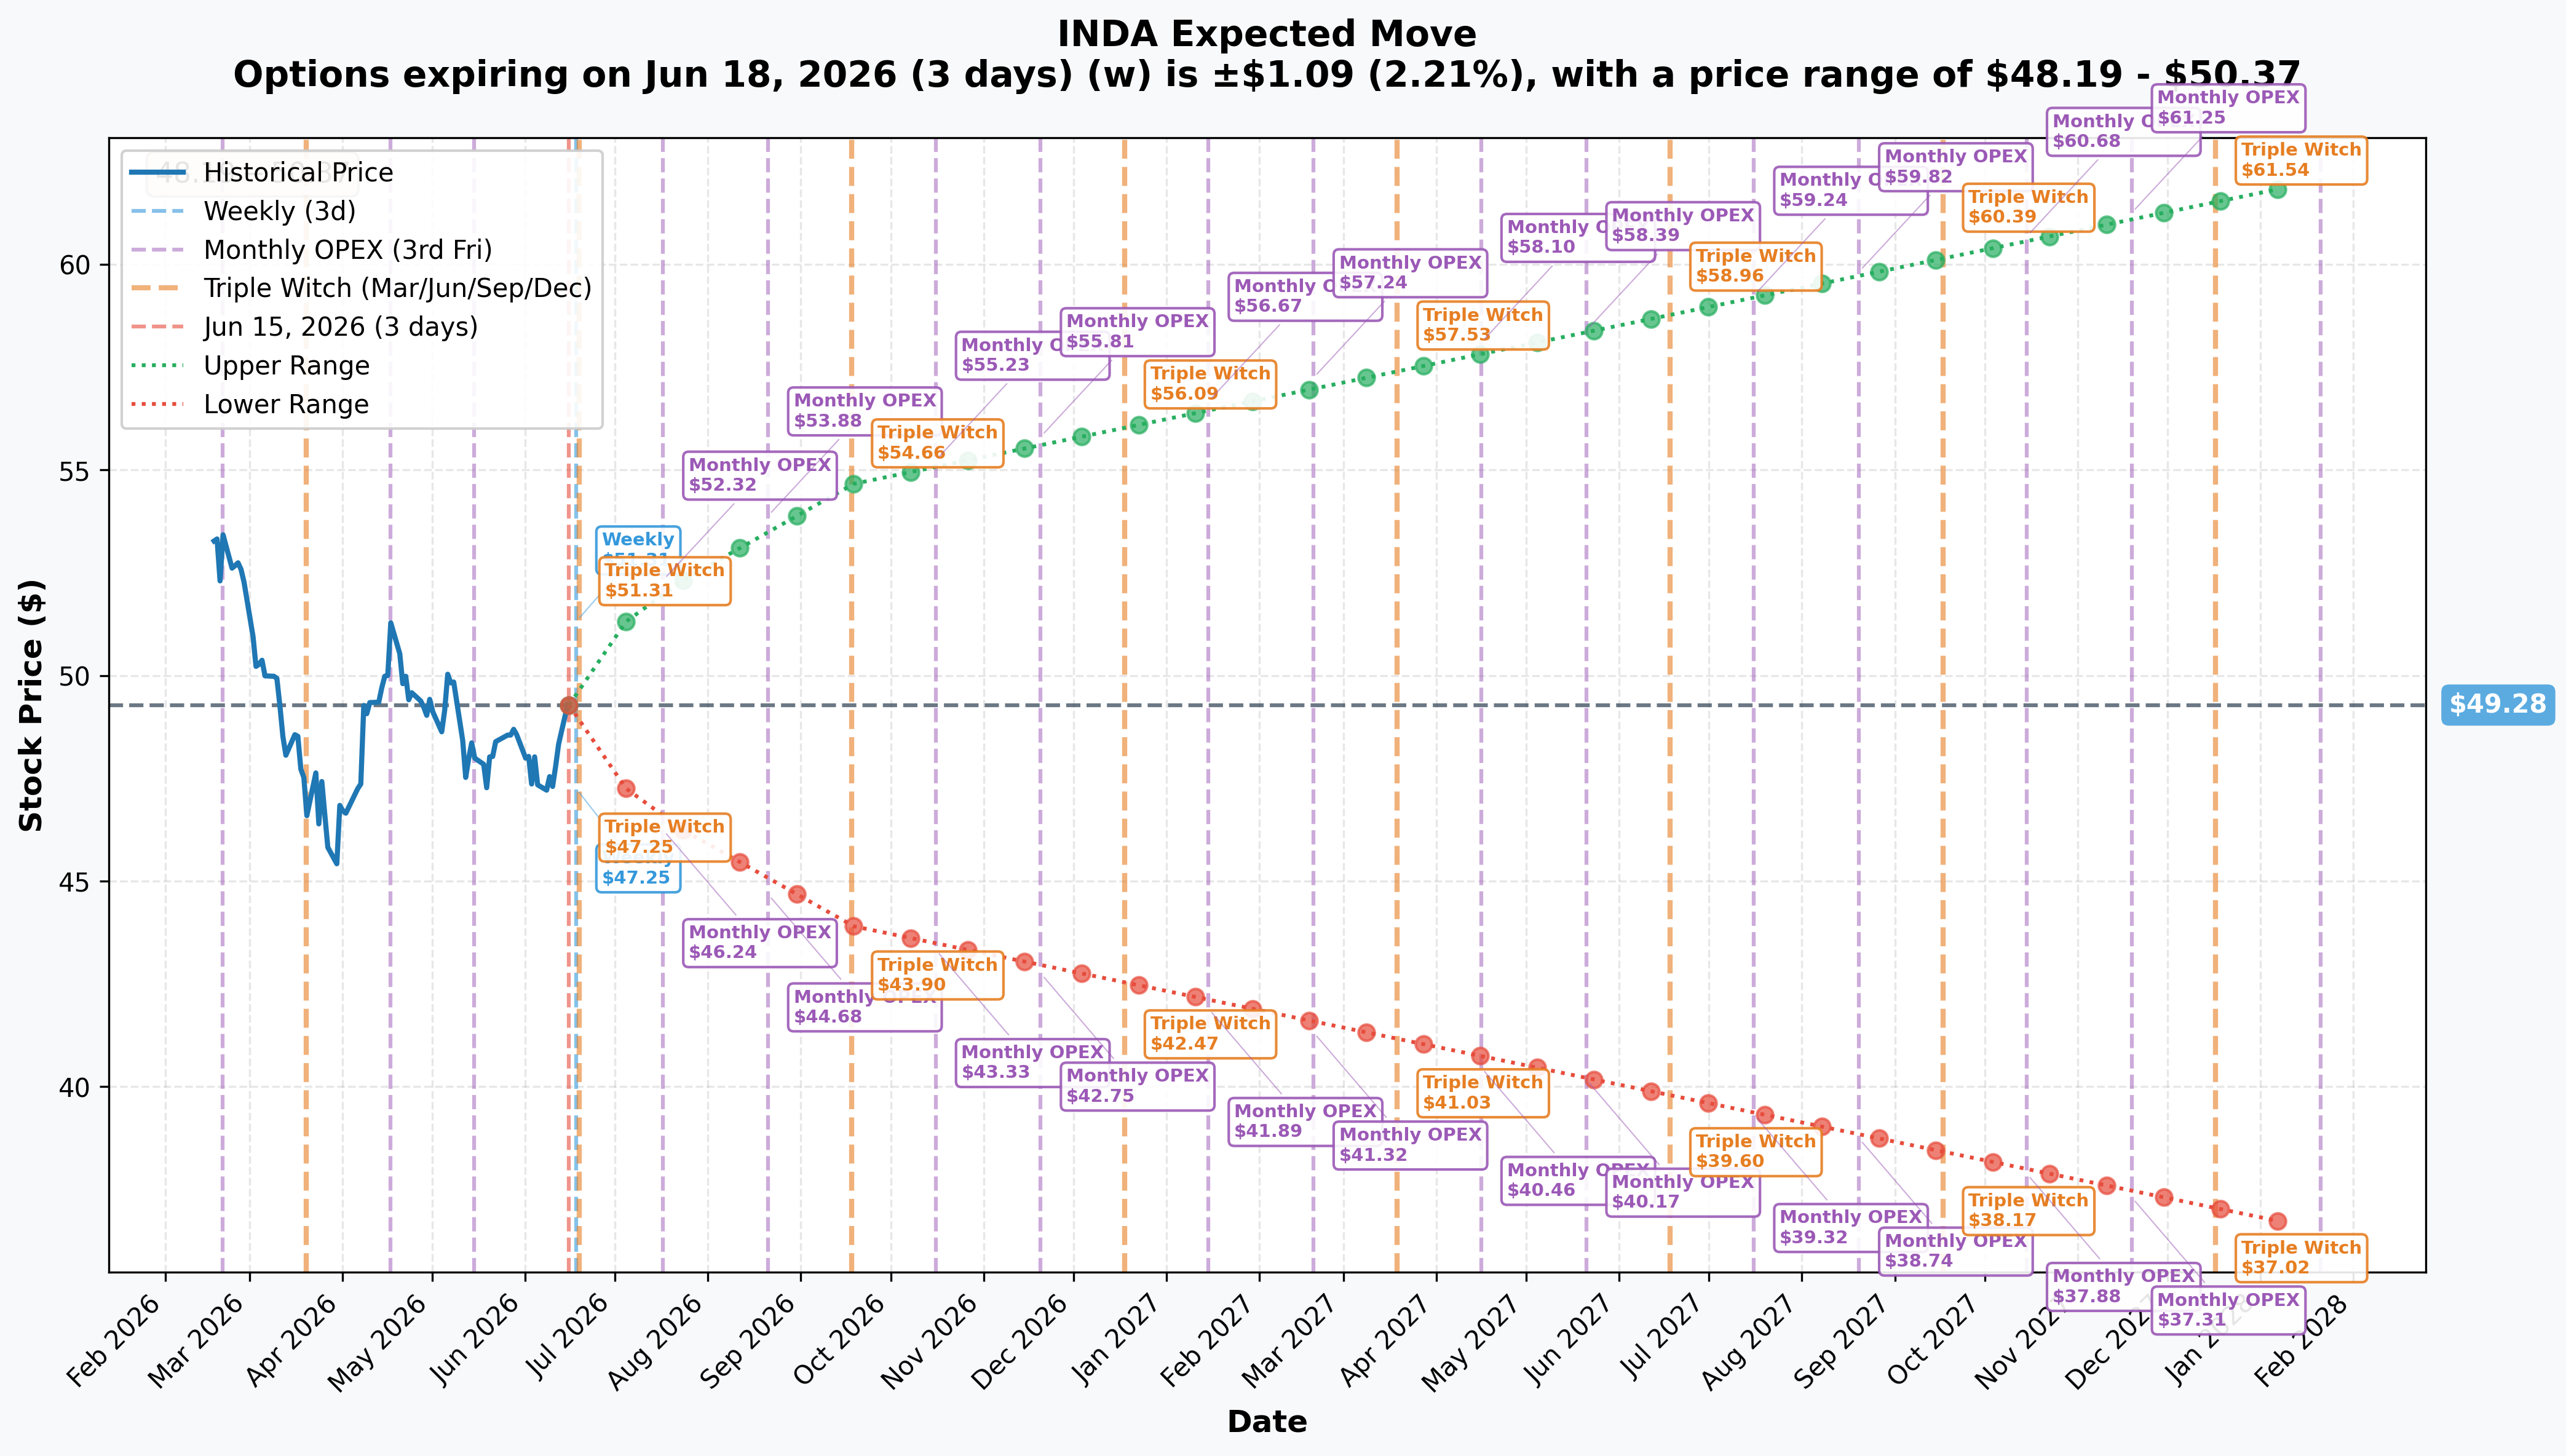
The options market is pricing in meaningful movement in INDA across all time horizons:
- 📅 Weekly (exp 2026-06-18, 3 days): ±2.21% (±$1.09) → Range $48.19 – $50.37
- 📅 Monthly (exp 2026-07-17, 32 days): ±5.66% (±$2.79) → Range $46.49 – $52.07 ← the $52 strike sits right at the upper edge of this cone
- 📅 Quarterly — the expiry (exp 2026-09-18, 95 days): ±10.92% (±$5.38) → Range $43.90 – $54.66 ← the $52 strike is comfortably inside this cone
- 📅 LEAP (exp 2028-01-21, 585 days): ±25.92% (±$12.77) → Range $36.51 – $62.05
This is the key insight: the $52 strike is just at the upper edge of the July monthly cone ($52.07) and sits well inside the quarterly cone ($54.66 upper). The desk isn't buying a far-fetched moonshot — they're buying a strike that the options market itself says is reasonably accessible by September. The call becomes profitable above $52.97, which is within the quarterly implied-move probability range.
The ±10.92% quarterly swing is healthy for an EM ETF. It says the market is pricing real uncertainty — but that real upside is accessible.
🎪 Catalysts
Already Happened — The Foundation
India FY26 GDP: 7.7% Growth — A Positive Surprise Q4 FY26 GDP came in at a blowout 7.8%, pushing full-year FY26 growth to 7.7% — well above most forecasts. Services grew 9.9% in Q4; core GVA 9.7%. India is still one of the fastest-growing major economies on Earth. The World Bank had upgraded FY26 to 6.5% citing GST reform and rural recovery — the actual print blew past that.
US-India Trade Deal — Tariffs 50% → 18% (February 2026) This is a structural tailwind that happened months ago but is still being priced in. On February 2, 2026, the US agreed to cut tariffs on Indian imports from 50% to 18%; a Feb 6 executive order eliminated an additional 25% tariff after India agreed to stop importing Russian oil and expand defense cooperation. The deal also has India cutting/eliminating tariffs on US industrial and agricultural goods. Legal and compliance details via KPMG confirm the scope of the tariff removal. A final binding text is still being negotiated as of mid-June 2026 — conversion to a signed agreement would be a fresh catalyst.
GST 2.0 — Consumption Tailwind Already Flowing Through India's GST 2.0 reform simplified the tax structure to three slabs effective September 22, 2025 and is estimated to add 0.7-0.8% of GDP to household spending power. A Finance Ministry report confirms measurable consumption lift — record festive auto sales, higher e-way bills, strong UPI transaction volumes. The September $52 call lands right as the one-year anniversary of GST 2.0 kicks off festive-season demand data.
RBI Rupee Support Measures (June 5-8, 2026) The RBI just rolled out direct FX-support tools: fully subsidizing FX-hedging costs for banks raising fresh FCNR(B) deposits and removing capital-gains taxes on G-secs for foreign investors. MUFG sees USD/INR moving toward ≈94.00 by the September quarter — a firmer rupee directly boosts INDA's USD-denominated returns.
DIIs Absorbing the FII Selling In May 2026, domestic institutional investors injected ₹82,668 crore, more than covering FII outflows of ₹55,963 crore. The Indian market is not a free-fall; it's a tug-of-war, and local money is winning month-by-month.
Upcoming Catalysts — The Runway Into September OPEX
June 19, 2026 — US-Iran Peace Deal Signing (FOUR DAYS AWAY) 📅 This is the most immediate catalyst. The US-Iran peace deal signs in Switzerland on June 19 — ending the 107-day West Asia conflict that pushed Brent above $100. India imports ≈90% of its crude oil. Lower oil = lower inflation = room for the RBI to ease = stronger rupee = stronger INDA. The rupee already firmed to ≈94.95 intraday on early peace-deal news. This is a direct, near-term de-risking catalyst for INDA holders.
Early-to-Mid July — Q1 FY27 Earnings Season 📅 TCS reports ≈July 10-12; Infosys July 23. These are the two biggest names in INDA. Q1 FY27 is the first read on whether the GST + rate-cut transmission is flowing into corporate profits. Consensus expects Nifty EPS to grow ≈17% in FY27 — strong prints from TCS and Infosys would put a floor under INDA and start bringing foreign buyers back.
Early August — RBI MPC Meeting 📅 The next RBI bi-monthly meeting falls in early August. The June MPC held repo at 5.25% in neutral stance — if the June 19 peace deal brings oil lower and rupee firmer, August could be where a cut finally lands. An RBI cut in August would be a major positive catalyst for rate-sensitive Indian equities and for INDA.
June–September — Monsoon Season Progress India's southwest monsoon plays out through this entire period. Monsoon progress is a running catalyst for rural demand, food inflation, and farmer income — all of which feed into earnings and consumer sentiment by Q2 FY27.
September–October — Festive Season Demand Pickup The September OPEX lands right as India enters its biggest consumer-spending period. GST 2.0 effects, the festive season (Navratri, Dussehra, Diwali build-up), and strong rural incomes from a healthy crop cycle could all show up in high-frequency data by the time the call expires.
FII Flow Reversal — The Big Swing Factor FII outflows in 2026 already exceed all of 2025. The bull thesis is simple: lower US rates (or dollar weakness), improving India-US trade certainty, cheap relative valuations, and earnings acceleration could flip institutional sentiment. Any sign of FIIs returning to Indian equities — the single biggest swing factor — could be a powerful re-rating catalyst into autumn.
🎲 4-Reader Interpretation
🚀 YOLO Trader
This is a cheap lottery ticket on a country ETF — $0.97 per contract, 95 days. If India catches a bid from the peace deal + earnings, these calls could easily 2-3× or more. You're not paying up for them — the IV is modest on a macro ETF. The way to play alongside the desk: buy the same INDA Sep $52C and hold through the June 19 peace deal, July earnings, and August RBI meeting. Your max loss is 100% of the premium (lose the $0.97 per contract) if INDA stays below $52 by September 18. Scale it: if you buy 100 contracts, you're risking ≈$9,700 for meaningful India-rally exposure. Wild ride, but defined risk.
📊 Swing Trader
Watch the levels. $49 is the gamma floor — if it holds through the June 19 oil catalyst, that's your signal the setup is strengthening. $50 is the first gamma wall to clear; a daily close above $50 on volume is a meaningful technical development. The monthly implied move puts the upper range at $52.07 — exactly the strike. A break and hold above $50 would open the next leg. For a swing: INDA itself (the ETF) between $49 and $52, with a stop just below $49 (gamma floor) and a target at $51.50–$52 ahead of the September OPEX. Or play the Aug $50/$53 call spread to limit cost while keeping upside exposure through the Q1 FY27 earnings window.
🛡️ Premium Collector
With INDA pinned between $49 and $52, the gamma structure is your friend. Cash-secured puts at the $49 strike in the near term (June or July expiry) let you collect premium while the gamma floor defends the downside. If INDA stays above $49, you keep the premium. If it drops, you get assigned at $49 — a level that has been technically supported. Avoid selling puts with the June 19 peace-deal binary right ahead — the vol event could spike IV temporarily. Post-June 19, if the catalyst resolves bullishly and volatility drops, premium-selling conditions improve.
🌱 Entry-Level / Beginner
Here's the whole story in plain English: India's economy is growing at 7.7% a year — incredibly fast — but the ETF that tracks Indian stocks is DOWN 10% this year. Why? Foreign hedge funds have been selling Indian stocks and moving money to US and Taiwan tech. The person who bought these options is betting that by September, foreign money will start flowing BACK into India — because: (1) a peace deal that lowers oil prices is signing June 19, (2) Indian company earnings are strong, (3) valuations have become more reasonable after the selloff. They paid $0.97 per share for the right to buy INDA at $52 per share before September 18. If INDA climbs past $52.97, they're in profit. If it doesn't, they lose the $0.97 — that's their maximum possible loss. This is called "buying a call option" and it's one of the most common ways professional investors make leveraged directional bets with a defined, capped downside.
⚠️ Risk Factors
Options trading involves substantial risk. Here are the honest risks for this specific trade:
FII Outflows Haven't Reversed — Yet This is the #1 risk. FII selling in 2026 has already exceeded the entire 2025 total. The bull thesis requires a flow reversal; it hasn't happened yet. If global rotation toward US AI equities continues and India stays low on allocation lists, the ETF may not get the re-rating catalyst it needs within 95 days.
Monsoon Forecast Cut to 90% of Normal — 60% Chance of Deficient The IMD revised India's 2026 monsoon forecast to just 90% of LPA, with a 60% chance of deficient rainfall in core rain-fed regions. A weak monsoon threatens rural demand, raises food inflation, and limits the RBI's ability to cut rates — a triple headwind that could mute the expected earnings recovery.
Inflation Heading Higher Before It Eases The RBI projects CPI rising to ≈5.9% by Q3 FY27. That's close to the top of the tolerance band. If a weak monsoon or any oil-price spike pushes inflation above 6%, the RBI stays on hold longer than hoped — removing the rate-cut tailwind from the bull thesis.
Oil / West Asia Relapse Risk India imports ≈90% of its crude oil. If the June 19 peace deal falters or regional tensions flare up again, Brent back above $100 hits India's current-account deficit, inflation, and the rupee simultaneously — a triple blow that would pressure INDA.
Rupee Is Still Structurally Soft INDA is USD-denominated and unhedged. USD/INR could revisit the 96-98 range in 2026 even in a benign scenario. Every 1% rupee depreciation directly erodes INDA's USD return, independent of what Indian equities do in rupee terms.
Valuations Not Cheap MSCI India trades at ≈23.8× earnings — still the most expensive EM market alongside the US. The premium to broader EM has narrowed slightly but remains above historical averages. Expensive markets need perfect execution on earnings and macro to re-rate. Any earnings miss could re-test the $46-$47 support zone.
What the OPRA Tape CANNOT Tell Us: We know the mechanism (single-leg auction), the size (13,335 contracts), the price ($0.97), and the direction (BUY). We do NOT know the buyer's identity, their existing portfolio, whether these calls are part of a broader hedged structure (e.g., short Indian ADRs elsewhere), or their exit plan. We read the tape; we do not read minds.
🎯 The Bottom Line
Here's the deal: a desk just made a cheap, patient, ≈$1.3M bullish bet on Indian equities with a 95-day runway into September — and they structured it with maximum capital efficiency. At $0.97 per contract on a $49 ETF, this is about as inexpensive a way to bet on an India rebound as options allow.
The thesis is clean: India's economy is growing at 7.7%, corporate earnings are set for a 15-17% FY27 expansion, a landmark trade deal has cut tariffs dramatically, and a major oil/inflation catalyst — the US-Iran peace deal signing June 19 — is days away. INDA is down 10% YTD purely because of foreign-investor selling. The bet is that those flows reverse and the price catches up to the fundamentals before September 18.
The honest risks are real: FII selling hasn't stopped yet, the monsoon forecast is below normal, rupee headwinds are structural, and Indian valuations are still above their historical EM premium. If those headwinds persist, a $0.97 call can absolutely expire at $0.00.
What to watch:
- 📅 June 19, 2026: US-Iran peace deal signing — oil drop + rupee firming = near-term INDA tailwind
- 📅 July 10-12, 2026: TCS Q1 FY27 earnings — first earnings read of the new fiscal year
- 📅 July 23, 2026: Infosys Q1 FY27 results — the IT bellwether; strong numbers here would be a material re-rating signal
- 📅 Early August: Next RBI MPC meeting — any rate cut or dovish pivot is a major INDA catalyst
- 📅 June–September: Monsoon progress reports — bad data here is the main bearish risk
- 📅 September 18, 2026: INDA Sep-2026 $52C expiration
- 📅 Tomorrow ≈06:30 ET: OPRA OI snapshot — confirming this as a new opening position (expected OI rise ≈13,000–13,335 from the prior 119)
If you're bullish on India: The $49 gamma floor is your stop reference. The June 19 peace deal is your first near-term catalyst — if INDA doesn't respond to lower oil prices, that's a warning sign the FII-flow story isn't turning yet. If it does respond, the $50 level (first gamma wall) is your signal that momentum is shifting.
If you're on the sidelines: Wait for post-June 19 price action confirmation. If INDA clears $50 on volume after the peace deal, the path toward $52 opens up through earnings season. Chasing before the catalyst binary resolves is higher risk.
If you're bearish: The $49 gamma floor is your key. Break below $49 with conviction (not just a wick), and the path to $46-$47 opens. A weak monsoon update or FII selling acceleration in July would be your catalyst.
A $1.3M cheap call on one of the world's fastest-growing economies, timed to a wave of macro tailwinds into autumn. The risk is patient — this call can weather a few bad weeks. The question is whether 95 days is enough for India's story to overcome the FII headwind. The desk thinks yes.
Disclaimer: Options trading involves substantial risk of loss and is not suitable for all investors. This analysis is for educational and informational purposes only and does not constitute financial advice. Past unusual options activity does not guarantee future returns. The INDA September 2026 $52 call requires INDA to trade above $52.97 at expiration to be profitable, and can expire completely worthless — resulting in a 100% loss of premium paid. INDA is an ETF with currency exposure; rupee depreciation directly erodes USD-denominated returns. Always conduct your own due diligence and consider consulting a licensed financial advisor before making any trading decisions. Open/close classification is based on size-vs-prior-OI inference and will be confirmed by next-day OPRA open interest data (≈06:30 ET).
Last updated: 2026-06-16 — next-day OPRA OI confirmed a clean open (+13,545).