🛡️ IWM $7M Block Cross — Macro Small-Cap Hedge Through H2-2026
Published: 2026-06-16 · Last updated: 2026-06-17
✅ Updated 2026-06-17: Next-day OPRA OI confirms a clean fresh open — the Jun-2027 $270 put rose 3,388 → 8,393 (Δ +5,005 ≈ the 5,000 traded). The full block is genuinely new long-dated portfolio insurance, not a close.
Quick Take
A desk just negotiated a ≈$7M block of 5,000 Jun-2027 $270 puts on iShares Russell 2000 ETF (IWM) — a confirmed fresh open, bought off-market as a negotiated block cross with a known counterparty. Spot was ≈$296 at print. The $270 strike sits ≈8–9% out-of-the-money and is exactly where IWM round-tripped its entire 2026 gain during the March correction. With the FOMC in session today and tomorrow, CPI reaccelerating to 4.2%, and a ≈$368B small-cap refinancing wall bearing down through year-end, this is a desk buying twelve months of macro portfolio insurance — not a directional punt.
Company Overview
iShares Russell 2000 ETF (IWM) is the most liquid exchange-traded vehicle for U.S. small-cap equities, tracking the Russell 2000 index across ≈2,000 domestic companies. It is the market's purest expression of rate-sensitivity: ≈32% of constituent debt is floating-rate (vs ≈6% for the S&P 500), ≈40–46% of constituents are unprofitable or cannot cover interest expense with operating income, and regional banks — which are heavily weighted in IWM — carry concentrated commercial real estate exposure. As of June 12, 2026, IWM closed at $292.95, up ≈19.2% YTD and within ≈1% of its 52-week high of $295.71, after a volatile round-trip that saw the entire gain nearly erased in March.
Sector: Diversified U.S. Small-Cap Equities
Assets Under Management: ≈$74B (one of the most liquid ETF options markets globally)
The Trade
| Field | Detail |
|---|---|
| Date | 2026-06-16 |
| Time | 10:10:38 ET |
| Underlying | IWM |
| Buy / Sell | BUY |
| Call / Put | PUT |
| Expiration | Jun 17, 2027 |
| Strike | $270.00 |
| Volume | 5,000 contracts |
| Open Interest (prior) | 3,400 contracts |
| Vol / OI | 1.47 |
| Spot at Print | ≈$296 |
| Strike Distance | ≈8–9% OTM |
| Option Price | ≈$14.00 |
| Net Premium | ≈$7,000,000 |
| Order Type | BTO — Buy-to-Open (fresh open, confirmed by size) |
| Flow Type | 🤝 BLOCK CROSS (negotiated, known counterparty) |
| Option Leg | IWM Jun-2027 $270 Put |
Flow tag: 🤝 BLOCK CROSS. This trade was executed off the open book as a negotiated cross between a known buyer and a known seller — a desk routed this through a broker who matched a counterparty before touching the market. This is not an aggressive electronic sweep; it is portfolio insurance, positioned deliberately. The $270 strike represents the level where IWM round-tripped its 2026 rally to near-flat in late March, making it a meaningful structural anchor.
✅ RESOLVED — Next-Day OI Confirms a Clean Open (2026-06-17)
| Leg | Pre-print baseline (EOD 2026-06-15) | Resolving (EOD 2026-06-16) | Δ | Verdict |
|---|---|---|---|---|
| Jun-2027 $270P | 3,388 | 8,393 | +5,005 | OPEN — fresh long-put insurance (BTO) confirmed |
The next-morning OPRA snapshot lands right on the prediction: open interest rose from 3,388 to 8,393, a +5,005 increase that matches the full 5,000-contract block. The entire position is genuinely new long-dated portfolio insurance — none of it was a close of a pre-existing position.
🤓 What This Actually Means — Plain English
This is portfolio insurance, not a bet that IWM crashes tomorrow.
Here is what the desk did: it paid ≈$14 per contract (≈$7M total) to own the right to sell IWM at $270 any time before June 17, 2027. If IWM stays above $270 for the next year, the put expires worthless and the desk loses the $14/contract premium — that is the maximum loss, and it is by design. If IWM falls below $270, the put gains in value and offsets losses on the underlying long small-cap book.
BTO (Buy-to-Open): a desk paid $7M to open a new long-put position. Every dollar spent is capital at risk, and no premium was collected. This is the opposite of an income trade.
Why $270? The $270 strike is ≈8–9% below spot at print and sits at a structurally important level: during the March 2026 correction, IWM fell from ≈$296 to roughly $270–272 as a yield spike and the Iran oil shock erased the full YTD gain in roughly ten sessions. A desk overlaying IWM puts at that exact round-trip level is saying: "if this happens again — and we think the conditions for it are still in place — we want protection through the entire second half of 2026."
Why one year? Short-dated puts would need to be rolled repeatedly, paying the bid-ask and time-premium each time. A Jun-2027 expiry covers the full 2026 macro calendar: six FOMC meetings (including today's), six CPI prints, the Russell reconstitution, the CRE maturity wall, and any potential tariff escalation — in a single, negotiated block. Long-tenor protection is efficient insurance when the risk is structural, not episodic.
Why a negotiated block cross? Printing 5,000 lots electronically would move the market and widen the spread. Doing it as a broker-arranged cross with a known counterparty means both sides agreed on ≈$14 before a single contract hit the tape. There is no urgency signal here — this is deliberate institutional positioning.
The bottom line: a desk with a large long small-cap book decided that ≈$7M of put premium is cheap relative to the macro risks sitting between here and June 2027. That is the IWM trade in plain English.
Technical Setup
IWM Year-to-Date Chart
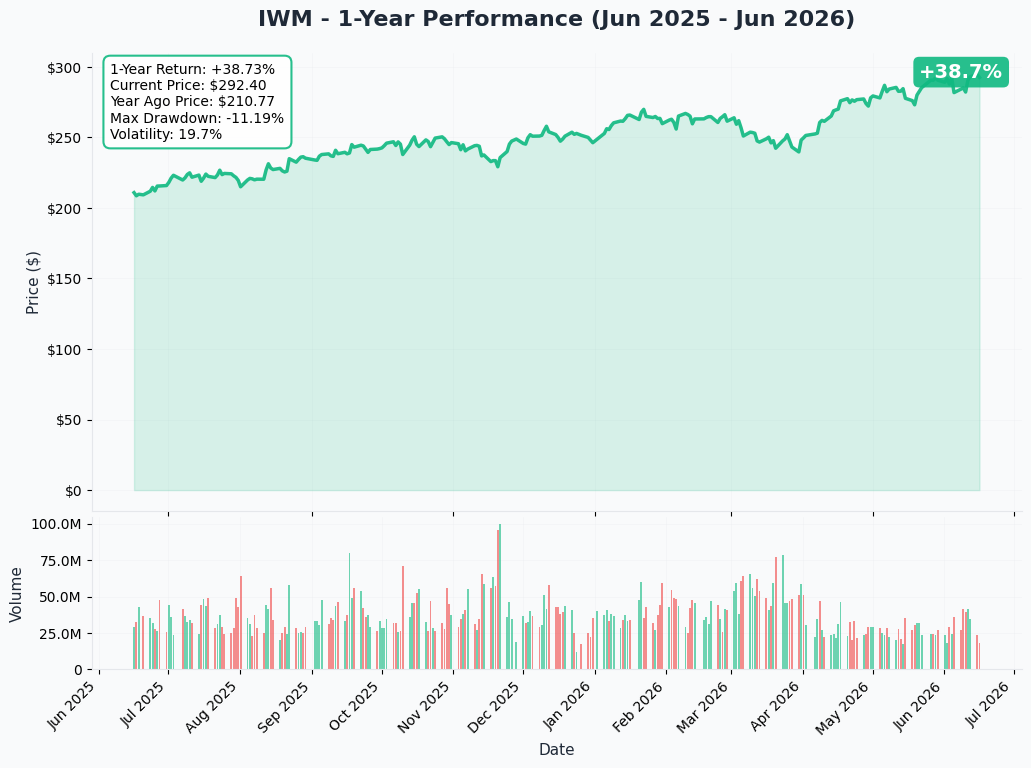
IWM is +19.2% YTD as of June 12, up from flat in late March after a violent round-trip. The chart shows the January–February surge, the near-total give-back to ≈flat by late March, and the V-shaped recovery to fresh records by May. The ETF sits ≈0.9% below its 52-week high of $295.71. Momentum is positive near-term but the structural story is asymmetric: the ETF is priced for the soft-landing best case.
Gamma Support / Resistance
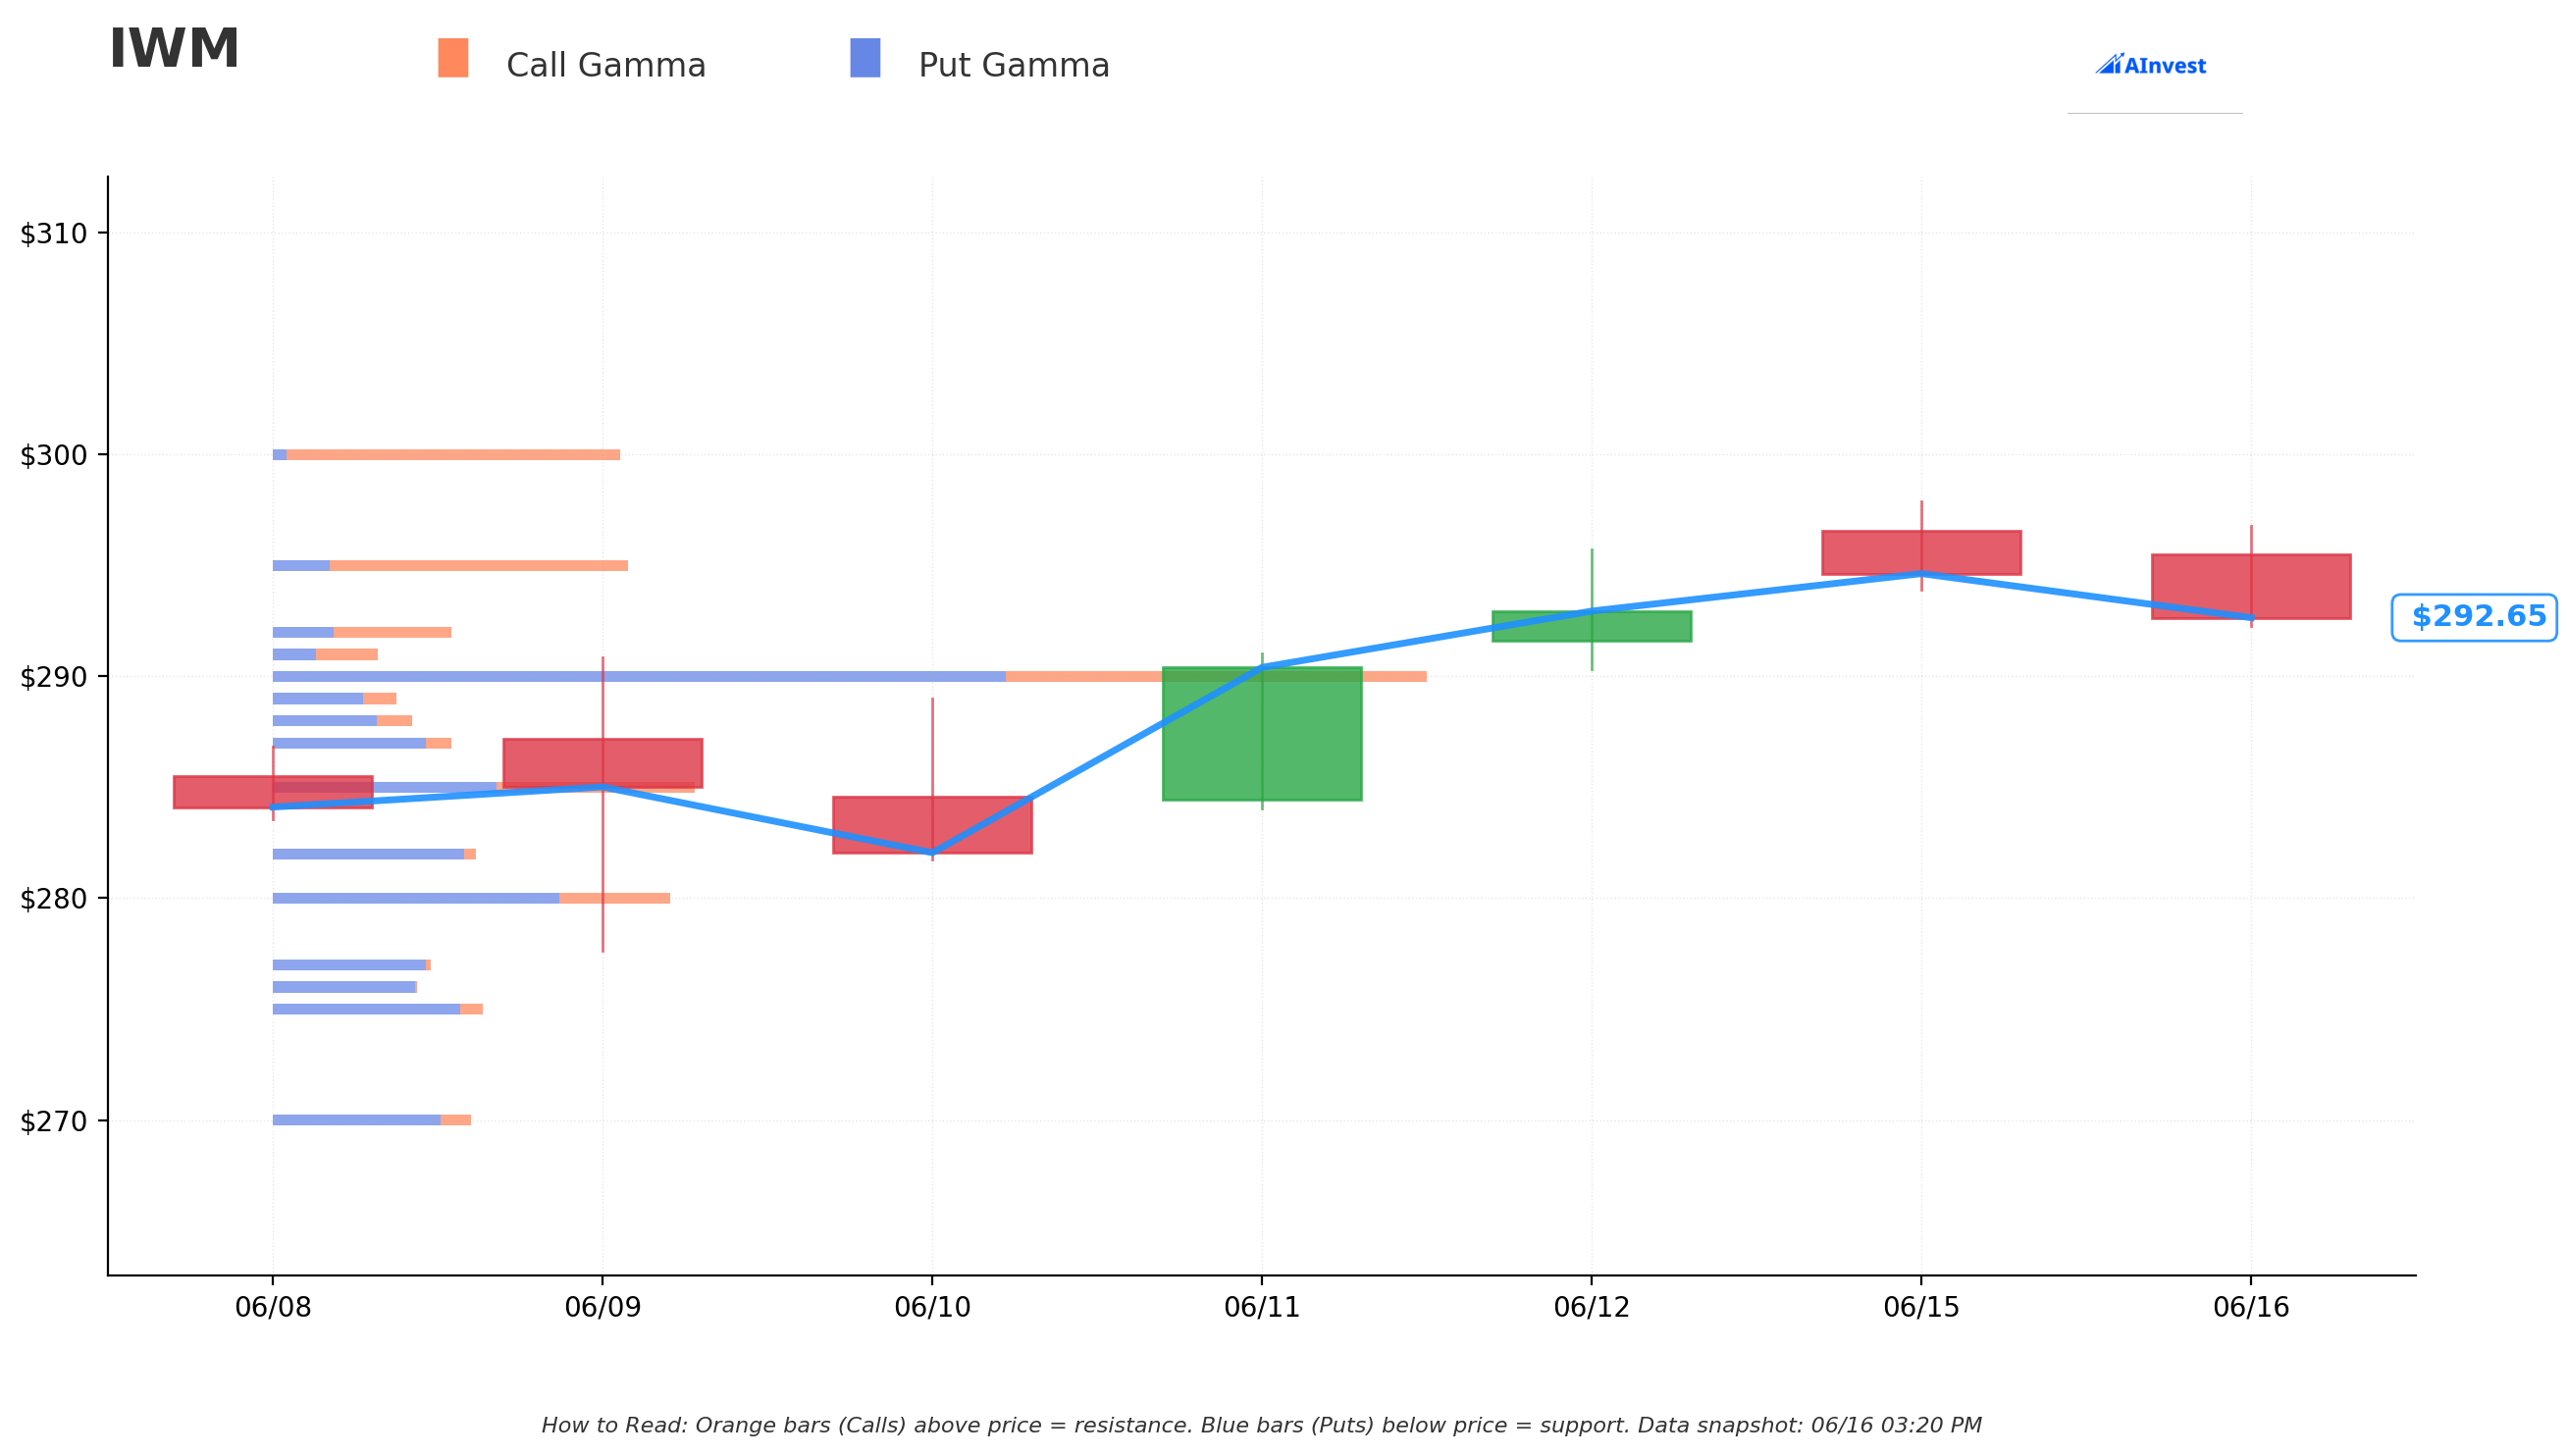
The options market's gamma structure reveals clearly defined levels:
Key Resistance Walls (above spot ≈$292.72):
| Strike | Total GEX | Character | Distance |
|---|---|---|---|
| $293 | 24.5 | Resistance | ≈0.1% above |
| $294 | 16.5 | Resistance | ≈0.4% above |
| $295 | 94.1 — Very Strong | Resistance wall | ≈0.8% above |
| $298 | 23.9 | Resistance | ≈1.8% above |
| $300 | 92.4 — Very Strong | Resistance wall | ≈2.5% above |
| $305 | 20.3 | Resistance | ≈4.2% above |
| $310 | 20.6 | Resistance | ≈5.9% above |
Key Support Walls (below spot):
| Strike | Total GEX | Character | Distance |
|---|---|---|---|
| $292 | 47.3 | Support | ≈0.2% below |
| $291 | 27.7 | Support | ≈0.6% below |
| $290 | 304.1 — Dominant | Support wall | ≈0.9% below |
| $287 | 47.0 | Support | ≈2.0% below |
| $285 | 111.0 — Very Strong | Support wall | ≈2.6% below |
| $282 | 53.2 | Support | ≈3.7% below |
| $280 | 104.8 — Very Strong | Support wall | ≈4.3% below |
| $275 | 55.2 | Support | ≈6.1% below |
| $270 | 52.4 | Support | ≈7.8% below |
The $290 strike is the dominant gamma magnet — at 304 total GEX, it carries more than three times the gamma of the next-largest node, making it a strong gravitational floor. If IWM dips, dealers will buy delta to stay hedged, which mechanically brakes the decline around $290. The $295 and $300 strikes are the dominant resistance nodes; the market maker book will sell into any rally approaching those levels.
Critically, the $270 strike itself carries meaningful put GEX (44.4 put GEX vs only 8.0 call GEX, net −36.5). Today's 5,000-lot block cross has now substantially amplified open interest at this strike. As that OI builds, $270 will increasingly function as a soft floor beneath the current gamma structure — dealers short the puts will hedge by selling IWM on the way down toward $270, which could create a self-reinforcing dynamic if spot ever approaches that level.
Implied Move Cone
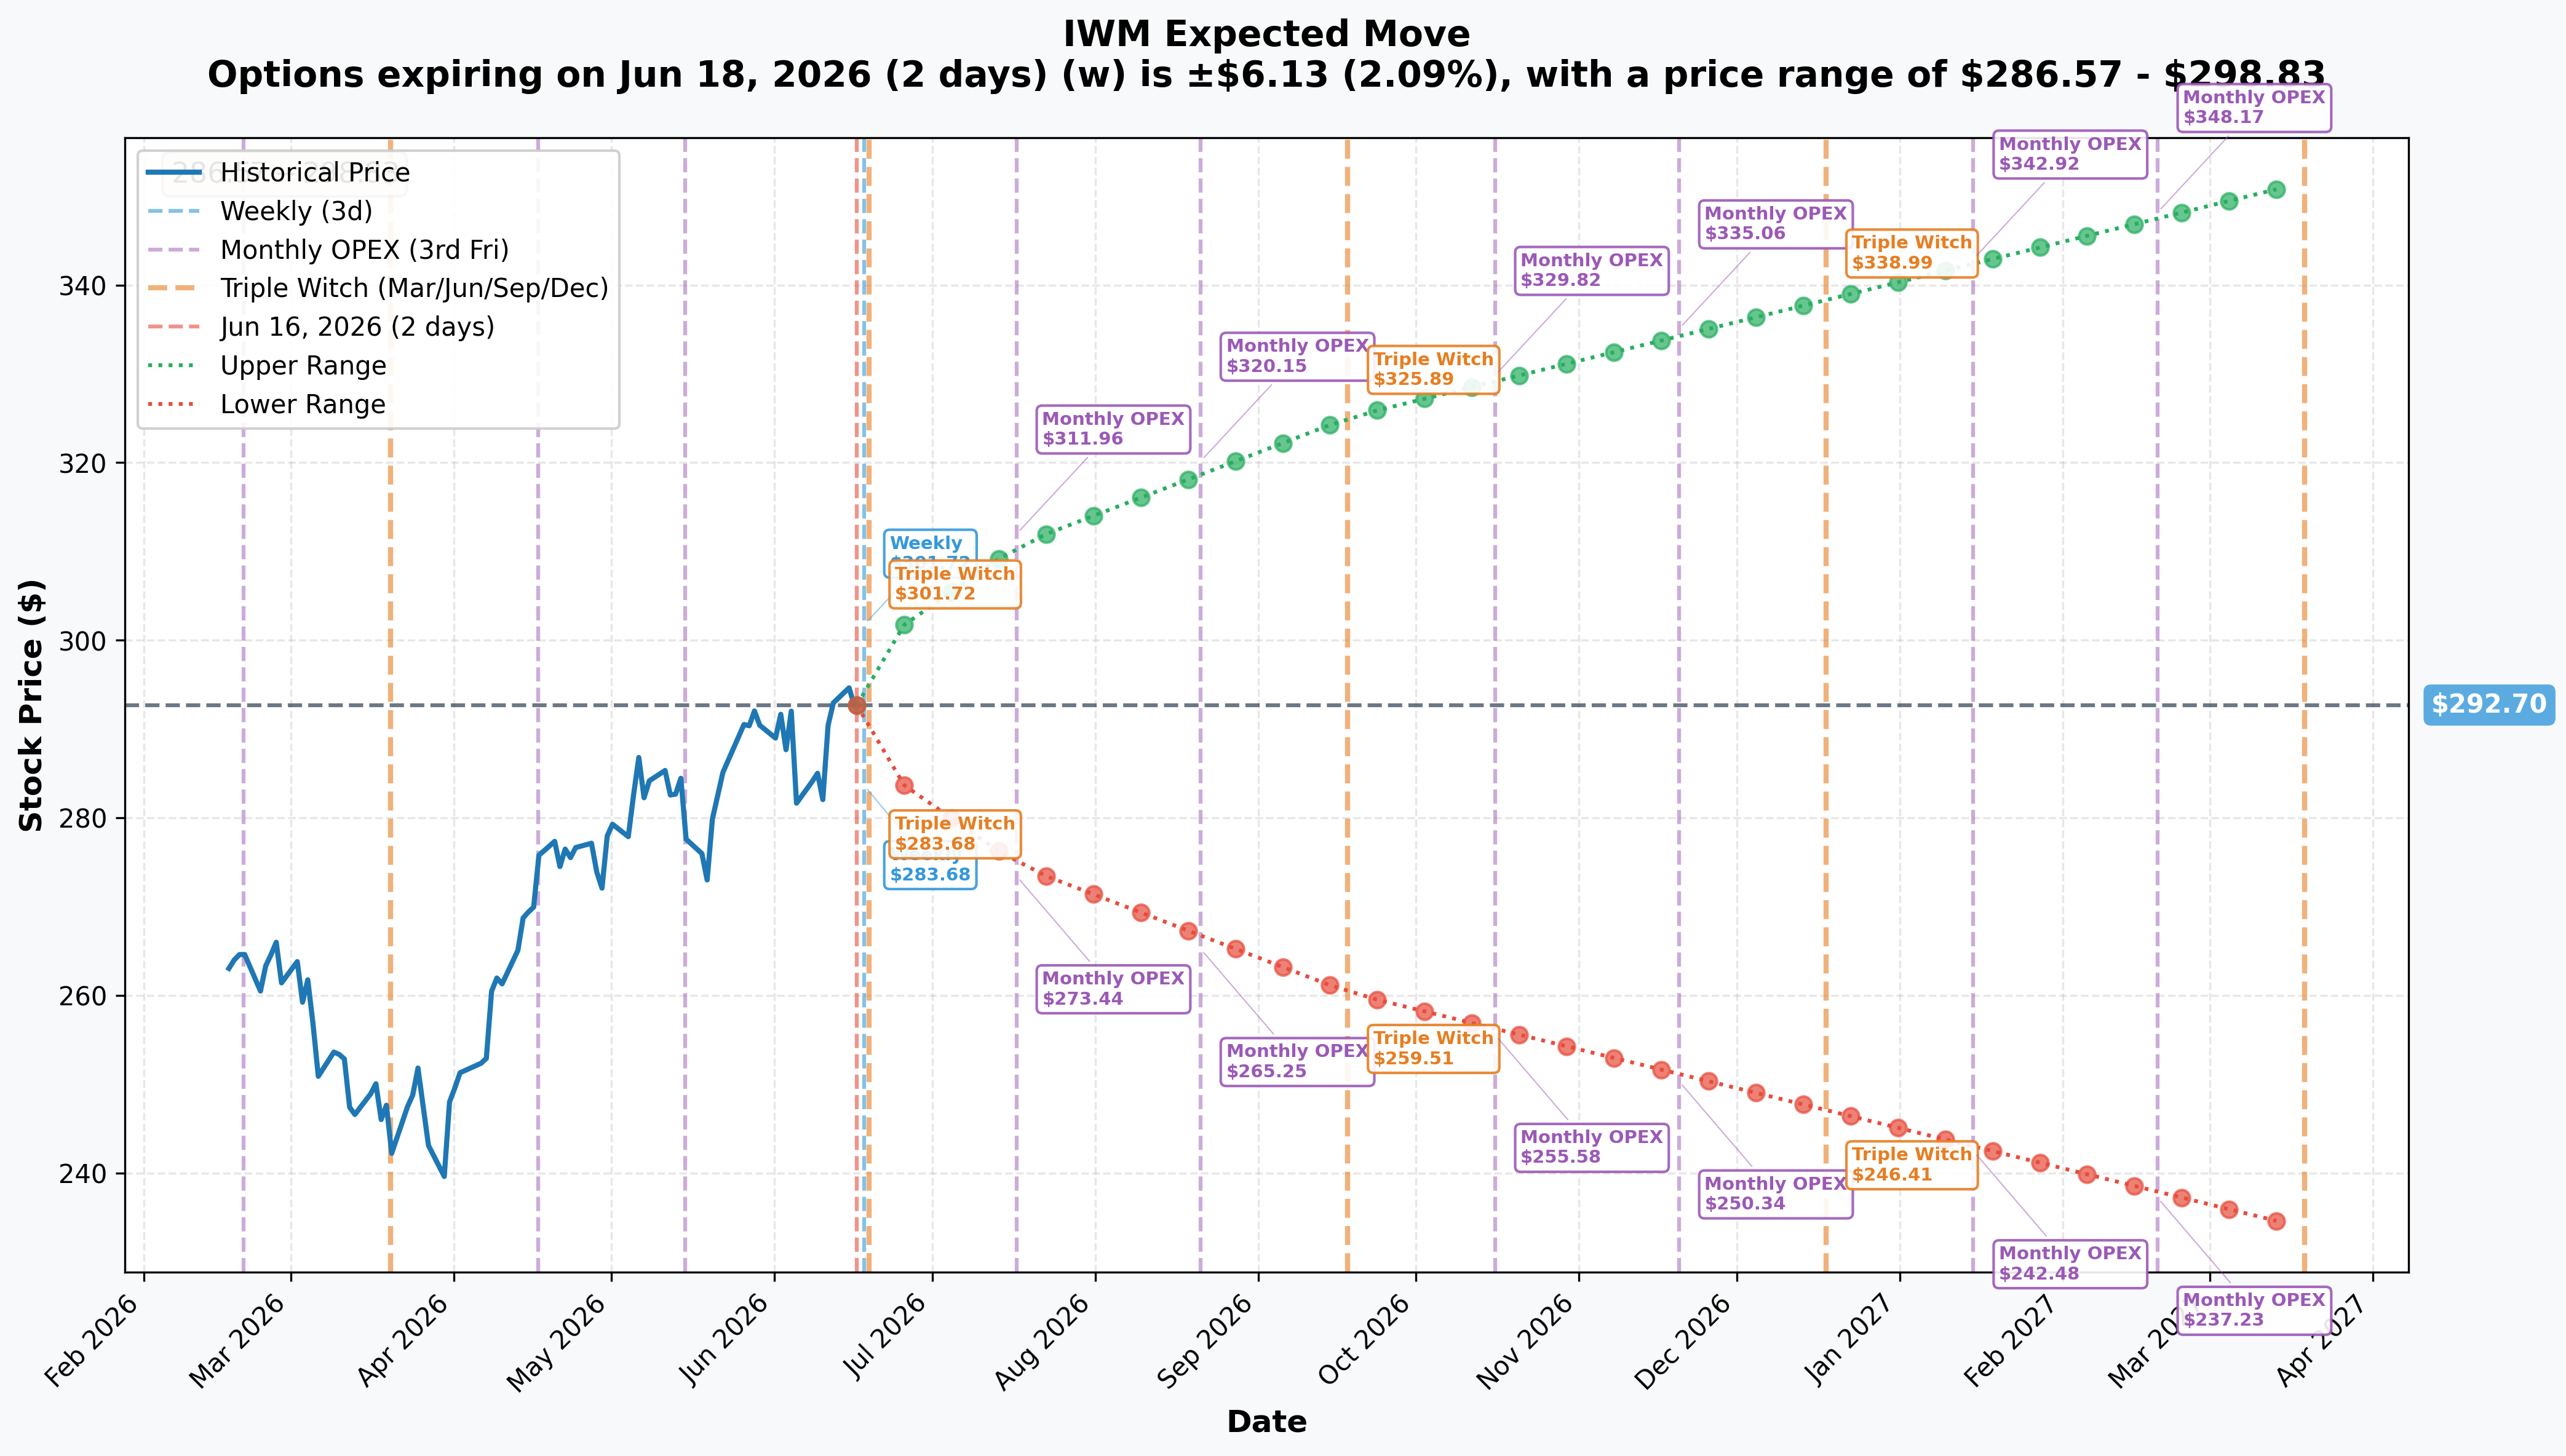
Options-market pricing (based on quote-midpoint implied volatility) implies the following moves from today's spot of ≈$292.70:
| Horizon | Implied Move | Upper Range | Lower Range |
|---|---|---|---|
| Weekly (Jun 18 OPEX — 2 days) | ±2.09% / ±$6.13 | $298.83 | $286.57 |
| Monthly (Jul 17 OPEX — 31 days) | ±6.19% / ±$18.12 | $310.82 | $274.58 |
| Quarterly (Sep 18 — 94 days) | ±11.09% / ±$32.46 | $325.16 | $260.24 |
| Yearly LEAPS (Mar 19, 2027 — 276 days) | ±20.14% / ±$58.96 | $351.66 | $233.74 |
The Jun-2027 $270 put strike sits inside the monthly lower bound ($274.58) at the 31-day horizon, meaning the market already prices a meaningful probability of IWM touching $270 or below sometime in the next month. On a quarterly basis, $260 is the lower bound — the $270 strike sits comfortably within the 1-sigma annual cone. The desk paid ≈$14 for protection well inside the market-implied distribution, which is consistent with buying at-market-implied levels rather than paying a significant premium over fair value.
The FOMC decision this week (Jun 16–17) drives the tight $286.57–$298.83 weekly range — a ±2.09% 2-day window that brackets the immediate policy risk.
Catalysts
Several macro catalysts sit directly between today and the Jun-2027 expiry. Each represents a potential stress point for small caps specifically.
1. FOMC June 16–17 — Chair Warsh's First Meeting
Today and tomorrow mark the first FOMC meeting under Kevin Warsh, sworn in as the 17th Fed Chair on May 22, 2026. Markets price a 98.4% probability of no change, holding the target range at 3.50%–3.75%. The market's attention is on the Summary of Economic Projections (dot plot) and whether the Fed removes its easing bias — a move that would effectively signal no 2026 cuts and remove the marginal tailwind behind the small-cap bull thesis. Press conference is at 2:30pm ET today.
Why it matters for IWM: the entire 2026 small-cap rally was built on the premise that 2024–25 rate cuts would flow into floating-rate interest expense over a 12–18 month lag, lifting reported earnings through mid-2026. If the Fed removes the easing bias and the dot plot shows no further cuts in 2026, the tailwind is fully priced and at risk of reversal.
2. Inflation Reacceleration — CPI at 4.2%
May 2026 CPI rose to 4.2% YoY, the third consecutive monthly acceleration and the highest reading since April 2023. Core CPI climbed to 2.9%, the highest since September 2025. The primary driver is an energy shock from the Iran conflict, with energy up 23.5% YoY. During the March risk-off, Brent pushed toward $120/bbl, raising stagflation concerns that hit IWM hardest of all major indices. A resolution of the Iran situation would relieve oil pressure — but a breakdown in ongoing negotiations could re-arm the trade.
3. The Small-Cap Refinancing Wall
≈$368B of Russell 2000 debt rolls over in 2026 (≈$1.35T across 2026–27), at ≈6.5% vs the 1–2% rates at issuance. With ≈32% of Russell 2000 debt floating-rate vs ≈6% for the S&P 500, every basis point of higher-for-longer directly hits small-cap earnings breadth. ≈40–46% of Russell 2000 constituents are already unprofitable or cannot cover interest expense — that cohort faces an existential refinancing hurdle.
4. CRE Maturity Wall and Regional Bank Stress
≈$936B of commercial real estate debt matures in 2026, up 19% from 2025, with office delinquencies at 6.78% and multifamily at 6.59%. Regional and community banks — which hold ≈31.5% of outstanding commercial mortgages and are significantly weighted in IWM — face loan-loss provisions projected to rise to ≈24% of net revenue in 2026. CRE stress is not a tail risk for IWM — it is embedded in the index composition.
5. High-Yield Spreads — Historically Tight Cushion
High-yield credit spreads sit at historically narrow ≈285bp, leaving little room for error. LPL Research notes "tangible risk of widening ahead". The 10-year Treasury yield at 4.55% on June 5, 2026 has historically been the proximate trigger for IWM corrections — the March drawdown began with a yield spike.
6. Late June — Russell Reconstitution
The 2026 Russell index annual reconstitution reshapes IWM's constituent weights and can drive elevated flow-driven volatility in late June. This is an additional short-term risk event sitting inside the hedge's lifetime.
Scenario Analysis
| Scenario | IWM Path | Put P&L |
|---|---|---|
| Soft landing holds, Iran resolves, Fed cuts Q3/Q4 | IWM stays $285–310 range | Put expires worthless; ≈$7M premium lost (maximum loss) |
| Fed stays hawkish, yields drift higher, HY spreads widen modestly | IWM corrects 8–12% to $260–$272 | Put approaches or exceeds intrinsic value; significant gain |
| Stagflation shock — sticky 4%+ CPI, Brent above $100, credit spreads blow out | IWM reprices to $240–$260 (replaying March but without a rescue cut) | Put deeply in-the-money; substantial gain |
| Mild soft landing drift, no drama | IWM grinds to $295–$305 | Put decays; ≈$3–5M loss by year-end if not much time decay has passed |
Maximum loss is always the ≈$14/contract premium paid — ≈$7M. That is the structural cost of one year of macro insurance on a presumably large IWM long book.
4-Reader Interpretation
🎰 YOLO Trader
5,000 contracts at $270 with a year to expiry. If IWM repeats March and touches $250, this put is worth ≈$30+. That is more than a 2x on the premium paid. But IWM is near all-time highs and trending up — a year is a long time to bleed theta on an OTM put. This is not a quick flip; it is a macro duration trade.
📈 Swing Trader
The gamma structure is clear: $290 is a dominant support floor (≈304 total GEX), and $295 / $300 are stiff resistance caps. The ETF is range-bound in the short term by options market-maker hedging. The FOMC outcome tomorrow (hawkish hold + easing-bias removal) could be the catalyst to push IWM through $290 support into the $285–$287 gamma sub-level. A break below $285 (≈111 GEX support) opens the door to $280 (≈105 GEX). Trade the gamma band — respect $290 as support, scale caution above $295.
💰 Premium Collector
This block cross does not threaten your short-put premium collection above $285 near-term — the gamma support structure pins IWM in a tight range this week (±2.09% implies $286.57–$298.83). The risk for premium sellers is a Fed surprise tomorrow that breaks the $290 support and starts a drift toward $285. Watch the dot plot and Warsh's first press conference closely; a more hawkish tone than the market expects is the trigger.
🔰 Beginner
A large institution paid $7 million to protect itself if IWM falls below $270 before June 2027. Think of it as buying flood insurance on a house worth $296 — the insurance costs $7M, protects against the house price falling below $270, and is bought because the weather (macro environment: inflation, Fed, CRE debt) looks threatening. The institution does not necessarily think IWM will crash — it just thinks the downside risk is real enough to pay for protection. The fact that they bought it as a private negotiated deal (not an open-market panic buy) suggests this is a planned, deliberate portfolio overlay.
Honest Limits — What The Tape Cannot Prove
- Identity and book composition: the OPRA tape does not reveal the institution behind the block, the size of their underlying IWM long book, or whether this put is standalone speculation or explicit overlay hedging. The "hedge" framing is the most structurally consistent interpretation — it is not proven.
- Counterparty direction: in a negotiated cross, a known counterparty sold these 5,000 puts. We do not know if they were closing a long-put position (taking profits on prior protection) or opening a fresh short-put (collecting premium, betting IWM stays above $270). The tape only shows the buy side.
- Pre-existing positions beyond 180 days — RESOLVED. Next-day OPRA OI rose 3,388 → 8,393 (Δ +5,005 ≈ the 5,000 traded), confirming the full block as a genuinely new open. Any pre-lookback position did not materially affect the read — this is fresh insurance.
- Timing precision: the 10:10:38 ET print occurred during the first day of the FOMC meeting. We cannot determine whether the desk positioned before, during, or in response to any particular intraday headline.
Bottom Line
A desk paid ≈$7M to own 5,000 Jun-2027 $270 IWM puts — a confirmed fresh open (size > prior OI), executed as a negotiated block cross with a known counterparty. The trade is structurally a macro hedge: ≈9% OTM, ≈12 months to expiry, struck precisely at the level where IWM round-tripped its 2026 gains in March.
The risk cocktail this put insures against is specific and observable: the Fed removing its easing bias today (Warsh's first FOMC), CPI reaccelerating to 4.2% on an Iran energy shock, ≈$368B of floating-rate small-cap debt rolling over at ≈6.5%, 40–46% zombie constituent share, and a CRE maturity wall that directly pressures IWM's regional bank holdings. Any one of these risk vectors repricing adversely in the next twelve months would make this $7M of premium look cheap.
The gamma structure confirms that $290 is the dominant near-term floor (≈304 total GEX) and $295–$300 is stiff resistance. The weekly implied move is ±2.09% ($286.57–$298.83) — today's FOMC decision is the immediate event risk. The $270 strike now carries meaningful put OEI open interest and will increasingly function as a structural reference level as the position seasons.
This is not a panic trade. It is deliberate, institutional, long-duration portfolio insurance — the options equivalent of buying a year of fire coverage when the macro weather looks unsettled.
Options trading involves substantial risk and is not suitable for all investors. Breakeven, probability, and scenario figures are estimates and do not guarantee any particular outcome. This analysis is for informational purposes only and does not constitute investment advice. Always verify open-interest data the following trading day pre-market (≈06:30 ET) before drawing final conclusions about position open/close status.