🛡️ LLY $15.3M Hedge Restructure — a 2028 Collar, a Near-Term Cap Bought Back, and Almost Zero Net Direction
📅 July 31, 2026 | 🤝 Block Cross Detected
✅ UPDATE — August 3, 2026 pre-market: the OI check is in, and it confirms the hedge read while flipping one leg's label. Both June-2028 collar legs opened at exactly 1,600 contracts each (100.0% of print). The September $1,040 call, which we said was unprovable, resolved as a CLOSE: open interest fell 1,606 → 430 (−1,176). That makes it BTC — buying back a short call, not a new long — which is independent evidence this desk overwrites an existing stock position. The "restructure, not a bet" thesis stands, strengthened. See the 🔄 RESOLVED box.
🎯 The Quick Take
Someone just restructured a hedge on Eli Lilly — not made a bet. A single $15.29M net-debit package printed at 15:47:16 as a stock-plus-options cross: a June 2028 collar (long the $860 put, short the $1,680 call, 1,600 contracts each — a protective band around 160,000 shares) stacked with a September 2026 deep-in-the-money call bought back on top. The math is the story here: net option delta is only +28,026 shares, and a matching 27,000-share stock block printed 79 seconds later. This is a trade about the shape of exposure over the next two-plus years, not a directional wager. It landed right after LLY fell ≈5% in two sessions.
📊 Company Overview
Eli Lilly and Company (LLY) is one of the largest pharmaceutical companies in the world, headquartered in Indianapolis, Indiana, and listed on the NYSE. Lilly's business is built around the incretin franchise — Mounjaro and Zepbound (tirzepatide) for diabetes and obesity — alongside oncology (Verzenio), immunology (Taltz, Omvoh), and Alzheimer's disease (Kisunla). The GLP-1 weight-loss category has been the single biggest growth driver for the stock over the last several years.
- Market cap: ≈$1.03 trillion
- Sector: Health Care / Pharmaceuticals
- Exchange: NYSE
- Current price: $1,148.52
- YTD performance: ≈+6.3% — a strikingly modest gain for a name that carries some of the largest growth expectations in the market
💰 The Option Flow Breakdown
📊 What Just Happened — The Tape
One package, four prints on the options tape, three unique legs. Every leg printed as a stock-plus-options cross — meaning the equity side of the trade is reported on the stock tape, not the options tape. In plain terms: a broker matched the whole package — options and shares together — with a known counterparty off the open book. This is a negotiated block 🤝, not an aggressive sweep.
| Time | Symbol | Buy/Sell | Call/Put | Expiration | Premium | Strike | Volume | OI | Size | Spot | Option Price | Option Symbol |
|---|---|---|---|---|---|---|---|---|---|---|---|---|
| 15:47:16 | LLY | BUY | CALL | 2026-09-18 | $20.29M | $1,040 | 1,500 | 1,606 | 1,500 | $1,148.52 | $135.24 | LLY20260918C1040 |
| 15:47:16 | LLY | BUY | PUT | 2028-06-16 | $14.22M | $860 | 1,600 | 36 | 1,600 | $1,148.52 | $88.89 | LLY20280616P860 |
| 15:47:16 | LLY | SELL | CALL | 2028-06-16 | $9.61M | $1,680 | 1,600 | 0 | 800 | $1,148.52 | $120.11 | LLY20280616C1680 |
| 15:47:16 | LLY | SELL | CALL | 2028-06-16 | $9.61M | $1,680 | 1,600 | 0 | 800 | $1,148.52 | $120.12 | LLY20280616C1680 |
🤝 BLOCK CROSS — all four prints, negotiated, off the lit book. The two 800-lot clips on the $1,680 call are genuine separate prints, not a cancel pair — we checked the tape and found zero cancellations anywhere in this package.
Net premium: $15.29M debit ($20.29M + $14.22M paid, minus $19.22M collected). And there's a fourth piece that never showed up on the options tape at all: 27,000 shares of LLY stock printed at $1,148 at 15:48:35 — 79 seconds after the options package — a near-exact match to the residual delta left over once the collar and the call are netted against each other (more on that below).
🔄 RESOLVED — Two Legs Opened Exactly as Predicted. The Third Was a CLOSE.
The August 3 pre-market OPRA snapshot is in. Both 2028 collar legs hit our predicted numbers to the contract — and the September call, the one we refused to guess on, came back on the close side of the test we named.
| Leg | Baseline OI (Jul 31 snap) | Predicted | Resolving OI (Aug 3 snap) | Δ | Print size | Δ as % of print | Verdict |
|---|---|---|---|---|---|---|---|
| Jun-16-2028 $1,680 Call (sold) | 0 | ≈1,600 | 1,600 | +1,600 | 1,600 | 100.0% | ✅ OPEN (STO) — exact |
| Jun-16-2028 $860 Put (bought) | 36 | ≈1,636 | 1,636 | +1,600 | 1,600 | 100.0% | ✅ OPEN (BTO) — exact |
| Sep-18-2026 $1,040 Call (bought) | 1,606 | ≈2,000–3,106 (if opening) | 430 | −1,176 | 1,500 | ≈−78% | 🔄 CLOSE (BTC) — inverts the label |
The collar is confirmed, precisely. Both June-2028 legs landed on the predicted number exactly — 1,600 contracts each, 100.0% of print size, zero transfer component. The protective band from $860 to $1,680 is brand-new risk, built from nothing.
The September call is the correction, and it makes the story sharper rather than weaker. We wrote: "If OI rises toward ≈2,000–3,106, that confirms an opening. If OI falls, part or all of this was a close." It fell — hard, by 1,176 contracts, wiping out ≈73% of everything that existed at that strike. A buy that destroys open interest is not a new long. It is a BTC — Buy To Close: this desk was short those September $1,040 calls, and they bought them back.
Why that strengthens the hedge read. Our published thesis was that this whole package is a hedge restructuring on an existing stock position — inferred from the near-flat net delta and the matching 27,000-share block, but explicitly not provable. This resolution is independent evidence for it. You do not carry a short deep-in-the-money September $1,040 call — a strike sitting ≈$108 below spot, capping essentially all near-term upside — unless you hold something underneath it. That is the signature of an overwriting program against real shares.
Read in that light, the package is a single coherent maneuver: buy back a near-dated cap that had gone deep in the money, and replace it with a much higher, much longer-dated one. The desk lifted a ceiling sitting ≈9% below the stock and re-set it at $1,680 — ≈46% above the stock — in June 2028, while adding an $860 floor underneath. The "restructure, not a bet" framing in the title and throughout this article stands, now on confirmed footing.
Honest nuance on the close. Open interest fell 1,176 against a 1,500-lot print, so ≈78% of the buy genuinely retired contracts while the remaining ≈324 changed owners. The desk's September short is gone either way.
One caveat we flagged and should now retire. The risk section below warned this leg "may never fully resolve to conviction." It resolved cleanly — the direction of the open-interest move is unambiguous. What remains unknowable is the same thing that was always unknowable: whether the shares being overwritten actually exist on this desk's book, which no tape can show.
🤓 What This Actually Means — Plain English
Step 1: The 2028 collar is a fence around the stock. Someone bought 1,600 June-2028 $860 puts and sold 1,600 June-2028 $1,680 calls — same size, same expiration, on what functions as a 160,000-share position. A collar like this puts a floor and a ceiling on the value of that stock for the next ≈23 months:
| LLY price at 2028 expiry | What the collared position is worth (per share) |
|---|---|
| $800 | $860 — the put pays, floor holds regardless of how far the stock falls |
| $860 | $860 — right at the floor |
| $1,148 (today's spot) | $1,148 — inside the band, just tracks the stock |
| $1,400 | $1,400 — still inside the band, no cap yet |
| $1,680 | $1,680 — right at the ceiling |
| $1,900 | $1,680 — capped; $220/share of upside is given away |
Below $860 (≈25% below today's spot), the long put protects the downside dollar-for-dollar. Above $1,680 (≈46% above spot), the short call gives away every dollar of further gain. In between, the position just rides the stock. This collar was actually put on for a net credit of ≈$31.23 per share ($4.996M total) — the $1,680 call premium collected ($120.115 average) more than paid for the $860 put ($88.89). That's a textbook detail for anyone who's ever sold covered calls to finance protection: the ceiling paid for the floor, with money left over.
Step 2: The September call buys back a near-term cap — literally. ✅ Confirmed August 3. A collar that runs to 2028 gives away upside above $1,680 for the entire ≈23-month life of the trade. But whoever built this also bought 1,500 September 18, 2026 $1,040 calls — deep in the money (intrinsic value $108.52, so only ≈$26.72 of the $135.24 price is time premium) — for $20.29M. Next-day open interest proved this was a buy-to-close: they were short those calls and repurchased them. That is the difference between "adding a new bullish position" and "removing a ceiling," and it is the more coherent story by far. A short $1,040 call with the stock at $1,148 caps essentially all near-term upside on whatever it is written against; buying it back restores full participation for the next seven weeks. Think of it as: "lift the cap that's already ≈9% below the stock, and re-set the cap at $1,680 out in 2028 instead."
Step 3: The whole package is nearly flat. Run the delta math and the two pieces almost cancel:
- Collar delta: ≈−89,424 shares (long put + short call, both net negative)
- September call delta: ≈+117,450 shares
- Net: +28,026 shares — a small residual, not a real directional position
And 79 seconds after the options printed, 27,000 shares of LLY traded at $1,148 — almost exactly matching that residual. That is strong evidence the whole thing, options plus stock, was assembled to land close to delta-neutral.
Order types, in plain English — all three now confirmed by next-day open interest:
- BUY the Sep $1,040 call = 🔄 BTC — Bought To Close (OI 1,606 → 430). Originally published as "BTO if opening." They were short this call and bought it back, lifting a near-term ceiling.
- BUY the Jun-2028 $860 put = ✅ BTO, confirmed fresh open, 100.0% of print (OI 36 → 1,636). The floor of the collar.
- SELL the Jun-2028 $1,680 call (both clips) = ✅ STO, confirmed fresh open, 100.0% of print (OI 0 → 1,600). The financed ceiling of the collar.
What this is most consistent with — and what it isn't proof of: This pattern — a long-dated collar plus a near-dated call bought back on top, landing net-flat — is a classic hedge restructuring on a large existing stock position. You only give up upside on a call you're short if you're using it to finance protection on shares you already hold; an outright speculator has no reason to sell calls at the same moment they're buying protection unless they're managing an existing book. This was INFERRED at publication — and the August 3 OI check has since raised its confidence materially. Confirming the September call as a buy-to-close means the desk was carrying a short deep-ITM call, which is the classic signature of overwriting an existing holding; you do not sell a $1,040 call against nothing when the stock is $1,148. It still is not proof: the options tape cannot show us a brokerage statement, cannot show us whether this trader owns Lilly shares, and cannot prove motive. What is proven is the structure, the sizes, the prior open interest, the near-zero net option delta, and the 27,000-share stock print that lines up with the residual. Whether the "book" being hedged is 160,000 shares of LLY, a larger position hedged only partially here, or something else entirely, we simply cannot see from the tape.
📈 Technical Setup / Chart Check-Up
YTD Performance
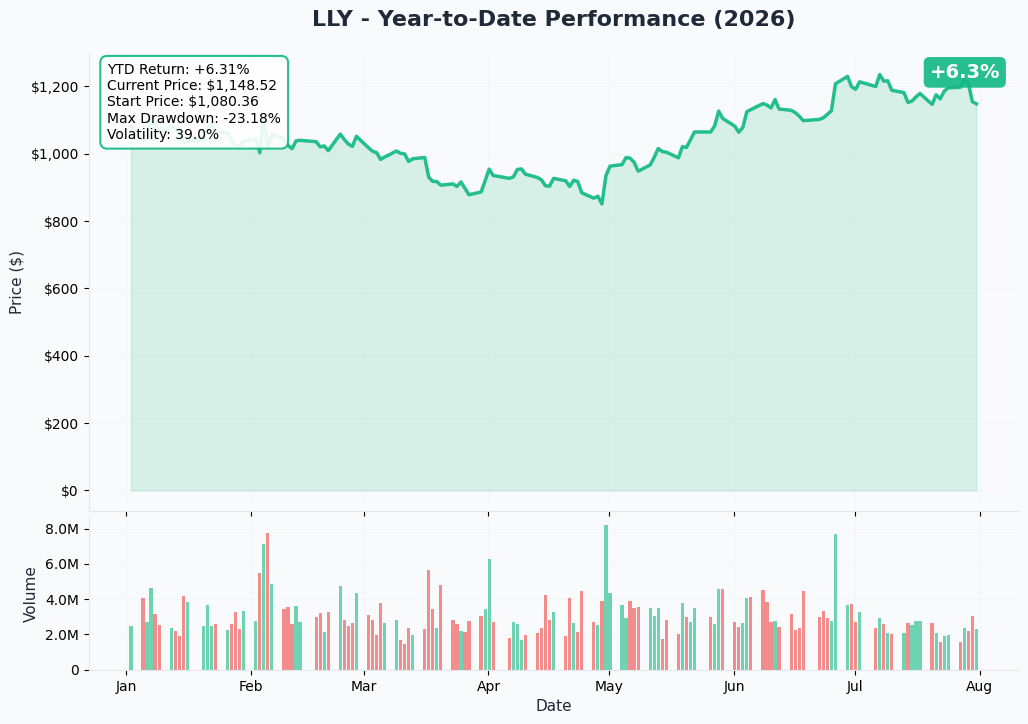
LLY is up only ≈+6.3% year-to-date at $1,148.52 — a modest gain relative to how much of the market's GLP-1/obesity-drug enthusiasm is priced into this name. The stock has been under pressure into the print: it closed at $1,210.02 on July 29, fell to $1,154.97 on July 30, and sits at $1,148.52 on July 31 — roughly a 5% decline across two sessions.
Important correction to the obvious assumption: this was NOT an earnings-driven drop. Lilly has not yet reported Q2 2026 results — that print is scheduled for August 5, 2026 (see Catalysts below). Instead, two separate things drove the two-day slide: valuation jitters flagged by Reuters Breakingviews on July 30 (the same day Morningstar's model moved LLY to a 2-star, "overvalued" rating), followed by a sector-wide GLP-1 scare on July 31 when Novo Nordisk's heart-drug candidate ziltivekimab failed a Phase 3 trial and wiped out more than $30 billion of Novo's market cap — dragging the whole obesity-drug trade, Lilly included, down with it even though Lilly itself had no company-specific news that day.
That distinction matters for reading this trade: putting on a long-dated protective floor and buying back near-term upside right after a sentiment-driven, sector-wide slide (rather than a company-specific earnings miss) is a natural sequence for someone managing risk on an existing position ahead of a real binary event — Q2 earnings — that hasn't happened yet.
Gamma-Based Support & Resistance Analysis
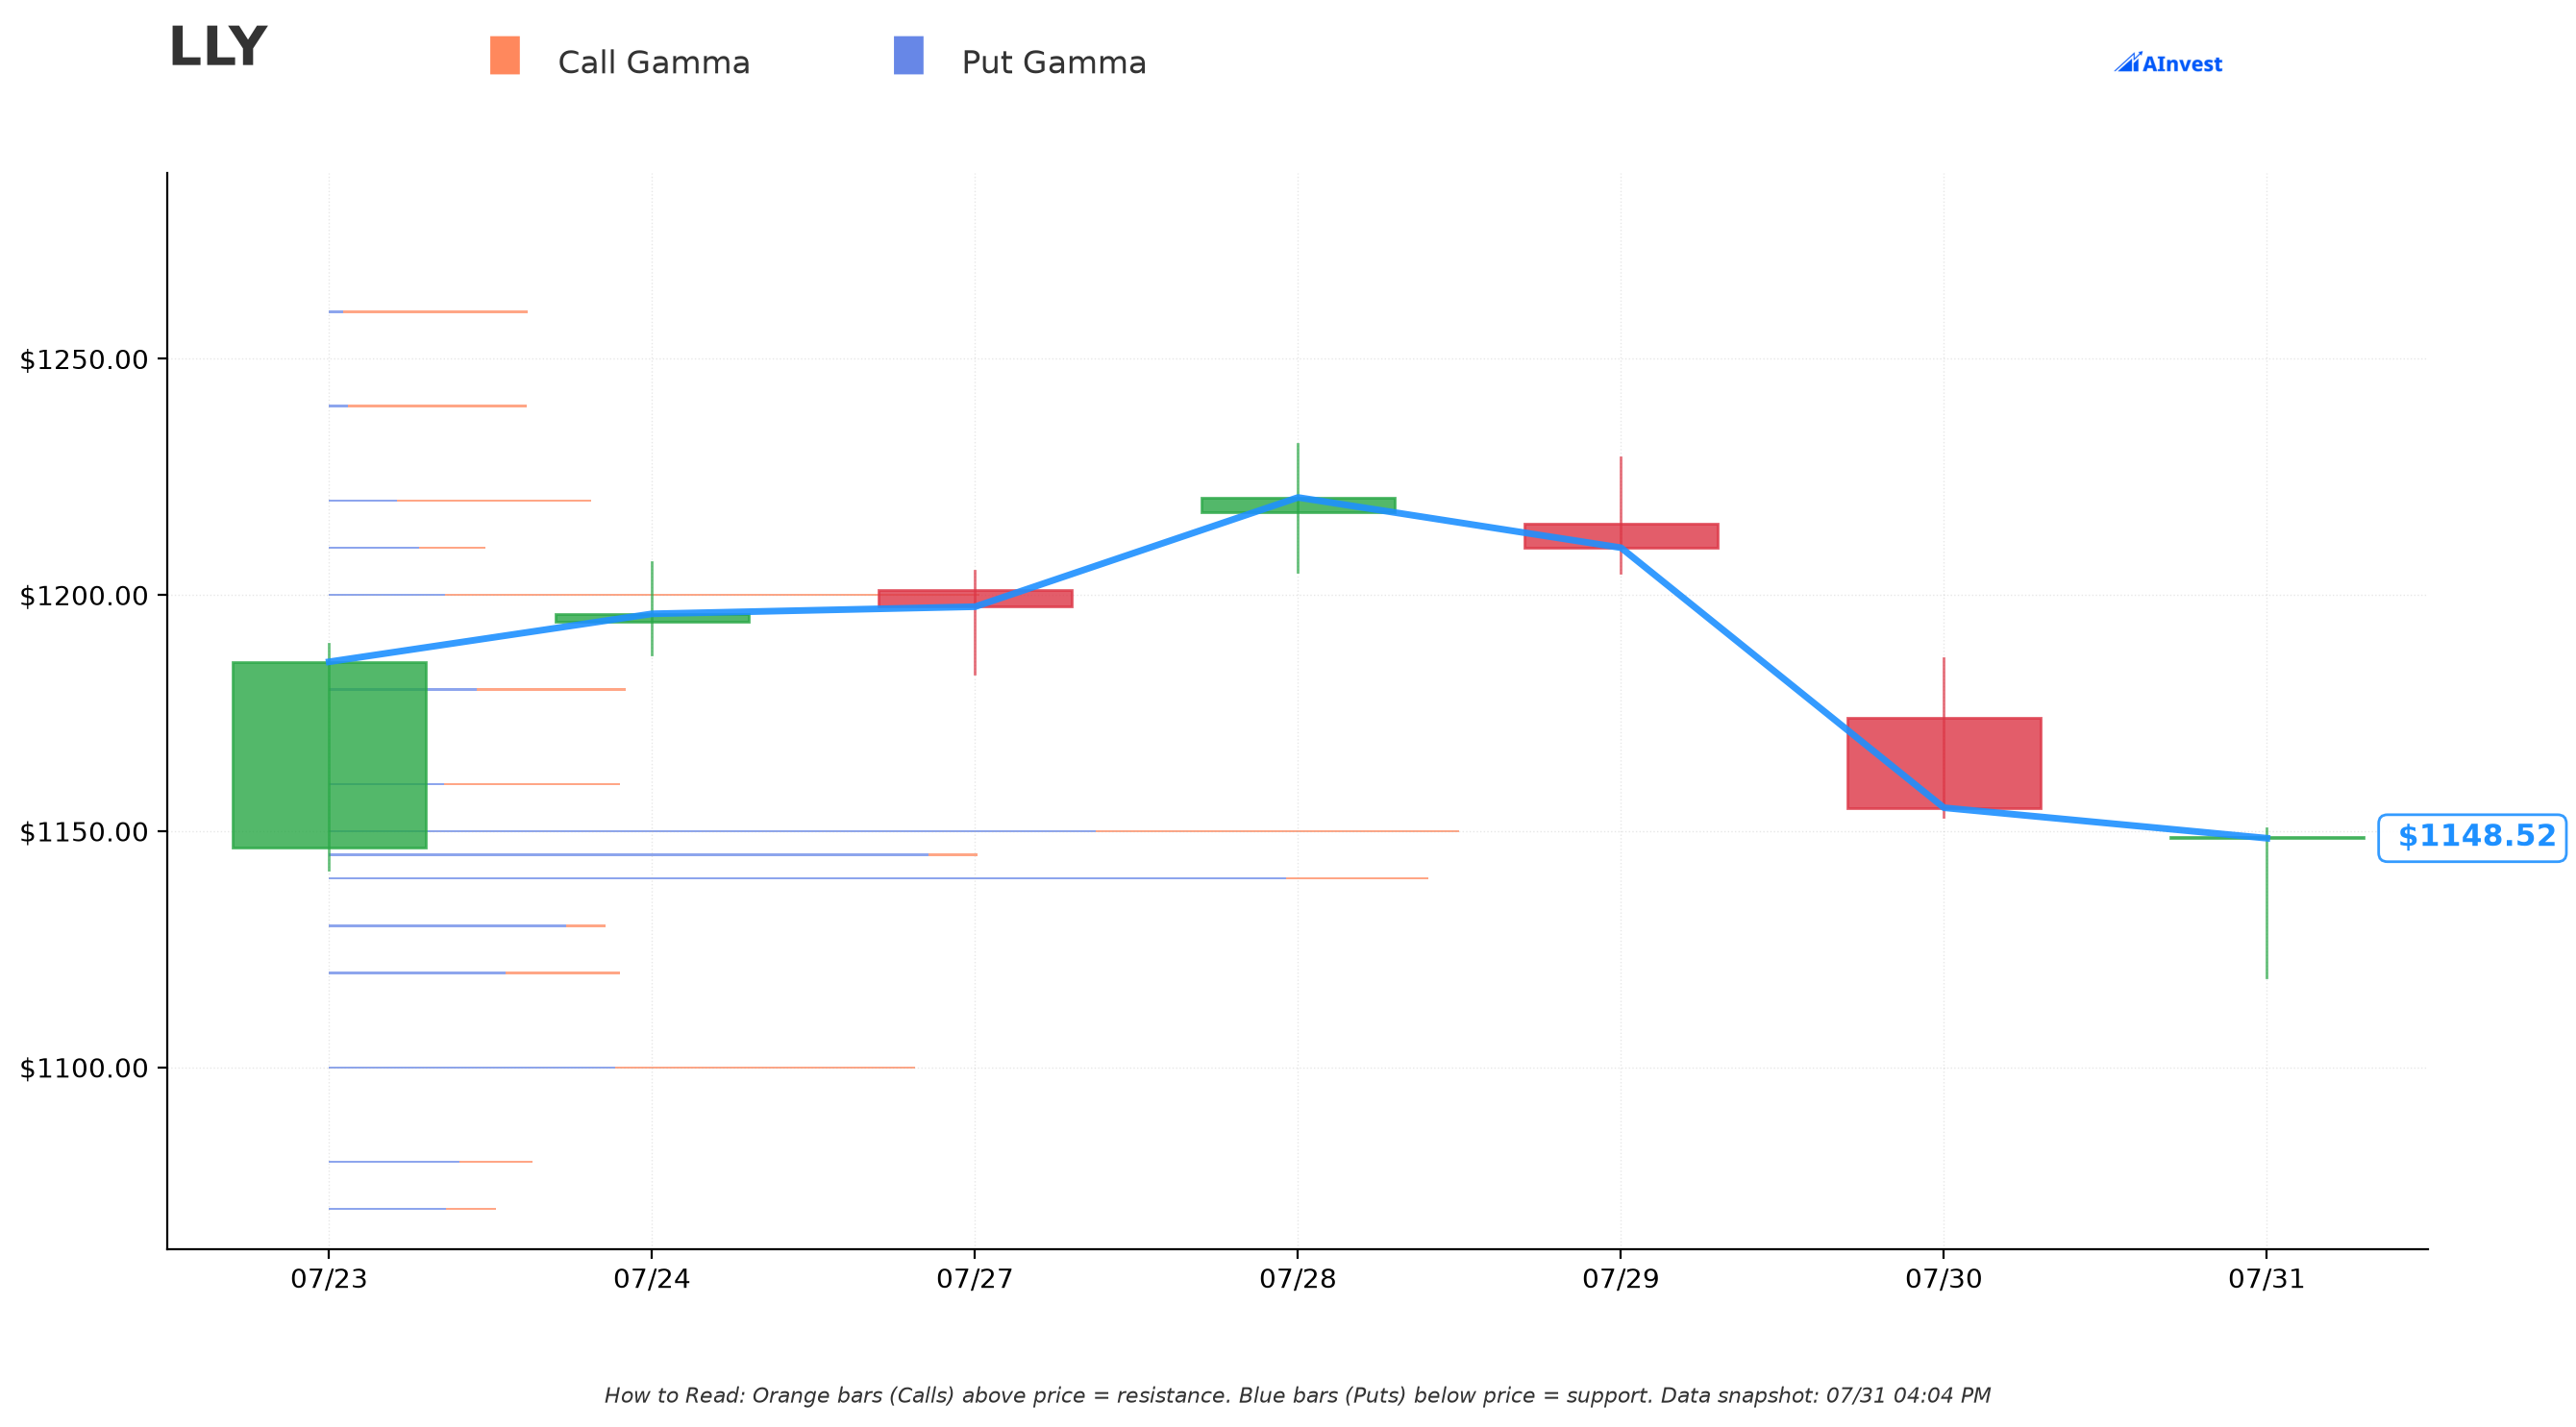
Honest read: this extract found no strong gamma walls. The gamma scan covered 73 strikes and came back with an empty gamma_walls list — there is no single strike where dealer positioning is heavily concentrated enough to act as a magnet or a hard ceiling/floor right now. The closest things to levels are modest:
- 🔵 Support ≈$1,140 (0.77% below spot) — moderate strength, net gamma −2.68B, mostly put-driven
- 🟠 Resistance ≈$1,150 (0.10% above spot) — moderate strength, net gamma −1.33B, essentially right where the stock is trading
Both of those are barely a few dollars from spot, and the total gamma at every nearby strike is small relative to how much notional just printed in this trade. Notably, the $1,680 strike the short call was just written on doesn't even appear in the gamma dataset — the highest strike in the chain (≈$1,660, call gamma only 0.18B) shows almost nothing there. That's consistent with the tape: prior open interest at $1,680 was zero before today. There is no existing dealer positioning at that strike to react to — this trader created it. Bottom line: don't lean on gamma levels for near-term LLY price magnets today; the map is thin.
Implied Move Analysis
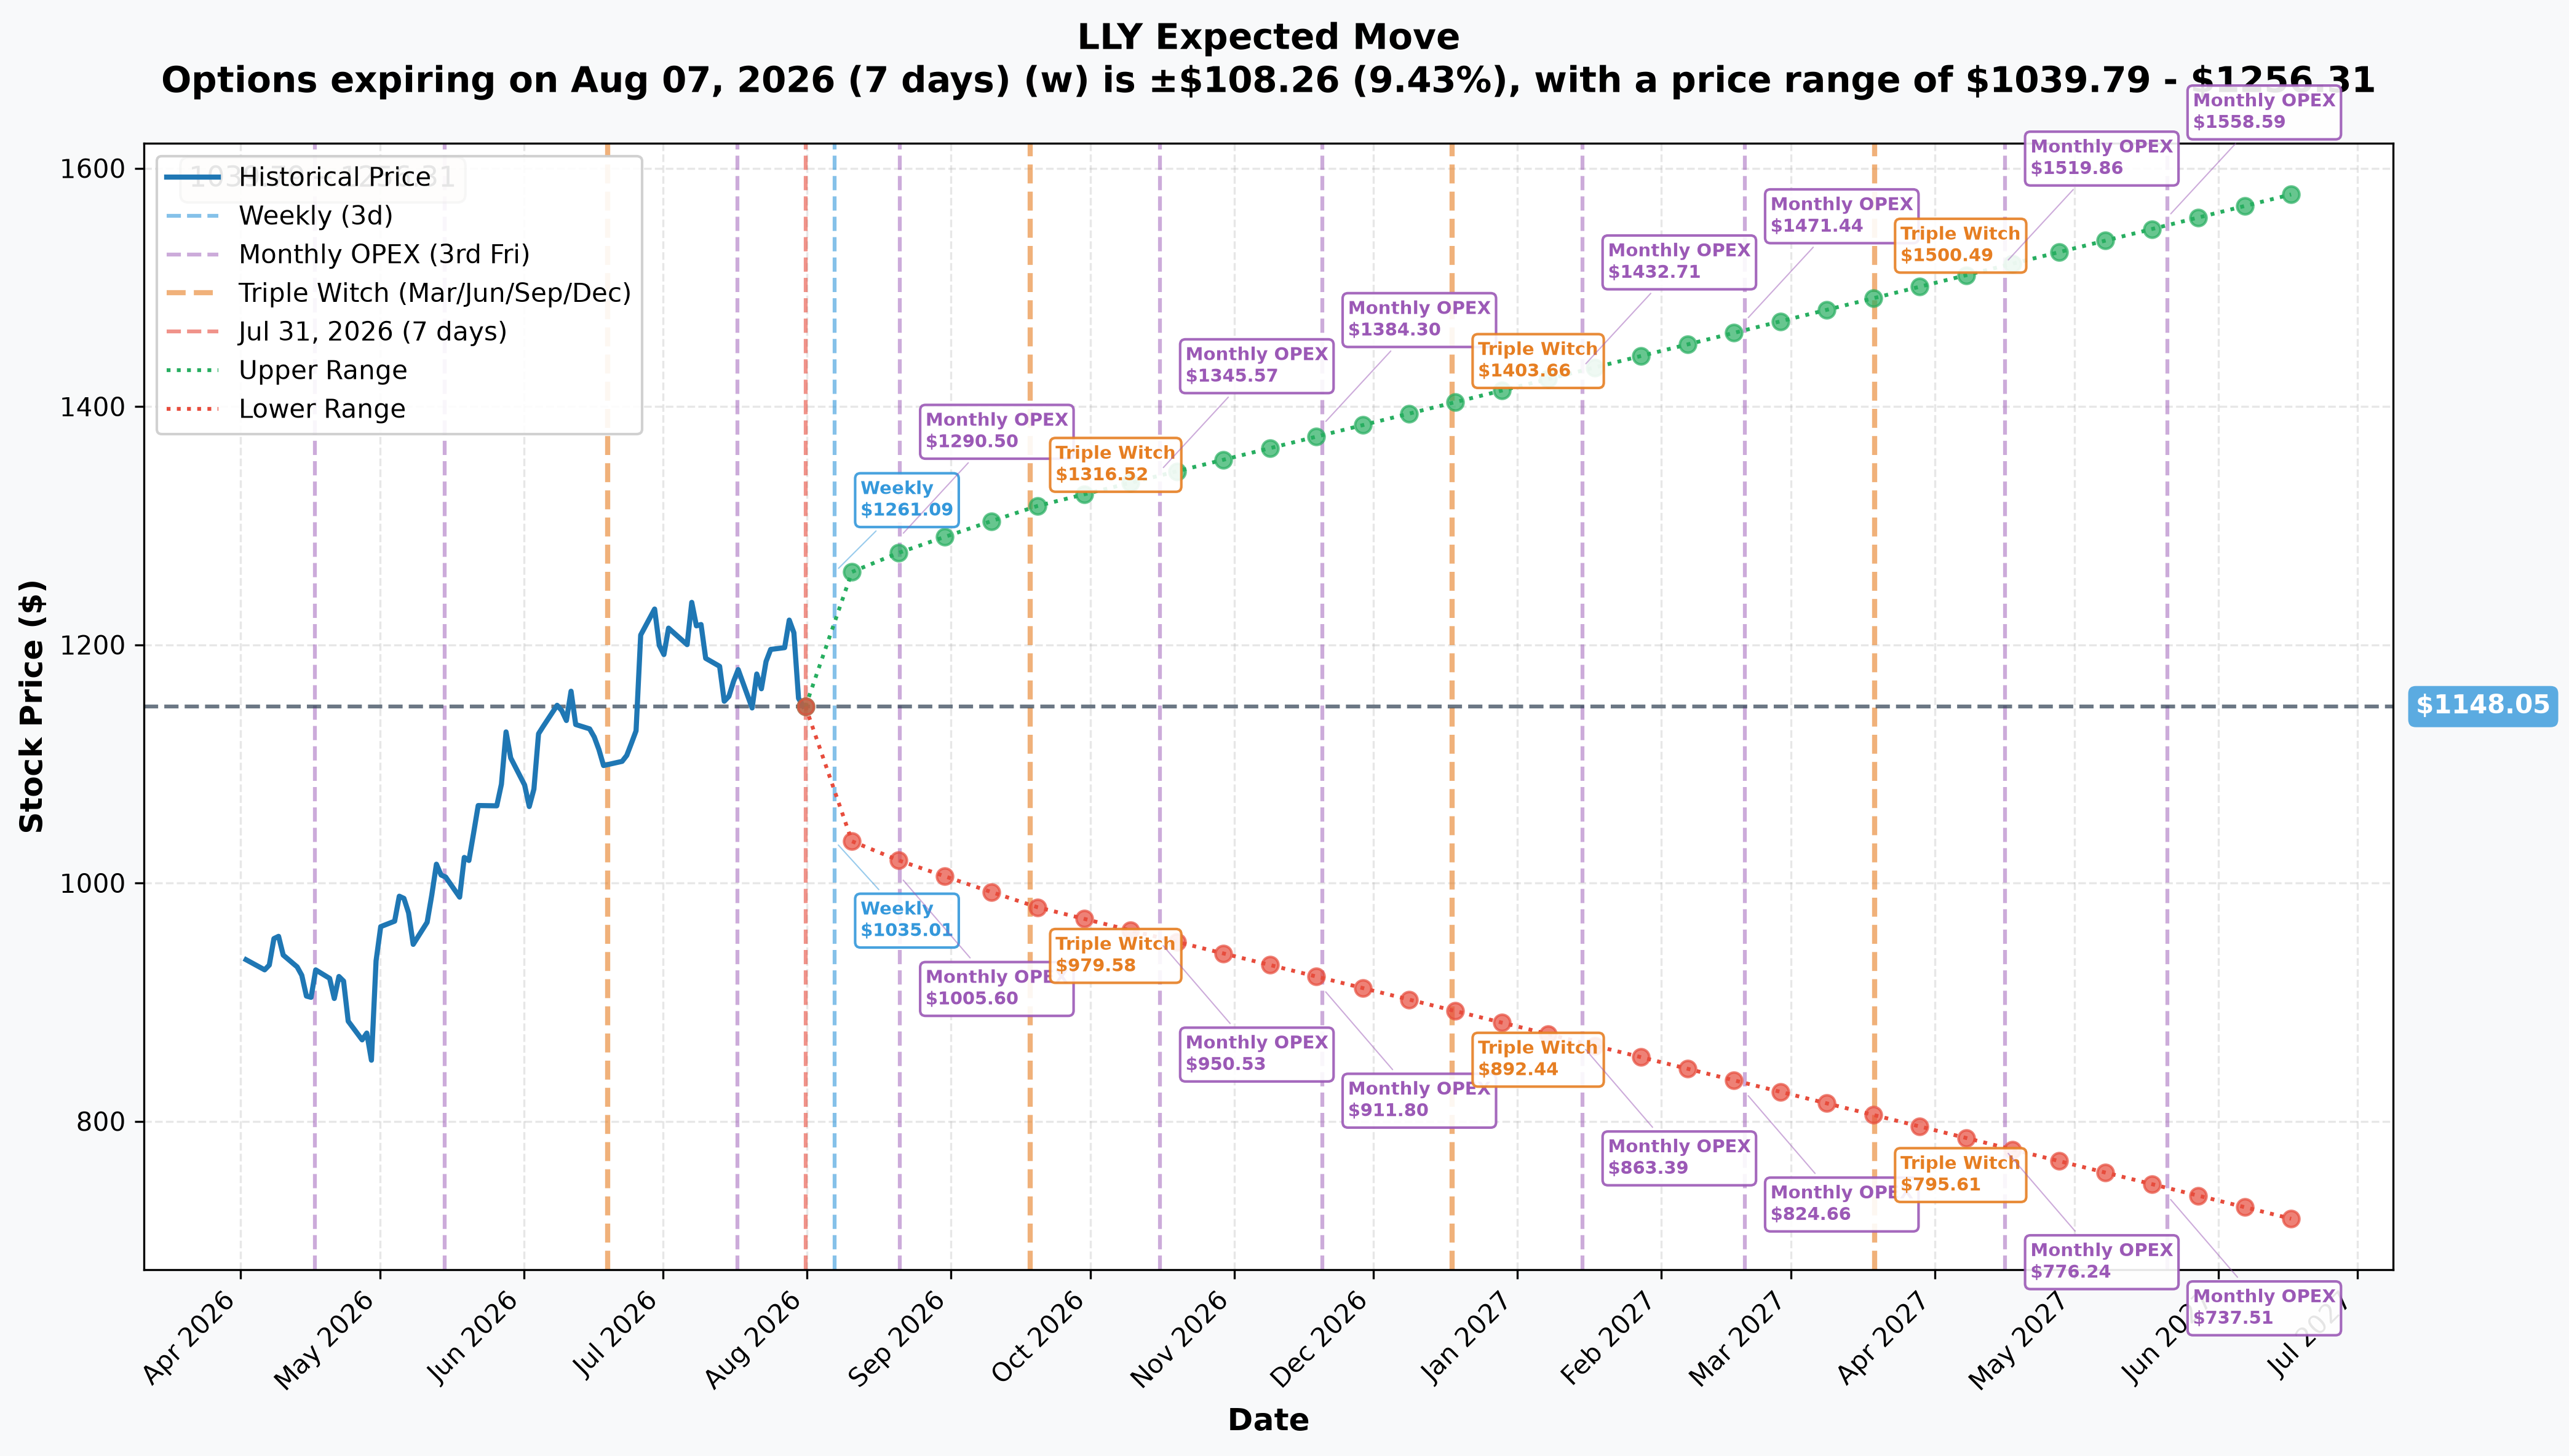
Options pricing gives concrete ranges for how far the market thinks LLY could move by several key dates:
- Weekly (Aug 7, 7 DTE): ±9.43% (±$108.26) → range $1,039.79 – $1,256.31
- Monthly OPEX (Aug 21, 21 DTE): ±11.37% (±$130.58) → range $1,017.47 – $1,278.63
- Quarterly Triple Witch (Sep 18, 49 DTE) — the exact expiration of the $1,040 call in this trade: ±14.59% (±$167.50) → range $980.55 – $1,315.55
- Yearly LEAPS cone (Jun 17, 2027, 321 DTE): ±37.53% (±$430.87) → range $717.18 – $1,578.92
That last range is the longest one the model publishes, and it's already ±37.5% wide — and it only reaches June 2027. The actual collar in this trade runs a full year further, to June 16, 2028. Whatever uncertainty band the market implies for an extra year beyond that cone, it's wider still — a useful reminder of just how much can happen to a $1 trillion pharma stock riding on GLP-1 execution over that stretch, and why someone would want a floor locked in that far out.
🎪 Catalysts
🔥 Near-Term — Inside the September 18, 2026 Call's Window
Q2 2026 earnings — August 5, 2026 📊 This is the biggest confirmed event sitting inside the life of the September $1,040 call — confirmed by Morningstar's earnings preview and referenced in Goldman Sachs' preview coverage. It lands just 2 days after the weekly implied-move window (Aug 7) and squarely inside the 49-day window to Sept 18 — the near-dated call in this trade will live through it.
What actually drove the pre-trade slide (not earnings): Two separate stories converged. First, valuation jitters — Reuters Breakingviews flagged Lilly as "pharma's latest victim of success" on July 30, the same day Morningstar's model moved LLY to a 2-star ("overvalued") rating heading into the print. Second, a sector-wide GLP-1 scare on July 31 — Novo Nordisk's heart-drug candidate ziltivekimab failed a Phase 3 trial, wiping out more than $30 billion of Novo's market cap, and the whole obesity-drug trade — Lilly included — sold off alongside it.
Lilly's non-GLP-1 portfolio is also in focus ahead of the print. Oncology, immunology, and Alzheimer's franchises are drawing scrutiny heading into Q2 earnings — a second lever besides Mounjaro/Zepbound that could move the stock inside the September call's window.
Novo Nordisk lawsuit — filed July 21, 2026 ⚖️ Novo Nordisk sued Eli Lilly, alleging Lilly ran "deliberately false" comparative advertising for its GLP-1 drugs. Litigation headlines like this can move sentiment on short notice and sit well inside the near-dated call's remaining life.
🗓️ Long-Horizon — Spanning the June 16, 2028 Collar
U.S. drug-pricing policy is an ongoing backdrop, not a single event, across the collar's ≈23-month life. So far in 2026: the "Most Favored Nation" pricing push has had "bold aims, but limited impact" so far; the TrumpRx discounted-drug list launched with mixed early impact; and generic drugs were confirmed exempt from new tariffs for two years, with steeper 100-200% rates possible after that window closes. None of this is a single binary catalyst — it's a policy drip that can chip away at pricing power over a multi-year hedge horizon like this one.
The Novo Nordisk rivalry keeps evolving on multiple fronts. Between the ziltivekimab trial failure and the ad-comparison lawsuit, Novo and Lilly are contesting the obesity-drug market clinically, legally, and commercially — and that rivalry will keep generating headlines well past this year, throughout the collar's full window.
What we could not verify — flagged honestly rather than guessed: we found no confirmed, dated catalyst for Mounjaro/Zepbound patent exposure landing inside this window (Lilly's core patents reportedly run out to 2036, well beyond June 2028), and no specific, sourced date for further regulatory milestones on Lilly's oral GLP-1 pill orforglipron within the collar's life. Where the record was incomplete, we're saying so rather than inventing a date — treat these as open questions, not settled catalysts.
🎲 Four Ways to Read This Flow
🚀 YOLO Trader
There's nothing here to copy directly — this whole package is built to be nearly delta-flat, which is the opposite of what a YOLO trade looks for. If you want directional exposure to LLY's GLP-1 story, this print doesn't hand you a strike or a thesis; it hands you a lesson that even the biggest tickets on the board aren't always bets. Chasing a "$15M trade" headline here would be chasing a hedge, not a signal.
📈 Swing Trader
Watch the September $1,040 call specifically — it's the only piece of this package with a short shelf life (49 days to Sep 18) and real near-term delta (≈0.78). ✅ Its open/close status is now settled: this was a buy-to-close on a short call (OI 1,606 → 430), not a new long. That matters for how you read it. The desk is not "adding" near-term bullish exposure from scratch — it is removing a cap it had previously sold, which frees up participation if LLY rebounds from this week's ≈5% slide but does not represent fresh directional conviction. If you were thinking of shadowing this leg by buying the same call outright, understand you'd be putting on a position this desk was happy to be short until today.
💰 Premium Collector
This is the section built for you. The 2028 collar alone was put on for a net credit of ≈$31.23/share (≈$4.996M total) — selling the $1,680 call financed more than the entire cost of the $860 put. That's exactly the mechanic behind a covered-call-financed protective collar: give up upside far above the money to buy a floor far below it, and pocket the difference. A retail account holding LLY shares could study this shape (further-out puts/calls, financed collar) on a much smaller scale — but see the risk section below on why replicating the exact structure isn't realistic.
🌱 Beginner
Think of a collar like insurance you pay for by agreeing to sell your house if someone offers you a huge premium above what it's worth. Here, the "insurance" (the $860 put) protects against LLY falling below $860 — about 25% down from here. The "price cap" (the $1,680 call) means if LLY rallies more than 46% by mid-2028, the seller has to hand over shares at $1,680 no matter how high the stock actually goes. The trader collected more money selling that cap than they spent buying the floor — that's how collars can be "free" or even cash-generating to put on.
⚠️ Risk Factors & Honest Limits
- We cannot prove share ownership. The entire "this is a hedge, not a bet" read rests on the near-zero net delta and the structure — a short call financing a long put is a pattern that only makes economic sense if you're protecting an existing position. But the options tape and the paired 27,000-share stock print cannot show us a brokerage statement. If this trader does not hold underlying LLY shares (or a much larger derivatives book we can't see), the "hedge" framing would be wrong, and this becomes an outright volatility/skew trade instead. That distinction — hedge versus view — is exactly what the tape cannot settle.
- Retail cannot replicate this at scale. A 160,000-share collar plus a 1,500-contract near-dated call is roughly $1.03 trillion-market-cap-stock-sized institutional positioning. A retail account working with 1-5 contracts faces very different bid/ask spreads, margin requirements, and assignment risk (short calls carry early-assignment and dividend risk) than this desk does.
- ✅ The $1,040 call's open/close status RESOLVED cleanly — as a close. We warned it might only ever support a partial read. It didn't: open interest fell 1,176 against a 1,500-lot buy, an unambiguous BTC. The residual ≈22% that transferred rather than retired doesn't muddy the direction. What remains genuinely unknowable is unchanged — whether the shares being overwritten sit on this desk's book.
- Long-dated options carry real time and liquidity risk. The June 2028 legs are ≈23 months out; NBBOs on strikes that far out and that far from the money (the $860 put and $1,680 call quoted at $84.00/$93.00 and $116.00/$129.00 respectively) are wide, and exiting early — for anyone, institutional or retail — would not happen anywhere close to the mid.
- This is not investment advice. Options trading involves substantial risk of loss and may not be suitable for all investors. The read above distinguishes proven tape facts (sizes, prior open interest, near-zero net delta, the matching stock block) from inferred motive (hedge versus view) — treat the inferred part as a hypothesis, not a fact, and never risk more than you can afford to lose chasing a headline print.
🎯 The Bottom Line
Real talk: the headline number here — $15.29M net debit — undersells how much capital actually moved. Roughly $34.5M was bought (the put plus the call) and $19.2M was sold (the call), netting to $15.29M, on a package built to land close to delta-flat. That's the opposite of a conviction bet. It reads most like someone managing risk on a large existing Lilly holding right after a rough two-day stretch for the stock — locking a protection band from $860 to $1,680 through mid-2028, while buying back a near-term cap that had drifted deep into the money. ✅ The August 3 OI check confirmed exactly that: the collar opened at 100.0% of print on both legs, and the September call resolved as a buy-to-close (1,606 → 430). The "hedge, not a bet" read is now well-supported by the tape and by the open-interest record — the one thing still beyond proof is whether the underlying shares sit on this desk's book.
Disclaimer: This analysis is for educational purposes only and is not financial advice. Options trading involves substantial risk of loss and is not suitable for all investors. Structures like this collar require significant capital and carry assignment, liquidity, and time-decay risks that differ meaningfully at retail scale. Always do your own research and consider consulting a licensed financial advisor.
Last updated: 2026-08-03 — next-day OPRA open interest confirmed both 2028 collar legs OPEN at exactly 1,600 each, and INVERTED the Sep $1,040 call to a CLOSE (1,606 → 430, −1,176) — a buy-to-close on a short call, which strengthens the hedge-restructure read.