🔧 LRCX $45M Deep-ITM Put Changing Hands on a +17% Earnings Pop — Confirmed a Hedge Getting Closed, Not a Bearish Bet
📅 July 30, 2026 | 🔥 Unusual Activity Detected
✅ UPDATE — July 31, 2026 pre-market: confirmed a CLOSE (STC), not a new bearish bet. Open interest at the September 18 $340 put fell 16,783 → 9,344 (−7,439) against a 7,500-lot print — a 99.2% match. Somebody retired an existing position; nobody put on $45M of new downside risk. See the ✅ RESOLVED box below.
🎯 The Quick Take
Someone just sold 7,500 Sep-18-2026 $340 puts for $60.35 each — a $45M ticket — on Lam Research (LRCX), the semiconductor-equipment maker whose stock is exploding +17% today to ≈$298 after a blowout earnings beat. The put strike ($340) sits ≈14% above where the stock trades right now, and the position was crossed off-book with a known counterparty — not sold into panic. Because the open interest at that $340 strike has been falling for three straight sessions, this print most likely represents someone closing an existing protective put, not writing a fresh short bet. Either way — and we'll walk through both readings — it is not a bearish signal.
📊 Company Overview
Lam Research (LRCX) is one of the "big three" Western wafer-fabrication-equipment (WFE) makers — the companies that build the machines chipmakers use to actually manufacture semiconductors. Lam's specialty is etch and deposition, the steps that carve and build the tiny 3-D transistor and memory structures onto a silicon wafer, plus a large, high-margin services business selling spares and upgrades to its huge installed base.
- Market Cap: ≈$369.9B
- Sector: Semiconductors / Semiconductor Equipment
- Current Price: ≈$296–$298 (up ≈17% today)
- Split note: LRCX did a 10-for-1 stock split in October 2024, so today's ≈$298 print is the post-split price (equivalent to ≈$2,980 pre-split) — don't be thrown off by the headline strike numbers below.
- Lam is heavily tilted toward memory (46% of systems revenue, a record) — the segment most levered to the AI-driven DRAM/HBM buildout — making it a high-beta way to play the AI capex cycle.
💰 The Option Flow Breakdown
📊 What Just Happened
The Tape (July 30, 2026 @ 12:00:55 ET) — 🤝 Block Cross:
| Time | Buy/Sell | Call/Put | Expiration | Premium | Strike | Volume | OI | Size | Spot | Option Price | Option Symbol |
|---|---|---|---|---|---|---|---|---|---|---|---|
| 12:00:55 | SELL | PUT | 2026-09-18 | $45M | $340 | 7,600 | ≈17,000 | 7,500 | $298.12 | $60.35 | LRCX20260918P340 |
- 🤝 Mechanism: a negotiated block cross — a broker matched a known buyer and seller off the open book. This is not a lit sweep or panic order; it's a pre-arranged trade.
- 💰 $45M changed hands, but ≈70% of that premium is pure intrinsic value. With the stock at $298.12, the $340 put is ≈$42 in-the-money — meaning the seller collected mostly "already there" value, not fresh time premium. That's a classic financing/position-management tell, not a fresh conviction bet.
- 🔍 No equity hedge block found alongside this trade — unlike some of today's other big crosses, this one wasn't paired with a matching stock trade that we could detect.
✅ RESOLVED — It Was a CLOSE (STC), Confirmed Almost to the Contract
This was the single most important open question on the trade, and we refused to guess: a SELL print landing on declining open interest (≈22,975 → 19,375 → 16,783 across July 28–30) suggested someone selling to close an existing long put, but suggestion is not proof. We named the test in advance — OI falling again by roughly today's size confirms a close; flat or rising points to a fresh opening short. The July 31 pre-market OPRA snapshot came back decisively on the close side:
| Leg | Baseline OI (Jul 30 snap) | Resolving OI (Jul 31 snap) | Δ | Print size | Δ as % of print | Verdict |
|---|---|---|---|---|---|---|
| Sep-18-2026 $340 Put | 16,783 | 9,344 | −7,439 | 7,500 | ≈−99.2% | ✅ CLOSE (STC) |
Open interest fell by 7,439 against a 7,500-lot print — a 99.2% match. Contracts are destroyed only when a position is closed, so a print of this size landing on a strike that shrank by almost exactly that amount can only be a closing trade. The fresh-short (STO) reading is ruled out: had someone been opening a new short put for premium, open interest would have risen. The strike's total session volume was 7,568 contracts and 7,439 of them were retired outright. No cancellations appeared on the tape.
What this means in plain terms: nobody put on a new $45M bearish position yesterday. Someone took an existing one off. A holder who had been carrying deep-in-the-money September $340 puts — insurance bought when Lam was trading far lower — cashed them in after the stock ripped ≈17% higher. That is a position being retired, not risk being added, and it is the least bearish of the two possible readings. Open interest at this strike has now fallen by more than half in four sessions (≈22,975 → 9,344), which tells you this unwind has been running for days and yesterday's block was its largest single step.
What the tape still cannot prove: whether the seller was closing a long put they owned (STC) or a dealer's inventory was being unwound on the other side, and nothing at all about the holder's identity, motive, or remaining book. What is now proven is the direction of the position change: this strike shrank.
🤓 What This Actually Means — Plain English
Let's decode this one step at a time, because the mechanics matter more than the sticker price.
1. The strike is deep in-the-money. A $340 put on a $298 stock is already worth ≈$42 just from intrinsic value alone — before you add any time premium. The market priced this contract at $60.35, so roughly $42 of that $60.35 (≈70%) is money the put would be worth even if it expired today. Deep-ITM options like this trade almost like stock substitutes — they're often used for financing, hedging, or unwinding existing positions rather than making a fresh directional bet.
2. STC vs. STO — why it matters. Both labels show up as "SELL" on a screenshot, but they mean opposite things:
- STC (Sell to Close) = the seller already owned this put (probably bought as portfolio insurance weeks or months ago) and is now selling it back — pocketing the gain or simply removing a hedge that's no longer needed. This is a de-risking / profit-taking move, not a new bearish position.
- STO (Sell to Open) = the seller is writing a brand-new short put, collecting $45M in premium and taking on the obligation to buy LRCX at $340 if it's below that level by September 18. This would be a bullish-to-neutral premium-collection play — the seller is betting the stock stays above $340, essentially agreeing with the Street's optimism.
3. Why the falling OI leans toward "closing a hedge." LRCX just posted a record quarter and a guide roughly $1B above Wall Street's number — the stock is up ≈17% today. If someone was holding a $340 put as downside insurance against a long LRCX position (bought back when the stock was drifting lower into earnings), today's monster rally is exactly the moment you'd expect them to take that insurance off the table — the risk it was protecting against just evaporated. The three-day decline in open interest at this exact strike is consistent with existing longs unwinding, not new shorts piling in.
4. Why this is NOT a bearish signal either way. Whether it resolves as STC (closing a hedge — neutral/bullish housekeeping) or STO (opening a short put — implicitly bullish, since the seller needs LRCX to stay above $340), neither reading is a bet against Lam Research. A short put — new or existing — only produces a loss for the seller if LRCX falls, so nobody here is positioned to profit from a decline. Compare that to a $45M put purchase, which would be a genuinely bearish signal — this is the opposite structure.
📈 Technical Setup / Chart Check-Up
YTD Performance Chart
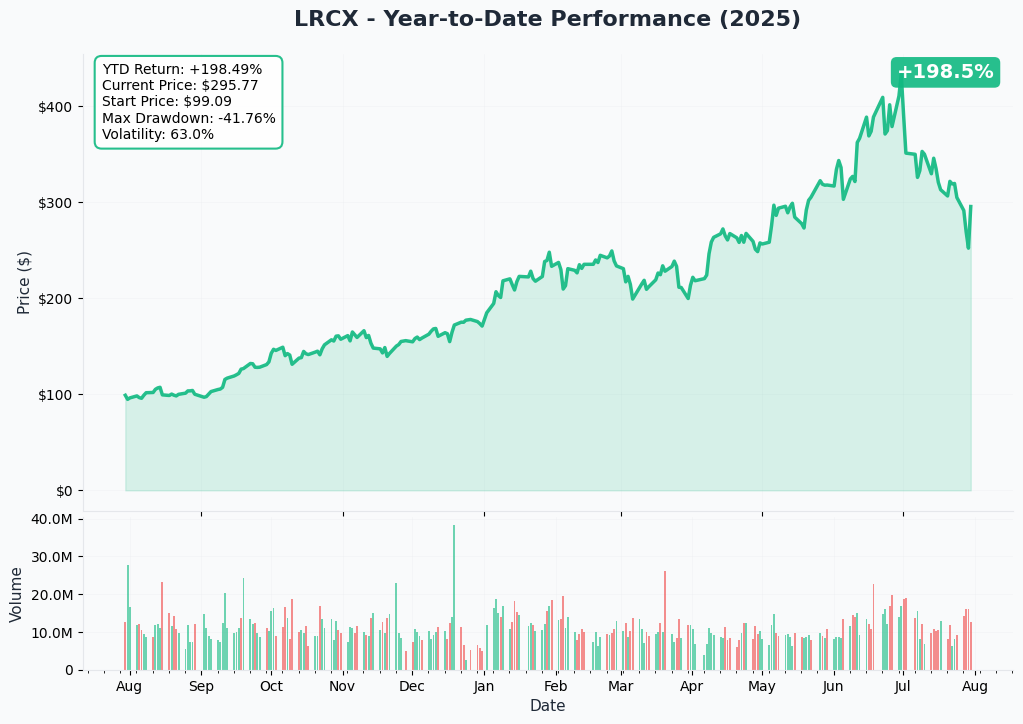
Lam Research has been on an absolute tear, and today's ≈17% earnings-driven gap higher to ≈$298 is the latest — and largest single-day — leg of that move. The chart shows a stock that spent the last several months grinding higher into the print before today's gap confirmed the AI-memory capex story the market had been pricing in.
Gamma-Based Support & Resistance Analysis
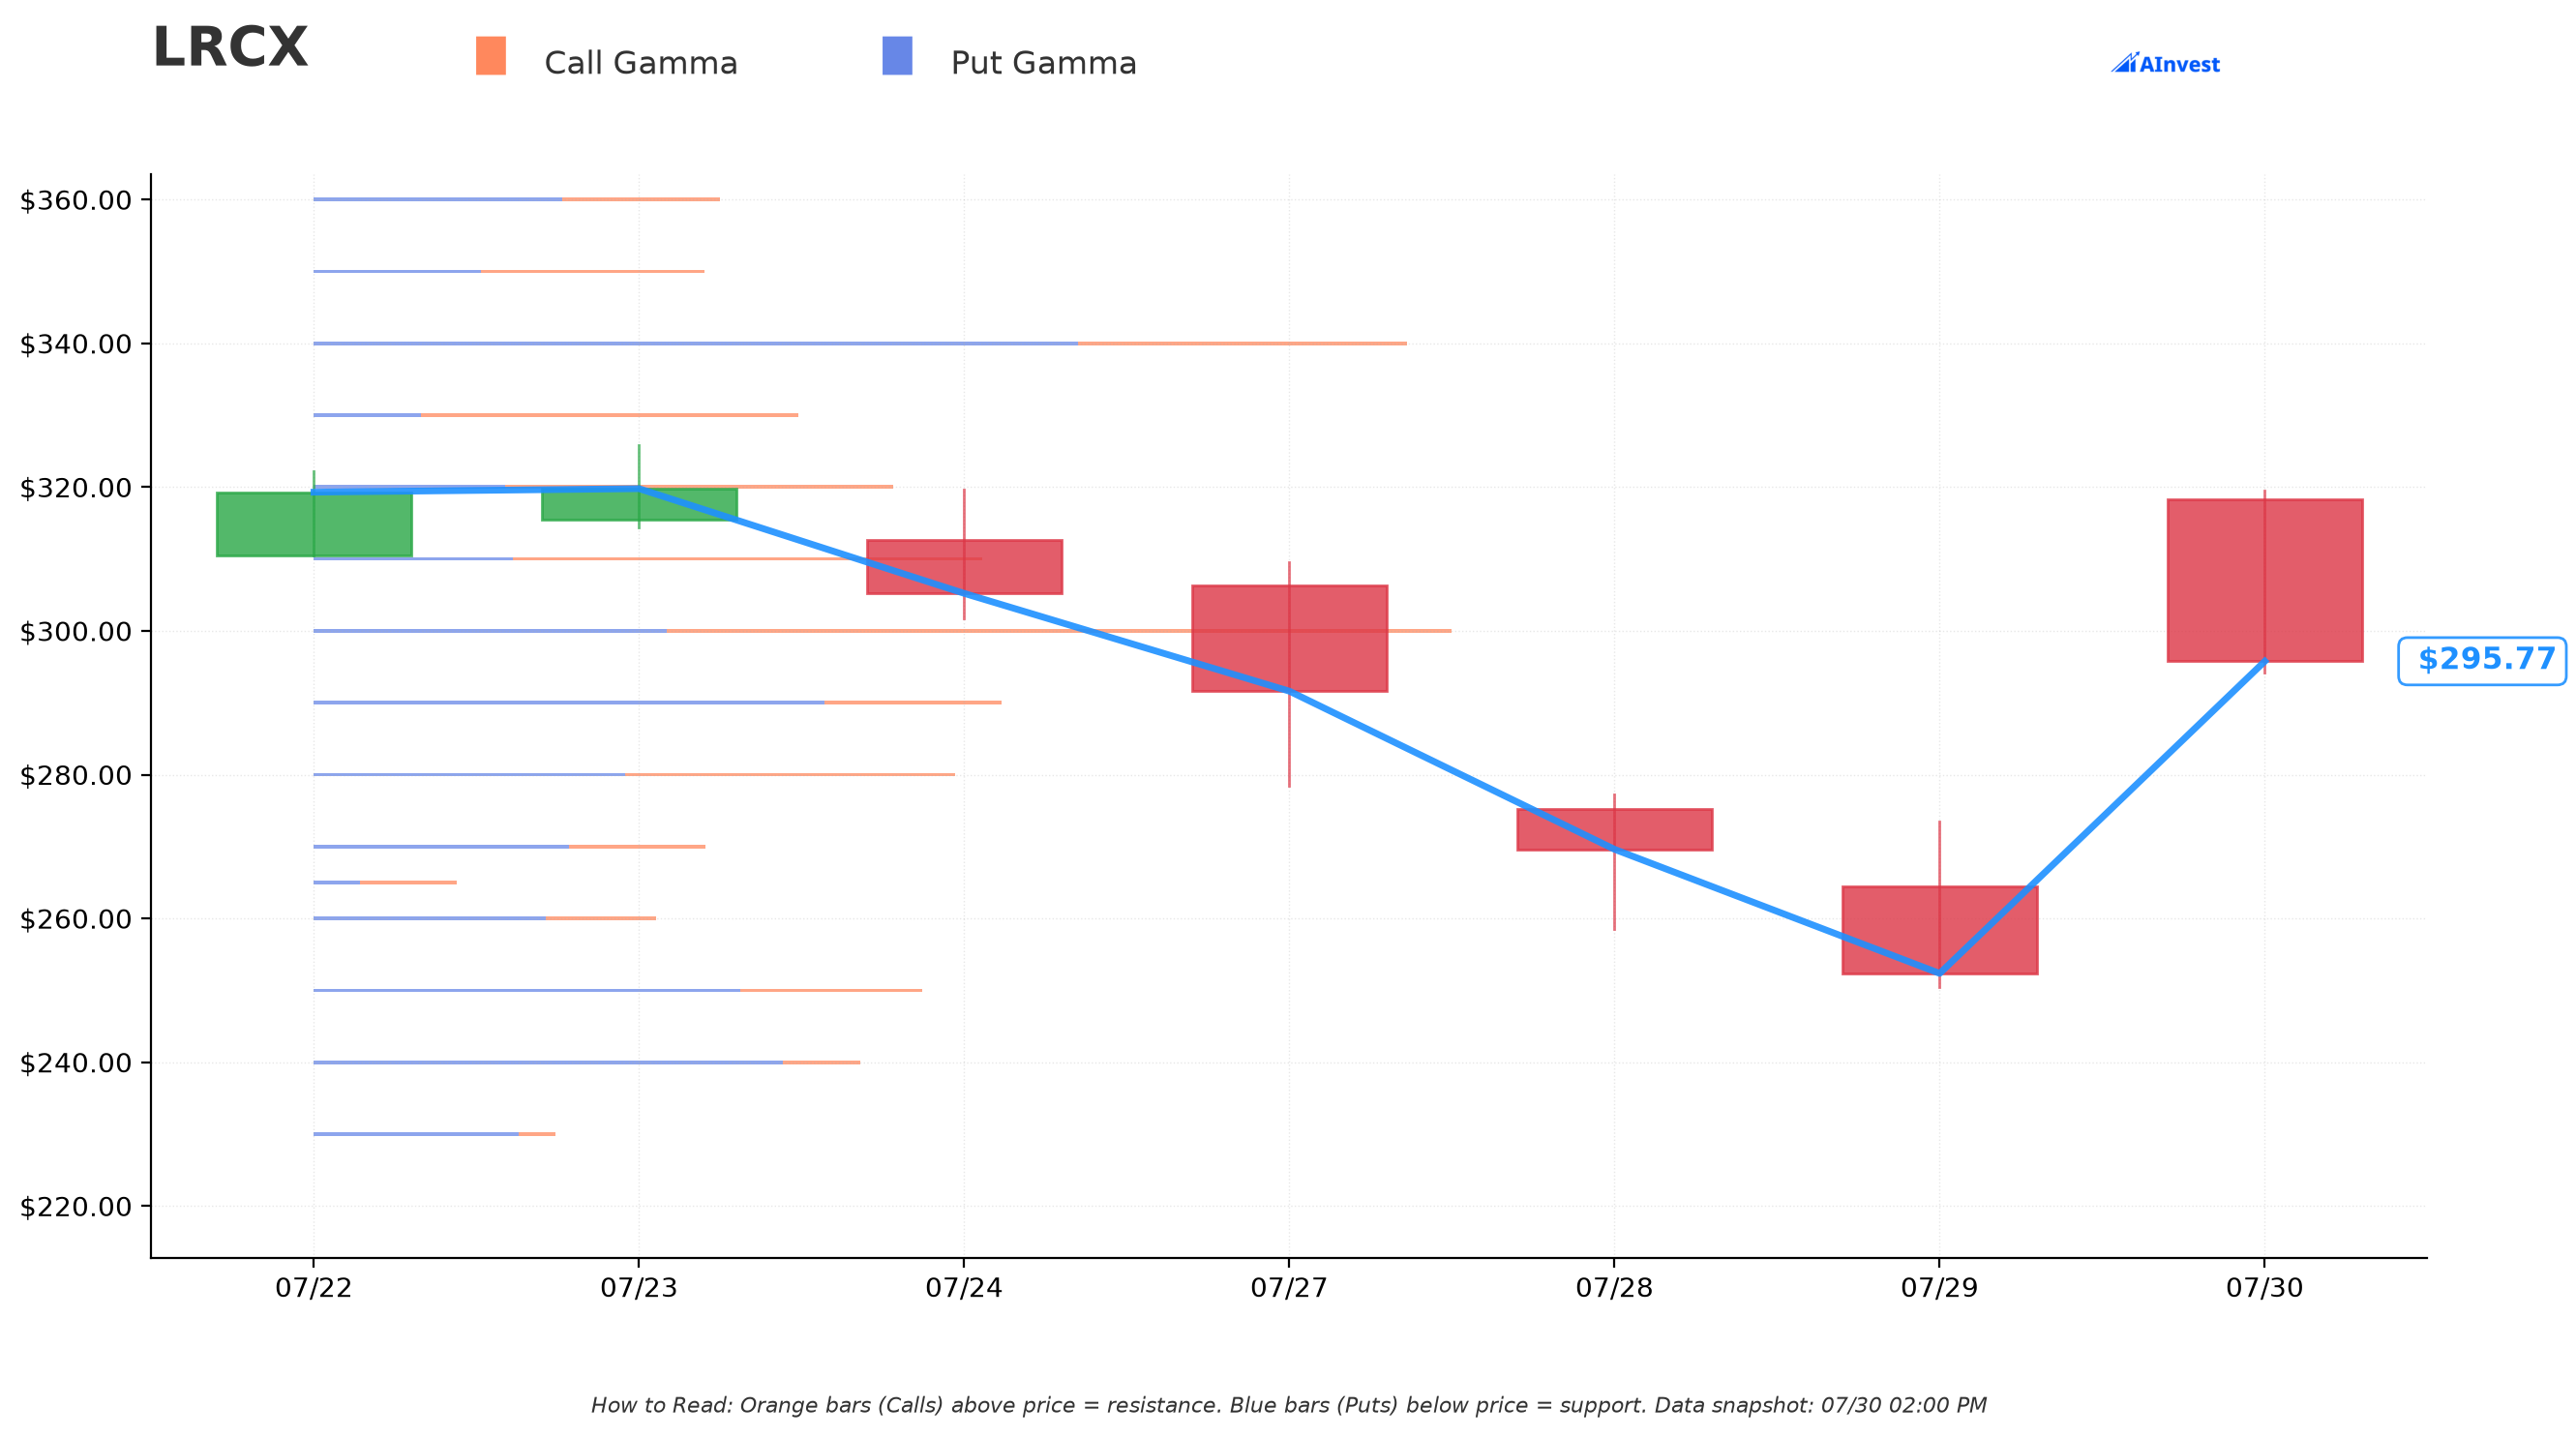
Current Price: ≈$296
- 🟠 $300 — Nearest resistance (Moderate strength). This is the closest level with meaningful call-gamma concentration (call gamma ≈2.94B vs. put gamma ≈1.33B), sitting just ≈1.3% above the current price. Expect some chop/selling pressure as LRCX tests round-number $300.
- 🔵 $290 — Nearby support. Just below spot, the $290 strike carries the largest put-gamma concentration in the near-the-money zone (≈1.92B put gamma), which tends to act as a dealer-hedging floor on pullbacks.
- 👀 $340 — Worth watching. Interestingly, this is exactly the strike from today's put trade, and it already carries one of the largest total gamma concentrations in the entire chain (≈4.10B, mostly put-side), consistent with the very large existing open interest (still ≈16,783 contracts even after three days of declines) sitting there.
What this means for traders: LRCX just gapped through a wall of resistance on the earnings pop, and the nearest gamma "ceiling" ($300) is barely above where it's trading now. A clean break above $300 with follow-through would open room toward the next liquid strikes higher; a fade back toward $290 would still keep the bullish structure intact.
Implied Move Analysis
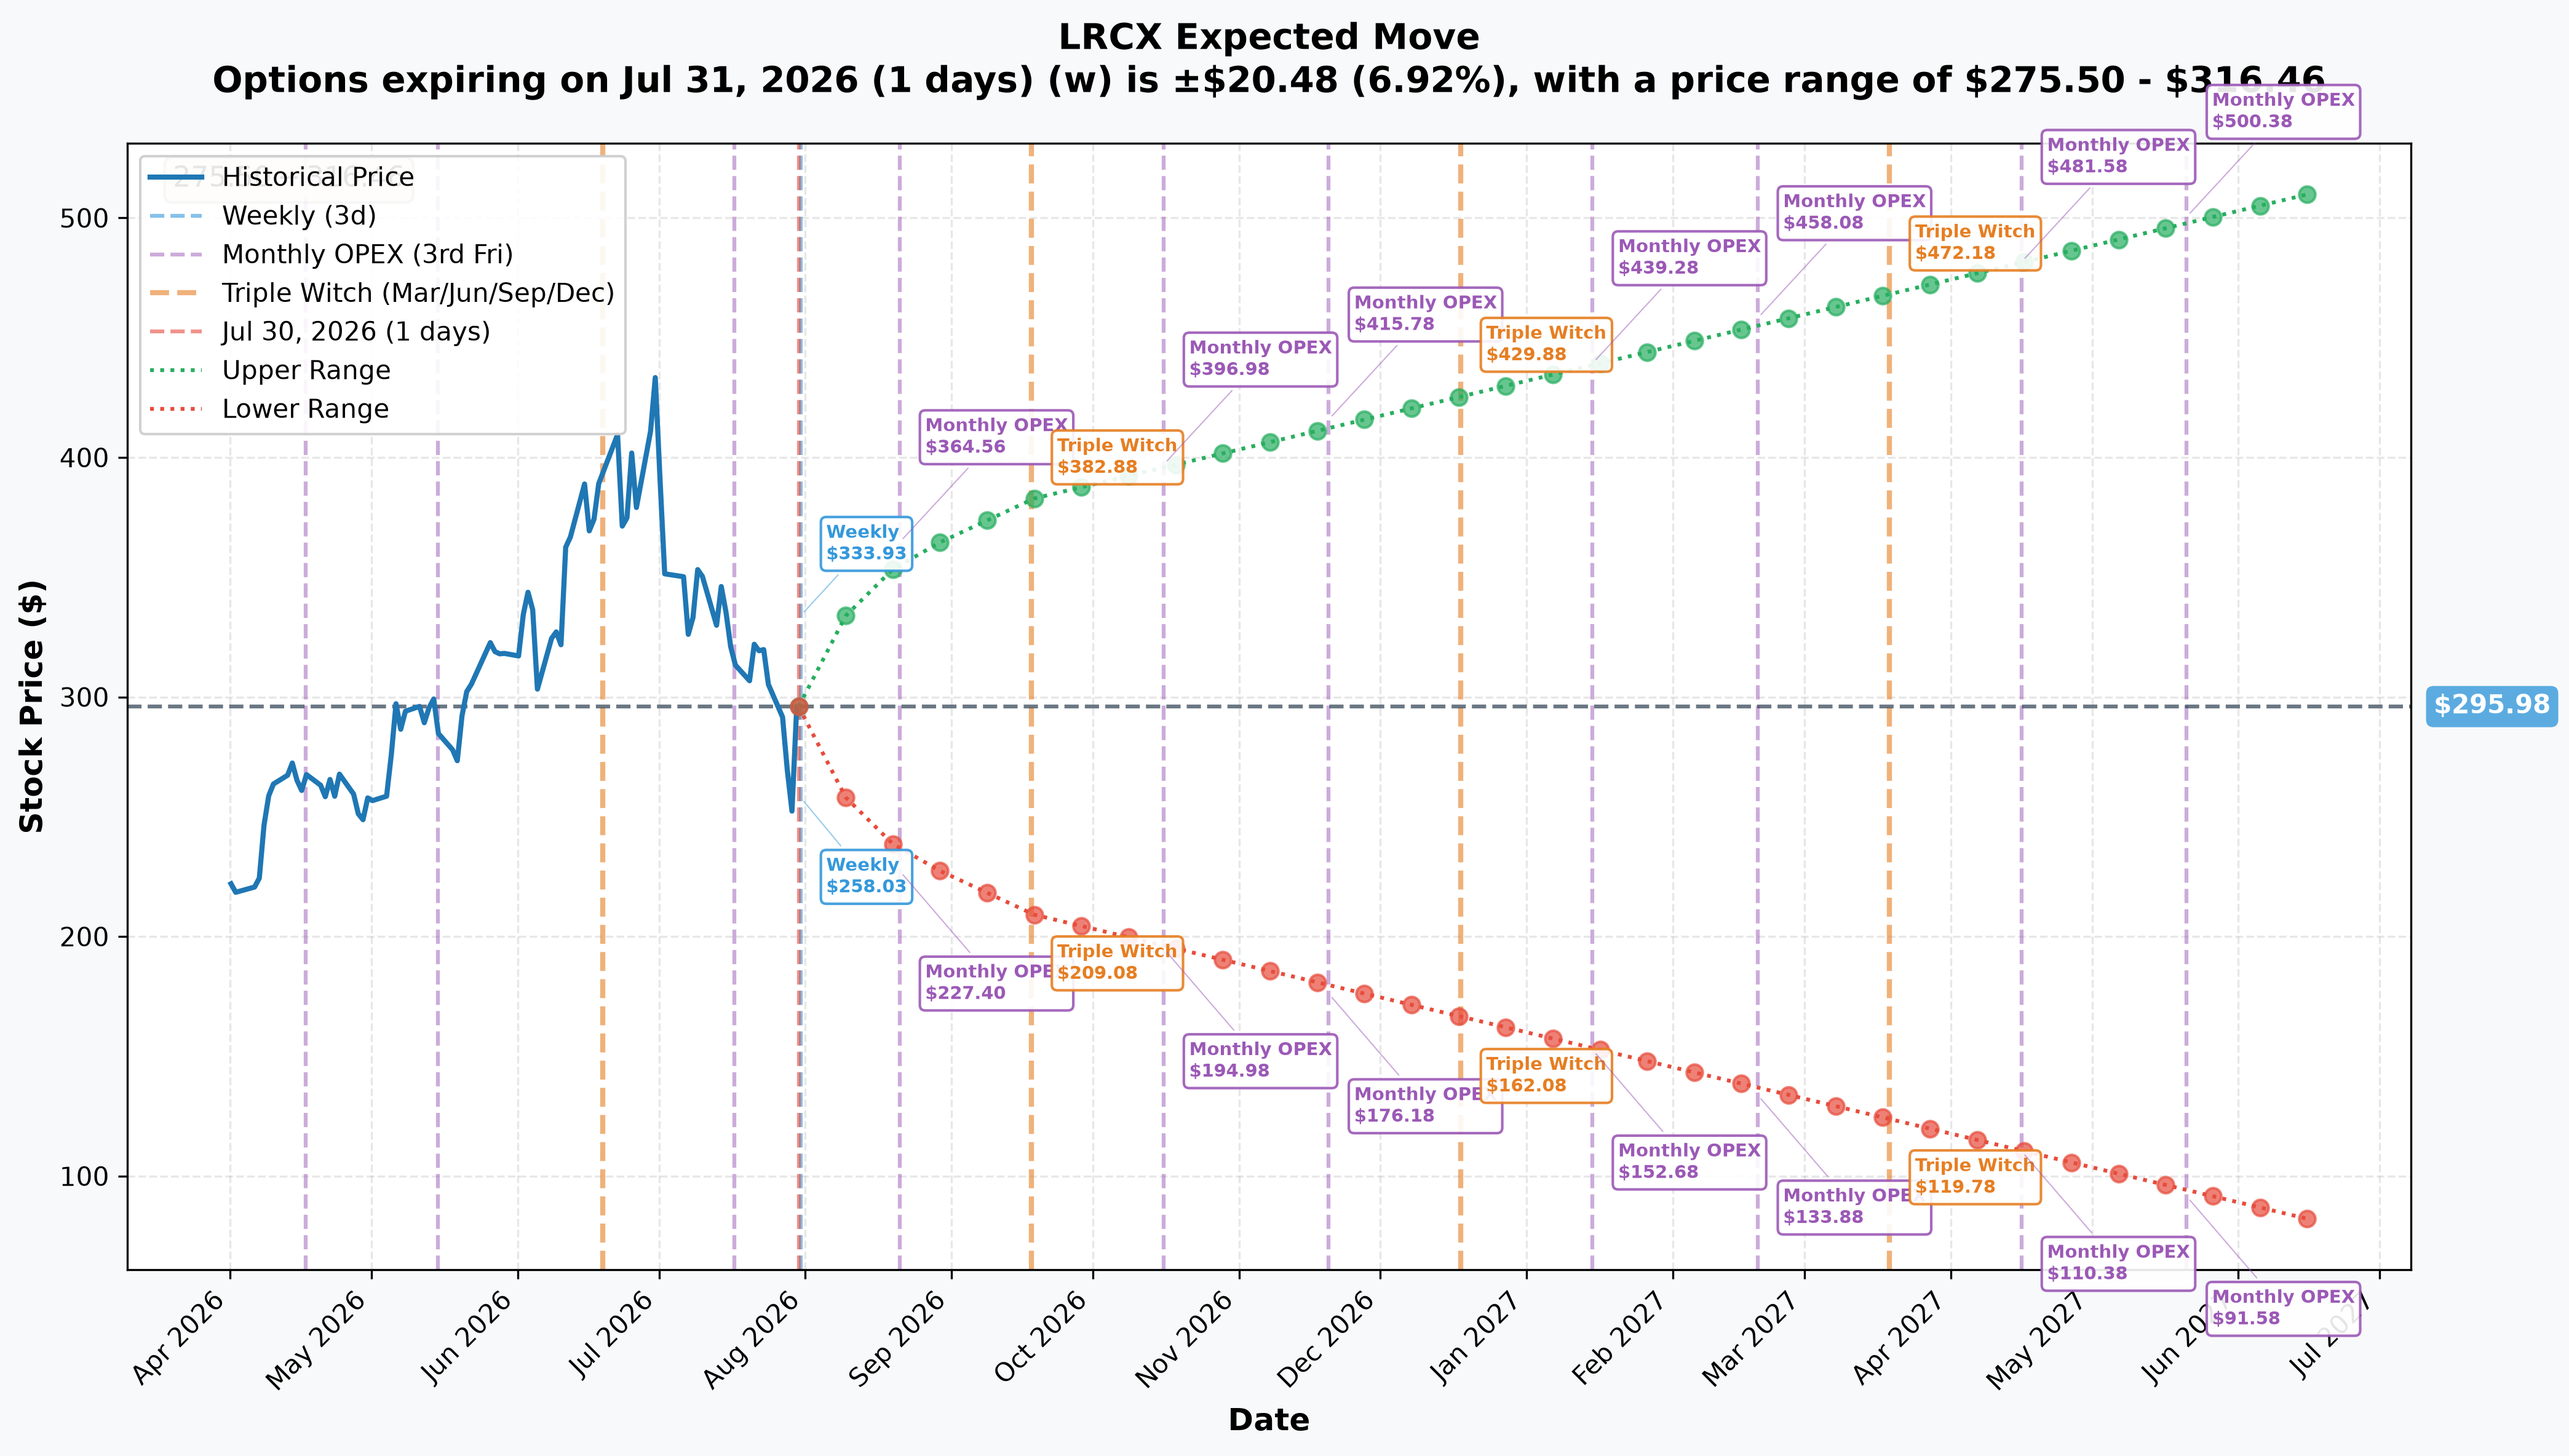
Options market pricing for upcoming expirations (as of today, spot ≈$296):
- 📅 Weekly (July 31 – 1 day): ±$20.48 (±6.9%) → Range: $275.50 – $316.46
- 📅 Monthly OPEX (August 21 – 22 days): ±$61.25 (±20.7%) → Range: $234.73 – $357.23
- 📅 Triple Witch (September 18 – 50 days, SAME EXPIRATION AS THIS TRADE): ±$86.90 (±29.4%) → Range: $209.08 – $382.88
Translation for regular folks: Options are pricing in a jaw-dropping ±29.4% possible swing between now and the September 18 expiration — completely normal for a stock that just gapped 17% in one day. The important number: the $340 strike from today's trade sits comfortably inside that implied-move range, well below the $382.88 upper bound. In other words, the options market doesn't think $340 is an unreasonable level for LRCX to be near by September — it's roughly in line with where a continuation of today's momentum (and the Street's ≈$386 average target) could take the stock.
🎪 Catalysts
✅ Already Happened (Last 3 Months)
Fiscal Q4 2026 Earnings — Reported July 29, 2026, after the close
- Revenue: $6.72B, up ≈30% year-over-year — a record, per GuruFocus's earnings-call recap.
- EPS: $1.82 (record), beating the ≈$1.68–$1.72 consensus, per Quiver Quantitative.
- Gross margin ≈52% — the highest in ≈20 years, per GuruFocus.
- September-quarter guide: ≈$8.1B (±$400M), roughly $1B above the ≈$7.1B Street estimate, implying >20% sequential growth, per Seeking Alpha.
- Management raised its calendar-2026 wafer-fab-equipment (WFE) market view to "low $150 billion" (from a prior $140B view), calling it an "extraordinary setup" for 2027, per Seeking Alpha.
- Shares actually fell ≈6% into the print during the regular session on July 29, then reversed sharply after hours once the guide landed — and have rallied ≈17% today, July 30, per Quiver Quantitative and stockanalysis.com.
- Analyst reaction: Bernstein raised its target to $360 (from $340), JPMorgan to $340 (from $315), and HSBC to $333 (from $247) — all per Quiver Quantitative. Consensus now sits at ≈32 Buy / 1 Hold / 0 Sell ratings with an average price target of ≈$386, per MarketBeat.
🔮 Upcoming (Next 3–6 Months)
- Fiscal Q1 2027 earnings (September quarter): expected late October 2026, per the Nasdaq earnings calendar — the market will be checking whether Lam can beat-and-raise again off the new ≈$8.1B baseline.
- AI-driven WFE demand confirmation: the raised "low $150B" CY2026 WFE view is the dominant multi-quarter catalyst; peer prints from ASML, Applied Materials, KLA, and memory makers will confirm or challenge it, per Seeking Alpha.
- HBM / advanced-packaging ramp: management expects advanced-packaging revenue to grow more than 50% in calendar 2026, a direct read-through to the AI-accelerator buildout, per Quiver Quantitative.
- Capital return: Lam's next quarterly dividend declaration/payment falls in the September–October window (last was $0.26/share, paid July 8, 2026), per Globe & Mail / Zacks.
🎲 Price Targets & Probabilities
Combining the gamma map, the implied-move cone, and the catalyst calendar through the September 18 expiration (when this trade expires):
📈 Bull Case (≈30% probability) — Target: $340–$380
Momentum from today's beat carries through, LRCX clears the $300 gamma resistance with follow-through buying, and the stock grinds toward the Street's ≈$386 average target ahead of late-October earnings. This would put the $340 strike from today's trade solidly in-the-money for the seller — meaning a short put here (if it resolves as STO) or an already-closed hedge (if STC) both look like the "right side" of the move.
🎯 Base Case (≈45% probability) — Target: $290–$330 (digesting the gap)
The most likely near-term path: LRCX consolidates its massive one-day gain, chopping between the $290 gamma support and $300–$310 resistance while the market digests the size of the move and waits for confirmation from peer WFE names (ASML, Applied Materials, KLA) and October's Q1 FY27 print.
📉 Bear Case (≈25% probability) — Target: $260–$290
A "sell the news" reversal after such a large single-day pop, a broader semiconductor pullback, or a China-related headline (China fell to ≈26% of revenue from ≈34% last quarter) drags the stock back toward its pre-earnings levels. Even in this scenario, the $340 strike stays well out of reach for a September test, meaning today's put sale still isn't at meaningful risk of being tested.
💡 Trading Ideas
🛡️ Conservative: Wait for the OI Confirmation
Play: The pre-market OI check has now confirmed STC — this was a position being closed, not new bearish risk, so there is nothing here to react to directionally.
Why this works: Today's print is genuinely ambiguous from the tape alone. Chasing a "bearish put seller" narrative — or a "bullish premium collector" narrative — before the OI data resolves it risks reacting to the wrong story. Patience costs nothing here.
Risk level: Minimal | Skill level: Beginner-friendly
⚖️ Balanced: Trade the Fundamentals, Not This Print
Play: If you like the LRCX story off this earnings beat, consider a defined-risk call spread into the October earnings date rather than trying to mimic an institutional deep-ITM put trade you can't fully decode.
Structure example: Look at a call debit spread around the $300–$330 zone in an October or November expiration, sized to the ≈20–29% implied-move range shown above.
Why this works: It expresses the same bullish WFE/AI-memory thesis the Street is pricing (≈32 Buy ratings, ≈$386 average target) with defined risk, without depending on correctly guessing an ambiguous block-cross trade's intent.
Risk level: Moderate | Skill level: Intermediate
🚀 Aggressive: Fade or Follow the $300 Gamma Level (ADVANCED ONLY)
Play: Short-dated options traders can watch the $300 gamma resistance as a pivot — a clean break-and-hold above it on volume could support a fast continuation move; a rejection there into the weekly $275–$316 implied-move range offers a mean-reversion setup.
Why this could blow up: LRCX just moved 17% in a single day — implied volatility is elevated and any options bought here are expensive. A move that "should" happen can still cost you the entire premium if timing is off by even a day or two.
Risk level: Extreme | Skill level: Advanced only
👥 How Different Traders Should Read This
🎰 YOLO Trader: There's nothing here to YOLO into. This is a $45M negotiated block cross on a deep-ITM strike — it's financing/position management, not a headline directional signal. Chase the earnings momentum on its own merits if you want exposure, not this specific print.
📊 Swing Trader: The real actionable signal today is the stock's technical setup, not the option trade: watch the $300 gamma resistance and the $290 support shelf over the next few sessions. The OI print has closed the loop on this trade's true intent — it was a close, not new risk — so let your own read on price action lead.
💰 Premium Collector: If this resolves as STO, the seller collected $60.35 (≈70% intrinsic) betting LRCX holds above $340 through September 18 — a bullish, income-generating structure similar in spirit to a covered-call/cash-secured-put program, just executed at institutional size. Worth studying the strike selection (≈14% OTM by implied terms) if you run similar plays, but size any premium-selling of your own to your own risk tolerance, not this trade's size.
🌱 Beginner: The key lesson here: a "SELL" on a screenshot can mean two very different things. Selling to open a put (STO) means someone is taking on new risk to collect premium. Selling to close a put (STC) just means someone is exiting a position they already had — often to bank a profit or remove a hedge that's no longer needed. When you see big option "sell" trades in headlines, always ask which one it is before assuming a directional message.
⚠️ Risk Factors
Be honest about what the tape can and can't prove:
- ✅ STC vs. STO is RESOLVED — confirmed a CLOSE. The July 31 snapshot showed OI falling 16,783 → 9,344 (−7,439 against a 7,500-lot print, a 99.2% match). The fresh-short scenario is ruled out; this was an existing position being retired.
- 🔍 No equity hedge was detected alongside this trade. That doesn't rule one out — OPRA can't see stock trades routed through certain venues, dark pools, or executed at a different time — it just means we found no matching block.
- 🕵️ OPRA cannot tell us who did this trade or why. We don't know if this is a single institution, a market maker unwinding inventory, a family office, or part of a larger multi-asset strategy. Broker identity, customer identity, and any offsetting positions elsewhere are invisible to the public tape.
- 💸 Valuation is stretched after a ≈17% one-day pop. LRCX now trades at a premium multiple after a record quarter; any wobble in the WFE outlook, a China export-control headline (China fell to ≈26% of revenue from ≈34%), or a broader semiconductor de-rating could hit the stock independent of this specific option trade.
- 📊 Margin durability isn't guaranteed. The ≈52% gross margin is a 20-year high partly driven by favorable mix — normalization toward Lam's long-term framework is a real multi-quarter question, not a settled fact.
🎯 The Bottom Line
Real talk: A $45M options trade sounds scary in a headline, but this one is a deep-in-the-money put — mostly intrinsic value — changing hands via a negotiated block cross, on a day LRCX just ripped 17% higher on a genuinely excellent earnings report. The falling open interest at the $340 strike over the last three sessions points toward someone closing out downside protection now that the risk it was guarding against has passed, rather than a fresh bearish bet. Even in the alternative reading — a fresh short put sale — the seller is implicitly betting LRCX holds above $340, which is a bullish-to-neutral position, not a bearish one.
If you own LRCX: This trade isn't a reason to sell — and the OI check has now confirmed why: it was somebody closing downside insurance, not opening a bearish bet. The fundamental story (record quarter, ≈$8.1B guide, raised WFE outlook, ≈32 Buy ratings) remains the dominant driver here — watch the $300 gamma level for near-term resistance.
If you're watching from the sidelines: Don't read this specific option print as either a green light or a red flag. Focus on the fundamentals (WFE up-cycle, DRAM/HBM demand, late-October earnings) and the technical levels ($300 resistance, $290 support) instead.
Mark your calendar:
- ✅ July 31, ≈06:30 ET — next-day OPRA open interest (done — confirmed STC, a close).
- 📅 Late October 2026 — fiscal Q1 2027 (September quarter) earnings, re-anchoring to the new ≈$8.1B guide.
- 📅 September 18, 2026 — expiration of today's $340 put trade.
Disclaimer: Options trading involves substantial risk of loss and is not suitable for all investors. This analysis is for educational purposes only and not financial advice. Past performance doesn't guarantee future results. The open/close read on this trade has been confirmed by the July 31 next-day open-interest snapshot: it was a close (STC), not a fresh short. What the tape still cannot reveal is the holder's identity, motive, or remaining book. Always do your own research and consider consulting a licensed financial advisor before trading.
Last updated: 2026-07-31 — next-day OPRA open-interest confirmed this trade as a CLOSE (STC): OI 16,783 → 9,344, −7,439 vs a 7,500-lot print (≈99.2%). The fresh-short (STO) alternative is ruled out.