🐋 MCHP $15.7M Bullish Call Roll — Dumping OTM September Calls to Buy Deep-ITM December Upside Into the Aug 6 Earnings Print
📅 July 31, 2026 | 🔥 Unusual Activity Detected
🔄 CORRECTED — August 3, 2026 pre-market: the next-day OI check inverted the read on the September leg, and it changes what this trade is. We published this as a call diagonal — buying December $65 calls and opening a new short September $85 call to finance it ("a poor man's covered call"). Open interest proves otherwise: the September $85 strike fell 20,297 → 12,333 (−7,964) against the 11,000-lot sale. A sale that destroys open interest is closing an existing long, not opening a short. This is a bullish call ROLL — the desk liquidated OTM September calls and rolled the proceeds into deep-ITM December calls — and the upside is NOT capped at $85. Title, structure, and the capped-upside framing have been corrected throughout. See the 🔄 RESOLVED box for the full table.
🎯 The Quick Take
A trader executed a $15.73M net debit bullish call roll on Microchip Technology (MCHP) at 10:31:53 ET — selling out of 11,000 September $85 calls they already owned and buying 11,000 deep in-the-money December $65 calls with the proceeds and then some. This is not an income trade and it is not a capped structure. It is a conviction upgrade: abandon a cheap, out-of-the-money, near-dated call that needed a ≈12% rally just to matter, and replace it with a long-dated call that is already $10.79 in the money and behaves like owning the stock. It landed one week before MCHP's expected August 6 earnings report, with the stock still down ≈28% from its June high even as the underlying business has been telling a recovery story. Translation: someone stopped buying lottery tickets and started buying the stock — synthetically, with five extra months on the clock.
📊 Company Overview
Microchip Technology (MCHP) designs and manufactures 8/16/32-bit microcontrollers, analog and mixed-signal chips, FPGAs, memory, timing/synchronization and connectivity products — plus a growing high-speed data-center connectivity business. It's a classic broad-line analog/embedded semiconductor supplier, heavily levered to industrial and automotive capex cycles, with industrial ≈31%, data center ≈18%, automotive ≈17%, aerospace & defense ≈16% of sales.
- Sector/Industry: Information Technology → Semiconductors (analog/MCU/embedded)
- Market Cap: ≈$40.85B
- Shares Outstanding: 543.01M
- Forward P/E: ≈23.5 | Trailing P/E: ≈345 (depressed by trough GAAP earnings)
- Dividend Yield: ≈2.42% ($1.82 annualized)
- 52-Week Range: $48.52 – $105.91
- CEO: Steve Sanghi
- Institutional Ownership: ≈91.5%
MCHP closed at $104.03 on June 22 — the 2026 high — then got caught in a broad chip-sector selloff, bottoming at $71.37 on July 29 before bouncing to ≈$75 by July 31. That's a ≈28% drawdown in five weeks, right into an earnings print.
💰 The Option Flow Breakdown
🤝 BLOCK CROSS — negotiated package, both legs printed at 10:31:53 ET
This was a genuine two-party block cross — a broker matched a known counterparty on both legs at once, off the open book. It is not a lit sweep, so there's no "aggression" to read into the print; the trader and the seller already agreed on price.
| Time | Symbol | Buy/Sell | Call/Put | Expiration | Premium | Strike | Volume | OI | Size | Spot | Option Price | Option Symbol |
|---|---|---|---|---|---|---|---|---|---|---|---|---|
| 10:31:53 | MCHP | BUY | CALL | 2026-12-18 | $19.91M | $65 | 11,515 | 50 | 11,000 | $75.79 | $18.10 | MCHP20261218C65 |
| 10:31:53 | MCHP | SELL | CALL | 2026-09-18 | $4.18M | $85 | 11,239 | 20,297 | 11,000 | $75.79 | $3.80 | MCHP20260918C85 |
Net debit paid: $15.73M ($14.30 net × 11,000 × 100). Gross premium moved was $24.09M: $19.91M paid for the December calls, $4.18M collected from liquidating the September calls.
⚠️ How to read those two numbers — corrected August 3. Because the September leg is a close, not a short sale, the $4.18M is recycled proceeds from an existing asset, not income from selling premium. The $15.73M net debit is the new money committed; the $19.91M gross is the size of the long position now on the books. For a roll, the gross long-side commitment is the figure that describes the trader's actual exposure — the net debit only describes how much fresh cash they had to add on top of what they already had working.
The Dec $65 call was bought $10.79 in the money (spot $75.79 vs strike $65), and it traded 80% of the way toward the ask ($16.90/$18.40 NBBO) — consistent with the buy side of the negotiation. The Sep $85 call printed exactly at the $3.80 bid — consistent with the sell side. Net change in delta: ≈+406,670 shares of MCHP-equivalent exposure — the December calls added ≈+858,000 shares of delta while liquidating the September calls gave back ≈−451,000. (This arithmetic is unchanged by the roll correction: selling a call you own removes delta from your book exactly as writing a new one would.)
About that stock print: 396,000 shares (297,000 + 99,000) crossed at $75.60 at 10:33:06 — 73 seconds after the option package. That's a close delta match to the options' net exposure. We flag this as consistent with a hedge, not proven — the timing gap and lack of a shared print ID mean we can't confirm the two orders were linked by the same desk.
🔄 RESOLVED — the September Leg Was a CLOSE, Not a New Short. This Is a Roll.
We named the test in advance: "OI up ≈11,000 confirms a fresh open; OI flat-to-down would mean today's sale was mostly offsetting existing contracts, not new short exposure." The August 3 pre-market OPRA snapshot came back decisively on the down side:
| Leg | Baseline OI (Jul 31 snap) | Resolving OI (Aug 3 snap) | Δ | Print size | Δ as % of print | Verdict |
|---|---|---|---|---|---|---|
| Dec-18-2026 $65 Call (bought) | 50 | 11,225 | +11,175 | 11,000 | ≈102% | ✅ OPEN (BTO) — roll-open leg |
| Sep-18-2026 $85 Call (sold) | 20,297 | 12,333 | −7,964 | 11,000 | ≈−72% | 🔄 CLOSE (STC) — roll-close leg, inverts our published read |
The two legs moved in opposite directions, which is the definition of a roll. Open interest is only created when a position opens and only destroyed when one closes. December $65 gained 11,175 contracts — ≈102% of the print, a complete fresh open. September $85 lost 7,964 contracts, shedding ≈39% of everything that existed at that strike. A sale landing on a shrinking strike cannot have opened new short exposure. The trader was long those September calls and sold them out.
What this changes — and it is not cosmetic:
- There is no short call. The upside is not capped at $85. The published framing said this trade "rents out the upside above $85 through mid-September." That was wrong. After this roll the desk holds a naked long December $65 call and nothing offsetting it — upside is uncapped from the first dollar.
- It is not a "poor man's covered call," and it is not a diagonal. A diagonal requires a live short leg. This structure has one leg after the dust settles.
- The $4.18M collected is recycled profit, not financing income. Per our standing rule on rolls: anchor to the gross long-side commitment ($19.91M), not the net debit. The September calls were an existing asset being liquidated; their proceeds part-funded the new position. Calling that "income" implies a premium-selling strategy that isn't happening here.
- The directional read gets stronger, not weaker. Swapping a $9-out-of-the-money September call (≈0.41 delta) for a $10.79-in-the-money December call (≈0.78 delta) roughly doubles the delta per contract and adds three months of time. That is a trader pressing a view, not hedging one.
Honest nuance on the close. Open interest fell by 7,964, not the full 11,000 — so roughly 72% of the sale genuinely retired contracts while the remaining ≈3,036 changed owners rather than being extinguished. Most of the position was liquidated outright; a minority was taken over by someone else. Either way this desk's September exposure is gone.
🤓 What This Actually Means — Plain English
Let's break down exactly what got built here, because the vocabulary matters:
Why this is a "roll," not a "diagonal" spread. ✅ Corrected August 3 — confirmed by the next-day OI check above. A diagonal spread requires a live short leg: you buy one call and simultaneously open a short call at a different strike and expiry, and you carry both. That is what we originally published here, and open interest disproved it. What actually happened is a roll — one position closed, another opened, at the same instant. The trader already owned September $85 calls; they sold them (destroying open interest at that strike) and used the proceeds toward December $65 calls (creating open interest there). When you're done, only one position exists, not two.
The tell is in the direction of the open-interest change, and nothing else on the tape can substitute for it. Both a diagonal and a roll look identical intraday — same two prints, same sizes, same net debit. Only the next morning's OI tells you whether the sold leg was created (diagonal) or destroyed (roll). It was destroyed.
Order types, decoded — corrected:
- The Dec $65 call was BTO — Bought To Open. ✅ Confirmed (OI 50 → 11,225). They paid $18.10 for a call that's already $10.79 in the money, meaning $18.10 = $10.79 of real intrinsic value + $7.31 of time premium. This behaves a lot like owning ≈75-80 shares of stock per contract, for a fraction of the capital.
- The Sep $85 call was STC — Sold To Close. 🔄 Confirmed (OI 20,297 → 12,333). We originally labeled this STO. They were long these calls and sold them for $3.80 each — $19.21 above spot, pure time value, no intrinsic value at all. This was a position being exited, not premium being sold.
The strategy has a name retail traders will recognize: rolling down and out. The old position — September $85 calls — needed MCHP to rally ≈12% in seven weeks just to reach the strike, and the whole thing would have expired worthless if the recovery took longer than that. The new position is struck $10.79 below the stock, so it has real intrinsic value on day one and only loses if MCHP falls further. They traded a low-probability, high-leverage bet for a high-probability, stock-like one — and paid $15.73M net for the privilege. That is what "increasing conviction" looks like in options terms.
The trade-off — corrected: there is no cap. The published version of this article said upside was capped at $85 through September 18. That is wrong and has been removed. With the September leg closed out, the desk holds a long December $65 call and nothing offsetting it. If MCHP rips through $85 on the August 6 print, this position captures every dollar of it. What they gave up isn't upside — it's the September calls' explosive convexity in a fast rally, traded for durability and a much better chance of being right at all.
Motive, most likely read — upgraded: this is not a "reduce the cash outlay" trade. It is a conviction upgrade financed by liquidating a weaker version of the same view. The delta math makes it plain: the September calls carried ≈0.41 delta each; the December calls carry ≈0.78. Same 11,000 contracts, roughly double the directional exposure, plus three extra months spanning a second earnings report. Someone decided the drawdown is overdone and that their previous expression of that view was too far out of the money and too short-dated to survive being early. This is a "we think the drawdown is overdone, and we want to actually own the recovery" trade.
📈 Technical Setup / Chart Check-Up
YTD Chart
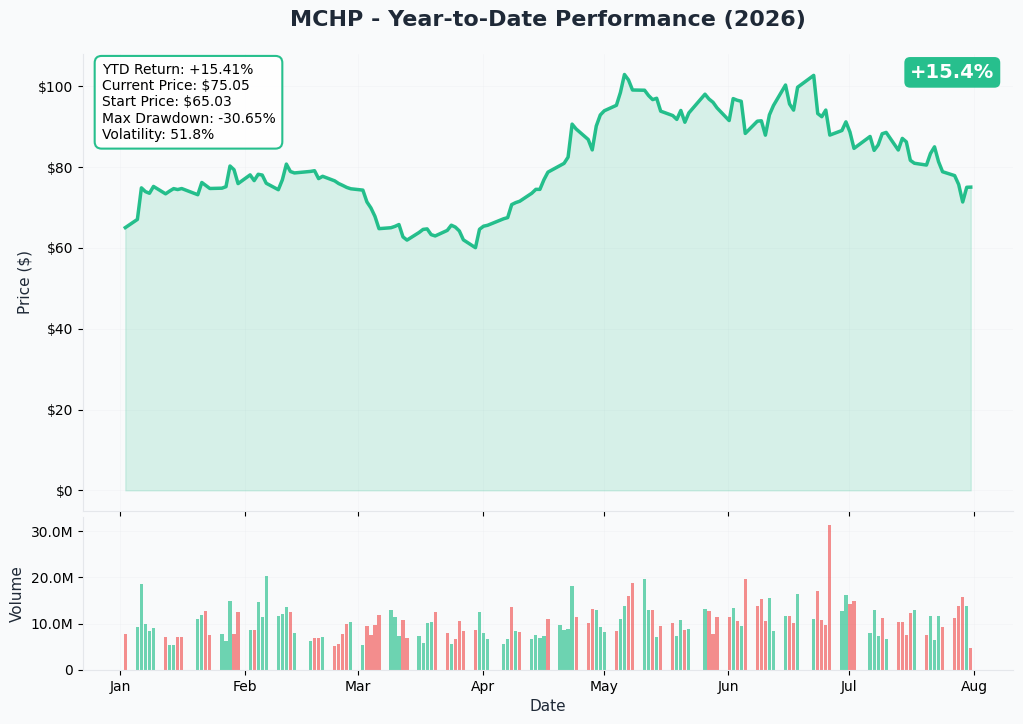
MCHP is still up sharply from where it started the year despite the recent carnage — the chart tells a boom-bust-recovery-attempt story: a strong rally into the June 22 close of $104.03 on the back of a blowout Q4 FY2026 earnings beat, then a brutal ≈28% de-rating over five weeks that bottomed at $71.37 on July 29 during a sector-wide chip selloff, followed by a bounce back toward $75 into this trade.
Gamma-Based Support & Resistance Analysis
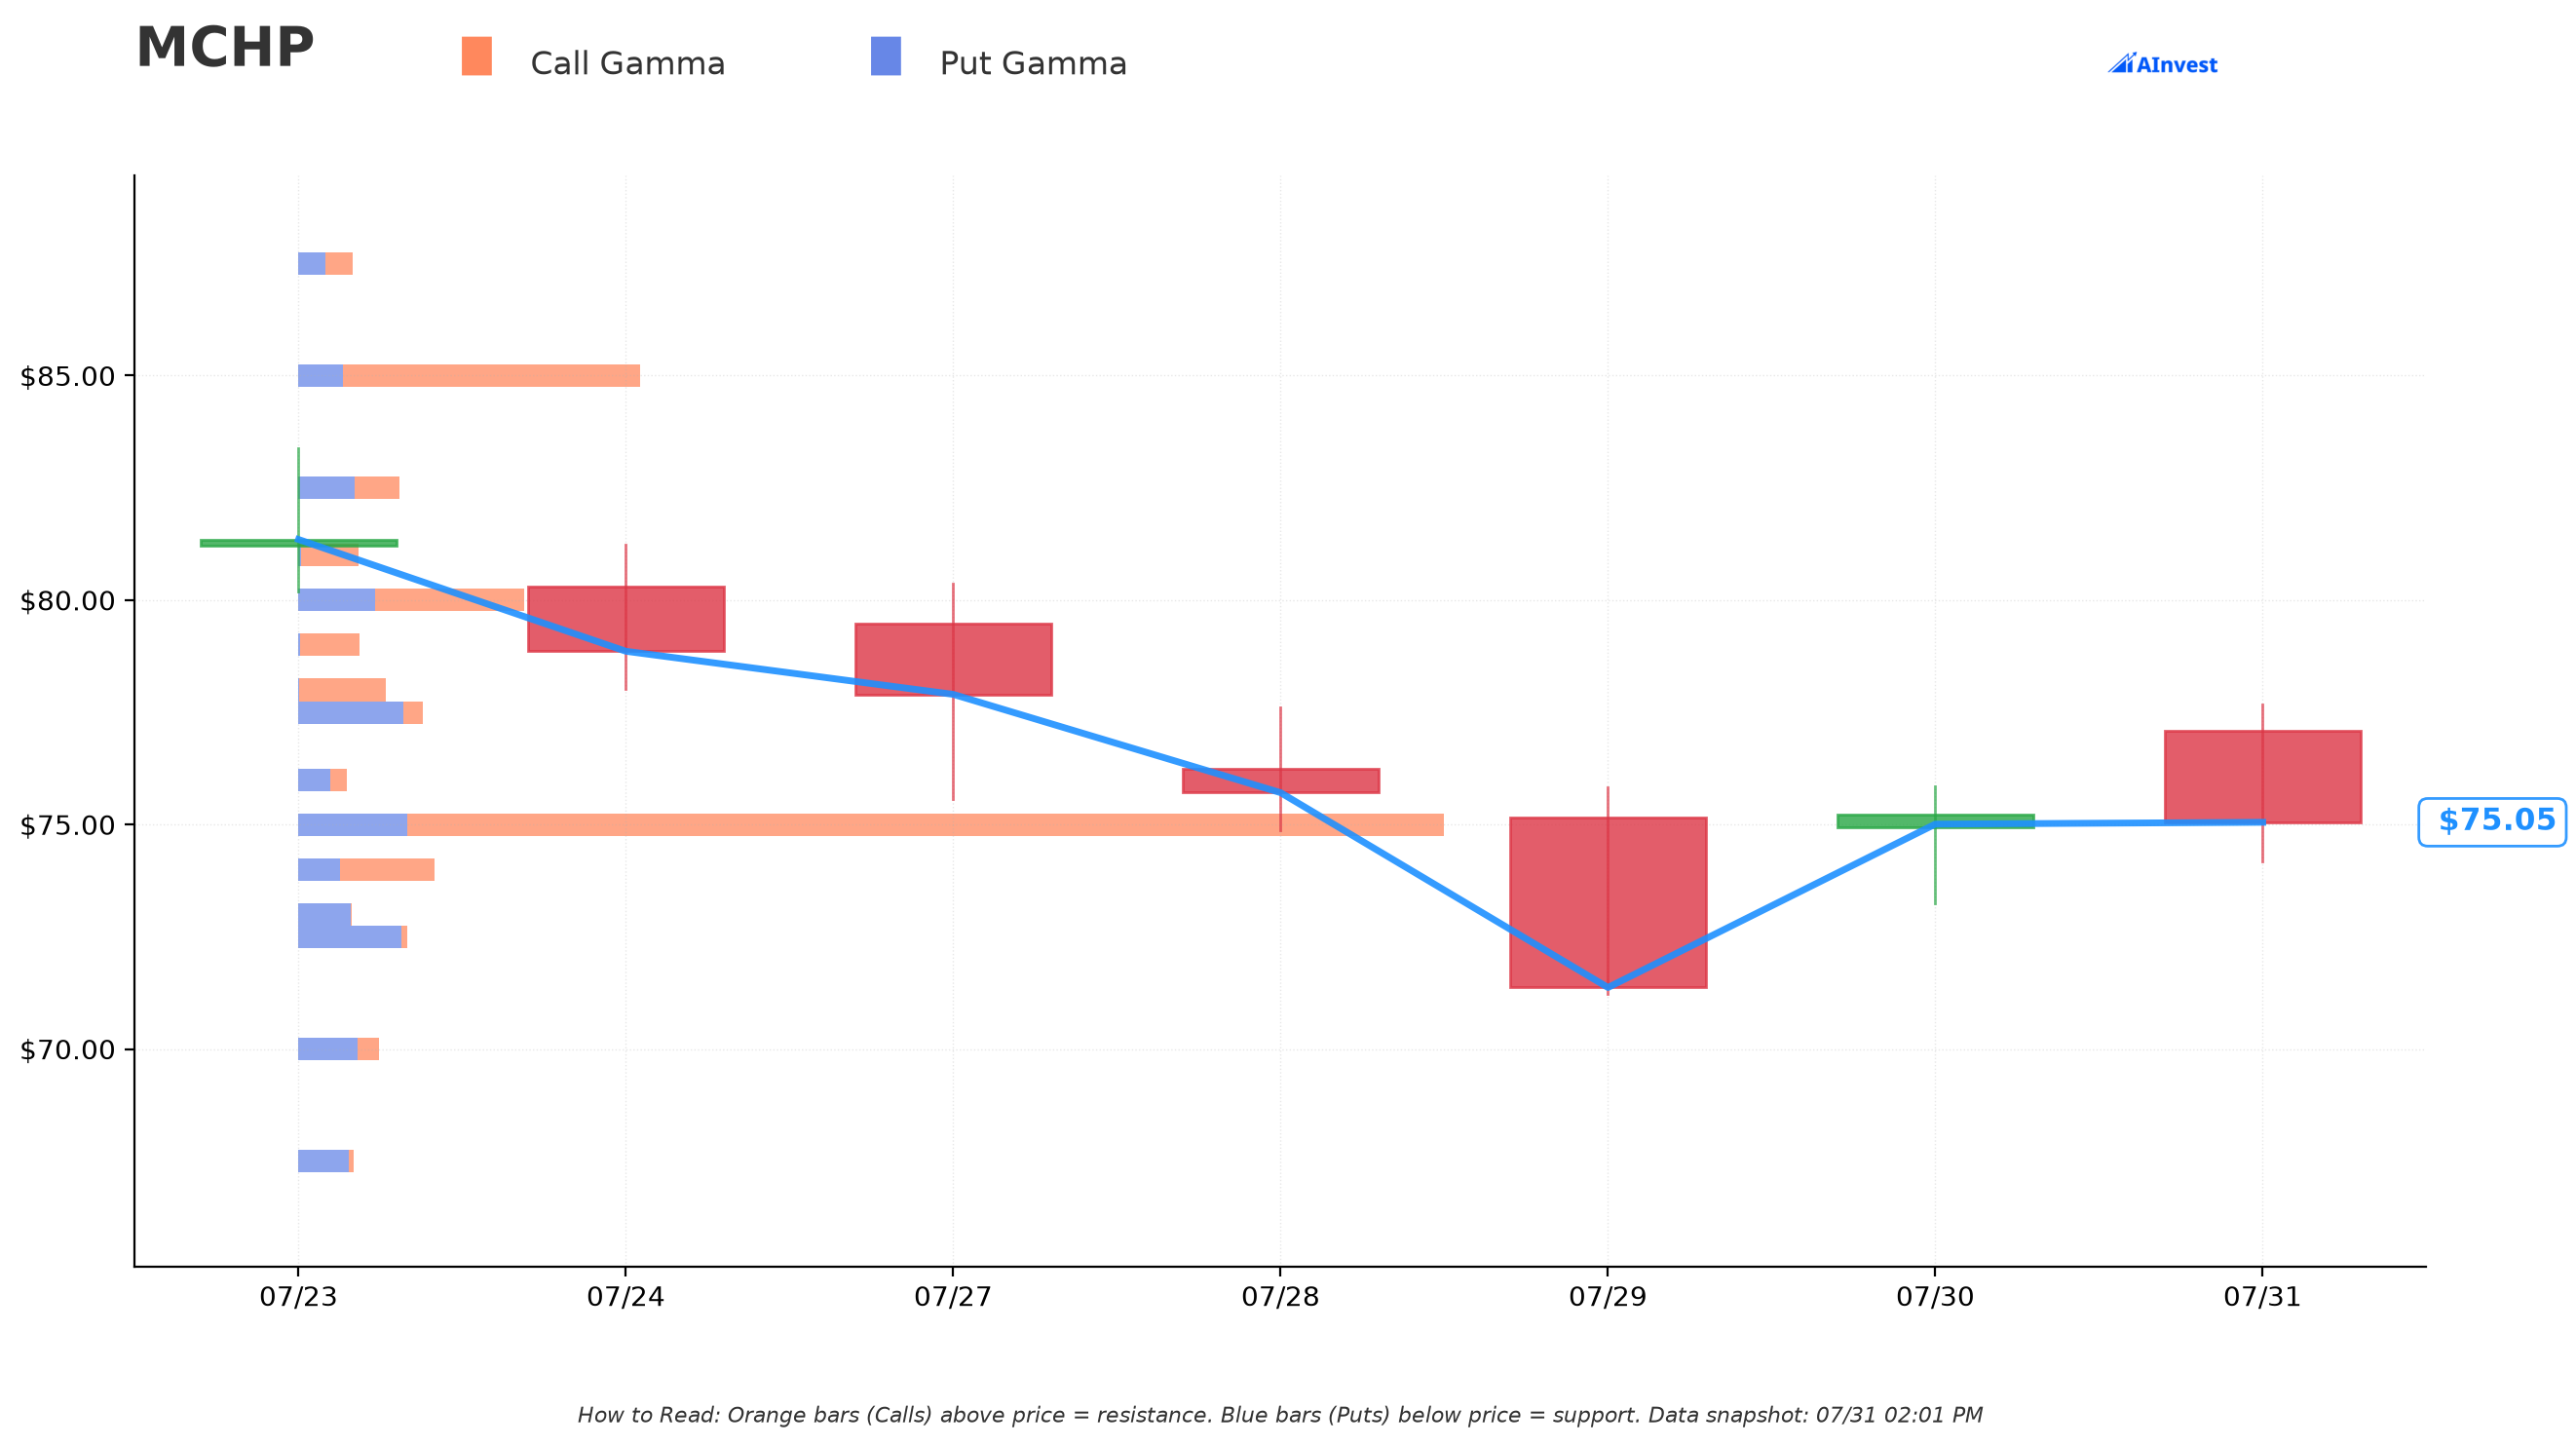
Current price: ≈$75.07
- 🔵 Support wall at $75.00 — "Very Strong," 20.28 total gamma exposure, sitting almost exactly at spot (≈0.1% away). This is the single biggest gravitational point on the board right now — dealers are heavily positioned here and tend to defend it.
- 🟠 Resistance at $80.00 — "Moderate," 4.00 total gamma exposure, ≈6.6% above spot.
- 🟠 Resistance wall at $85.00 — 6.04 total gamma exposure (call gamma 5.26 of that), ≈13.2% above spot. This is exactly the strike the trader just abandoned. With the roll now confirmed, that reads very differently than we first published: the September $85 calls needed the stock to punch through the single heaviest overhead gamma wall on the board, in seven weeks, just to get to the money. Exiting them and moving below spot sidesteps that wall entirely.
What this means for traders: MCHP is currently pinned near its strongest gamma level ($75), with the next real ceiling not until $80 and the big one at $85. After the roll, this position no longer has anything at $85 — the desk moved its exposure from above the heaviest resistance wall to $10.79 below spot, where dealer positioning is not fighting it.
Implied Move Analysis
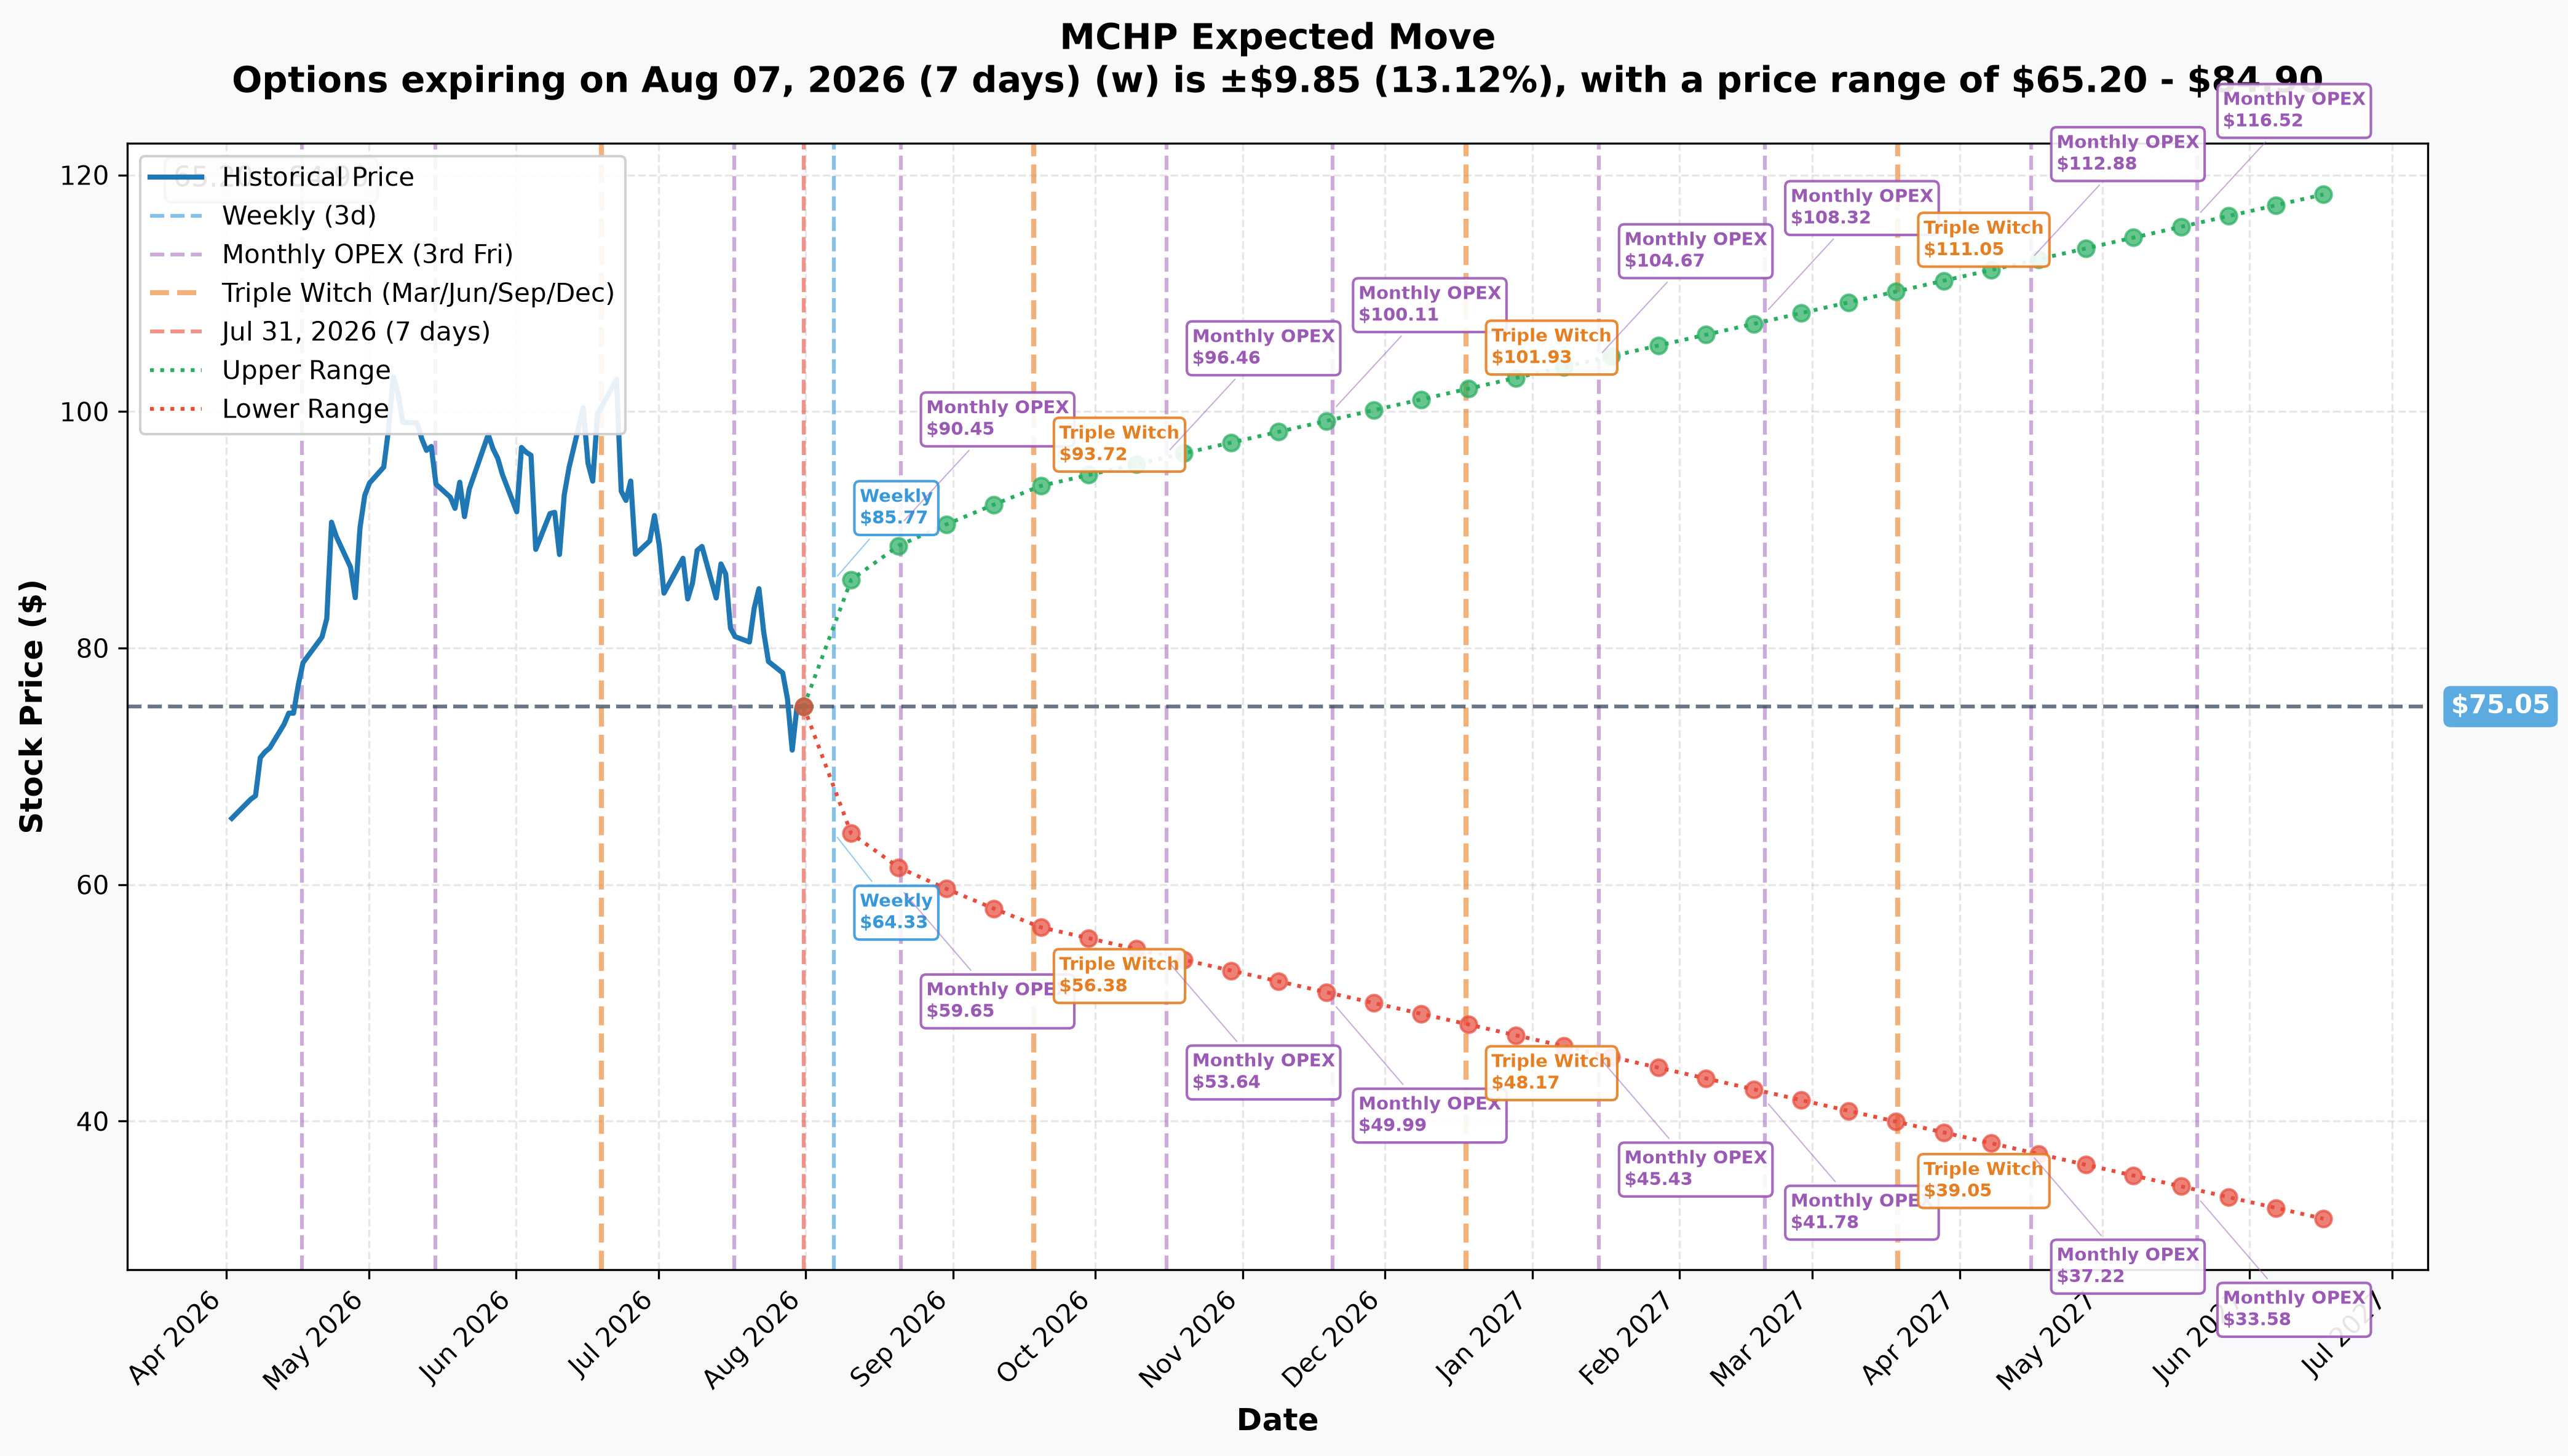
Options pricing tells us how much movement the market expects into each relevant date:
- Weekly (Aug 7, 7 days): ±13.1% / ±$9.85 → range $65.20 – $84.90
- Monthly OPEX (Aug 21, 21 days): ±18.5% / ±$13.89 → range $61.16 – $88.94
- Quarterly Triple Witch (Sep 18, 49 days — matches the SHORT leg's expiration): ±24.8% / ±$18.58 → range $56.47 – $93.63
- December Triple Witch (Dec 18, 140 days — matches the LONG leg's expiration): upper $101.93, lower $48.17
Translation: the options market is already pricing a wide two-sided range for MCHP over the life of both legs. Notice the upper end of the September range ($93.63) sits well above the $85 strike this desk just exited — the market itself assigned real odds that those calls could have come into the money, and they sold anyway. That is a meaningful signal about how they weighed a fast rally versus a durable one. And the December range's upper bound ($101.93) is close to the June high ($104.03) — the market is pricing in the possibility of a full retrace, which is the scenario that makes the long $65 call very profitable.
🎪 Catalysts
🔥 Already Happened (Last 3 Months)
Q4 FY2026 earnings beat — May 7, 2026 (Confirmed). Non-GAAP EPS $0.57 vs. ≈$0.50-0.51 consensus, revenue $1,311.2M vs. ≈$1.26B, +35.1% YoY — a clean beat that triggered a wave of target raises (KeyBanc to $135, Needham to $120, Rosenblatt to $120), per Benzinga. The stock rallied into the June 22 high.
Bookings inflection — the core bull case. On the Q4 FY2026 earnings call, management said March book-to-bill was "well above one," April was the largest booking month in nearly four years, and the September-quarter backlog is already above where June's backlog stood at the same point in time. Inventory fell to 185 days (from 201), with distributor inventory at a historically low 26 days.
Texas Instruments' July 21 read-through. TI reported Q2 2026 revenue of $5.46B, +23% YoY, with industrial up ≈30% YoY and its first analog price increases in years, per Digitimes. This is a direct positive signal for MCHP's own industrial and automotive exposure.
The ≈28% drawdown from the June 22 high ($104.03) to the July 29 low ($71.37). QuiverQuant attributes this to a "broader selloff in analog and industrial semiconductor names" rather than any company-specific setback — chips lost more than $1 trillion in market cap in late July on fears that AI infrastructure spending may be peaking, per CNBC.
Two July target cuts against stale May-vintage targets. TD Cowen cut to $90 (Hold) on July 13, and Wells Fargo cut to $88 (Equal Weight) on July 20 — both citing valuation/margin concerns rather than a demand break, per MarketBeat. Meanwhile the May 8 targets of $120–$135 from KeyBanc, Needham and Rosenblatt have not been marked down, leaving a wide $69–$135 spread on the street.
Hailo acquisition signed — July 24, 2026. MCHP signed a definitive agreement to acquire Hailo, an Israeli edge-AI chip designer with over 100 customers and 10,000+ developers, per the company release. Terms undisclosed; management says it's not expected to materially impact financials. Expected to close "towards the end of the current quarter ending September 30, 2026."
🔮 Ahead (Next 6 Months) — mapped to each expiry
🎯 Fiscal Q1 2027 earnings — expected Thursday, August 6, 2026, after the close. ⚠️ This is EXPECTED, not company-confirmed — MarketBeat's July 30 alert and StockAnalysis both list Aug 6, matching MCHP's historical first-Thursday-of-the-month pattern, but Public.com shows Aug 4 and NextEarningsDate carries a "projected" Aug 10. No company press release confirming the date existed as of July 31. Company guide: $1.442–1.469B revenue, $0.67–0.71 non-GAAP EPS; street ≈$0.70 on ≈$1.4585B. This date falls inside both the Sep-18 and Dec-18 expiries.
📌 The September 18, 2026 expiry — the one this desk rolled OUT of — captures exactly ONE earnings event, the Aug 6 print, and nothing else major. It was a single-catalyst contract: get through Aug 6, ride ≈6 weeks of drift, and it's done. Trading it away for December is precisely a bet that one catalyst is not enough time for this recovery to show up. The MASTERs Conference (Aug 10-13, Phoenix, Sanghi keynote) also falls inside this window, four days after earnings — historically a product/roadmap event, not a financial one.
📌 The December 18, 2026 expiry (long leg) captures TWO earnings events — the ≈Aug 6 print AND the expected fiscal Q2 2027 print around ≈November 5, 2026 (modeled from the November 6, 2025 precedent) — plus the Hailo acquisition close, expected "towards the end of the quarter ending September 30, 2026," which lands after the Sep-18 expiry but comfortably inside the Dec-18 one. That's why the long leg is structurally a cycle-recovery bet, not a single-event bet: it has more time to be right, and more catalysts to be right about.
🌏 China regulatory tail — unscheduled, undated. China is 18% of MCHP's net sales, and the company's FY2026 10-K names an active Chinese investigation into U.S. analog semiconductors as a live risk. No decision date — treat as a binary tail risk that could hit either expiry.
🎲 Four Ways to Read This Trade
🚀 YOLO Trader
Corrected August 3: with the roll confirmed, the institution's own position is the outright play — a naked long Dec $65 call, no cap, no offsetting short. There's no cheaper "spread version" to copy anymore, because there was never a spread. If you want max leverage on the same "the drawdown is overdone" thesis, buying that same call is exactly what they did — you'd just be paying the full $18.10 in fresh cash where they funded $4.18M of it by liquidating an older position. The genuinely higher-octane alternative is the strike they abandoned: a September $85 call at $3.80 is far cheaper and far more explosive, but it needs a ≈12% rally through the heaviest gamma wall on the board in seven weeks — and a desk with real size just decided that bet wasn't worth holding. Think hard before taking the side they exited.
📊 Swing Trader
Corrected August 3 — the shadow trade is one leg, not two. The 5-to-7 week window into the Aug 6 print and the $75 gamma support wall right under spot still make this a clean setup to shadow with smaller size, but what you'd be shadowing is a long Dec $65 call, outright — there is no short leg to replicate. If MCHP holds the $75 gamma floor into earnings and beats, the position gains roughly dollar-for-dollar with the stock above $65 (≈0.78 delta), with no $85 ceiling clipping the move. The flip side is that you now have no cushion: the $3.80 we originally described as offsetting a decline doesn't exist in this structure. Below ≈$79.30 at December expiry the position loses, and below $65 it goes to zero. Size accordingly, and set your reassessment date at the Aug 6 print rather than the September expiry — with the September leg gone, that date no longer means anything to this position.
💰 Premium Collector
⚠️ Corrected August 3 — this is no longer your trade. We originally wrote that "the mechanics ARE premium collection." The OI check proved otherwise: nothing was sold to open, so no premium was collected at all. The $3.80 per contract was liquidation value on calls the trader already owned, not income.
There is still a lesson here for you, though, and it's a useful one: this desk did the opposite of what a premium collector does, and did it deliberately. They gave up a position whose entire remaining value was time premium ($3.80 of pure extrinsic, zero intrinsic) and bought one that is ≈60% intrinsic. A premium seller monetizes time decay; this trader just paid $7.31 per contract of time premium to own it. If you want the covered-call-style income version of this idea, the structure you'd build is the one we mistakenly described — long the Dec $65 call, short a new Sep or Oct call above spot — but understand you'd be taking the opposite side of this desk's conviction, not shadowing it.
🌱 Beginner
Corrected August 3. Think of it like this: this trader was holding a cheap option to buy a house at $85 that expires in seven weeks, while the house was only worth $75.79. For that to pay off, the neighborhood had to boom fast. Instead of waiting and hoping, they sold that option for what they could get ($3.80) and used the money — plus $15.73M more — to buy a different option, on the same house, at $65, good until December. That second contract is already worth more than nothing the moment they buy it, because the house is worth $10.79 more than the price they locked in.
That's the whole trade: they swapped a cheap ticket that needed a miracle for an expensive one that just needs the house not to fall. They still lose money if MCHP drops below ≈$79.30 by December, and everything below $65 is a total loss — but they no longer need a 12% rally in seven weeks to make anything at all. Nobody is "renting out" anything here, and nothing is capped — that was our original reading, and next-day open interest corrected it.
⚠️ Risk Factors — Read This Before You Copy the Trade
-
This is not proof of anything. A block cross means a broker matched a buyer and a seller who had already agreed on price. It tells us institutional capital committed $15.73M net — it does not tell us who's on the other side, why, or whether they have information we don't. Never blindly follow institutional flow; size any copycat trade to what you can afford to lose entirely.
-
🔄 The September $85 leg was RESOLVED as a close, and it changed the trade. Size (11,000) was below prior OI (20,297) — we flagged it as unproven, and the August 3 OI snapshot came back −7,964, proving a sell-to-close, not a sell-to-open. The "income financing" framing we originally published is retracted: this is a roll, not a diagonal. The net debit is unchanged, but the structure, the tone, and the capped-upside claim all were not. This is the single largest correction in this article — read the 🔄 RESOLVED box above before acting on anything here.
-
Upside is NOT capped — and that cuts both ways. Our published version called capped upside "a real cost, not a footnote." With no short call, there is no cap: a blowout Aug 6 report is fully captured. The honest flip side is that there is also no premium cushion. Every dollar of the $19.91M long-side commitment is exposed to a decline, with nothing collected to offset it.
-
Below $65, the long leg loses real money outright. The breakeven on fresh capital is roughly $65 + $14.30 = ≈$79.30 at December expiration; measured against the gross premium actually paid for the calls now held, it is $65 + $18.10 = ≈$83.10. Below $65 by December the call expires worthless and the entire $19.91M long-side position is lost — with no short-call premium cushioning it, because there is no short call.
-
The equity block "hedge" link is inferred, not proven. The 396,000-share print at $75.60, 73 seconds after the options, is a plausible delta match — but we cannot confirm it was the same order, the same desk, or even the same intent. Treat this as circumstantial, not fact.
-
The Aug 6 earnings date itself is not confirmed by the company. If it slips (to Aug 4 or Aug 10, per conflicting aggregators), the "single-event" framing of the September leg could shift slightly, though it would remain inside the same expiry window either way.
-
Fundamentals vs. tape tension is real risk, not just narrative. Bookings, backlog, and the TI read-through all point up; a 28% drawdown, two July target cuts, stale bull targets, 185-day inventory (vs. a 130-150 target), an active China investigation, and three months of insider selling with zero buying all point to caution. Elevated implied volatility (24.8% into September) reflects that genuine two-sided uncertainty — this is not a low-risk setup in either direction.
-
Position sizing matters more than the trade idea. $15.73M is a number for an institution's book, not a retail account. Scale any version of this down to a size where a full loss on the long-call side wouldn't hurt.
🎯 The Bottom Line
Here's the deal — restated after the August 3 OI correction: an institution added a net $15.73M of fresh cash to roll an existing MCHP call position down and out — liquidating 11,000 September $85 calls it already owned and buying 11,000 deep in-the-money December $65 calls with the proceeds plus more, exactly one week before MCHP's expected August 6 earnings report. Both legs are now confirmed by next-day open interest: the December strike built +11,175 contracts (fresh open), the September strike lost 7,964 (close). There is no short leg and no cap on the upside.
The structure captures a real tension in this name right now: the fundamentals (bookings inflection, backlog strength, the TI read-through, deleveraging) point up, while the tape (≈−28% from June's high, below both moving averages, two July target cuts) points down. This desk had already expressed that view — badly, through a far out-of-the-money short-dated call sitting behind the heaviest gamma wall on the board. What they did on July 31 was cut that expression and replace it with one that survives being early: ≈0.78 delta instead of ≈0.41, December instead of September, two earnings prints instead of one. The long December call now runs free all the way to expiration, through the next report in early November.
The methodological point worth keeping: intraday, this trade was indistinguishable from an income-financed diagonal. Only the next morning's open interest revealed that the sold leg was destroyed rather than created — and that single fact flipped the structure, the tone, the premium framing, and the capped-upside claim. Same prints, same sizes, opposite story.
Mark your calendar:
- 📅 ≈August 6, 2026 (expected) — Fiscal Q1 2027 earnings, the catalyst both legs are exposed to
- 📅 August 10-13, 2026 — MASTERs Conference, Phoenix (confirmed)
- 📅 September 18, 2026 — the expiry this desk rolled out of; no longer relevant to their position
- 📅 ≈September 30, 2026 (expected) — Hailo acquisition close; falls comfortably inside the December leg's life
- 📅 ≈November 5, 2026 (expected) — fiscal Q2 2027 earnings, inside the long leg only
- 📅 December 18, 2026 — long leg expires; captures two full earnings cycles
✅ The next-day OI update is in (August 3 pre-market) and it resolved the September $85 call as a CLOSE, not an open — inverting the structure from a diagonal to a roll. Every affected section above has been corrected and marked.
Disclaimer: Options trading involves substantial risk of loss and is not suitable for all investors. This analysis is for educational purposes only and is not financial advice. The mechanism, sizes and prices above are read directly from the OPRA tape; the motive and hedge linkage are inferred and explicitly marked as such. Never assume institutional flow is informed — it may reflect financing, hedging, or portfolio-management needs unrelated to a directional view on the stock. Always size positions to what you can afford to lose and consider consulting a licensed financial advisor before trading.
Last updated: 2026-08-03 — next-day OPRA open interest INVERTED the September leg: $85 call CLOSE (20,297 → 12,333, −7,964) not a fresh short, making this a bullish call ROLL rather than a diagonal. Dec $65 call OPEN confirmed (50 → 11,225). Title, structure and the capped-upside framing corrected.