🔧 MCHP $63.8M Block Cross: A Roll Down and Out — Confirmed, With a ≈$102.6M Loss Taken to Buy More December
📅 2026-08-04 | 🔥 Unusual Activity Detected ✅ Last updated: 2026-08-05 — the next-day OI snapshot confirmed the roll-close. See the ✅ RESOLVED box below.
🎯 The Quick Take
At 15:19:52 ET, a desk crossed a $63.8M net-debit diagonal in Microchip Technology (MCHP): sold 55,000 September $75 calls ($58.1M) and bought 55,000 December $65 calls ($121.9M) in the same negotiated block. Pulling this position's history off the tape, it read far more like a roll down and out than a fresh trade — and the next-day open-interest snapshot has since confirmed it: open interest at the September strike fell 52,047 contracts, ≈95% of the print, proving the sale closed an existing long rather than opening a new short. The September calls were built in May near MCHP's $99–$106 highs, rode through a ≈28% drawdown to $71.24, and were sold at a realized loss of roughly $102.6M to fund an even bigger add to the December $65s the same desk started buying on July 31 near the recent low. That reads as conviction being extended through a drawdown, not fresh money chasing a new idea. There's also an open-interest discrepancy worth flagging: the September leg's prior open interest is quoted at 7,000 — the real number off the tape is 108,624, more than 15x larger, which is part of why the roll reading held up.
🏢 Company Overview
Microchip Technology develops, manufactures, and sells "smart, connected, and secure embedded control solutions" across the Americas, Europe, and Asia, operating through Semiconductor Products and Technology Licensing segments (stockanalysis.com). It sits in the Technology sector, Semiconductors industry, with a market cap around $43.8B. The stock is up ≈24.1% over the trailing year.
💰 The Trade — Plain English
This wasn't two separate trades. Both legs printed at the exact same millisecond, the same size (55,000 contracts), as a multi-leg block cross — a broker matched a known buyer and seller and printed it off the open order book. That's negotiated position management, not urgent buying or panic selling. Nobody "slammed the offer" here; there's no aggressor signature at all because both legs filled at the mid.
| Leg | Time (ET) | Buy/Sell | Call/Put | Expiration | Premium | Strike | Volume | Prior OI | Size | Spot | Option Price | Option Symbol |
|---|---|---|---|---|---|---|---|---|---|---|---|---|
| 1 | 15:19:52 | BUY | CALL | 2026-12-18 | $121,935,000 | $65 | 55,000 | 11,235 | 55,000 | $80.88 | $22.17 | MCHP20261218C65 |
| 2 | 15:19:52 | SELL | CALL | 2026-09-18 | $58,135,000 | $75 | 55,000 | 108,624 | 55,000 | $80.88 | $10.57 | MCHP20260918C75 |
🤝 Flow tag: BLOCK CROSS (multi-leg) — both legs, one negotiated print.
Net: $63,800,000 debit. Net package delta: ≈+634,150 shares (long leg: 55,000 × 100 × 0.7707 delta = 4,238,850 shares; short leg: 55,000 × 100 × 0.6554 delta = 3,604,700 shares; net = 634,150 shares ≈ $51.3M of stock-equivalent exposure at $80.88).
⚠️ An Open-Interest Figure Worth Correcting
The September $75 call's prior open interest is widely quoted as 7,000. The real number, pulled straight off the OPRA tape, is 108,624 — more than 15 times larger. This isn't a rounding difference, and it isn't cosmetic. At 7,000 prior OI, 55,000 contracts selling would look provably like a fresh short (size far exceeds what already existed) — and that read would have been exactly backwards. At the real number, 108,624, the 55,000-contract sale sits below existing open interest, which forced the trade into the provisional bucket until the next-day snapshot could settle it. It did: open interest fell 52,047, proving a close. So the quoted figure would not merely have been imprecise; it would have produced a confidently stated, wrong conclusion about what this desk was doing. Say this plainly: quoted open-interest figures on option-flow feeds are not reliable, and this is not the only ticker where it was wrong that day (SPY's OI column was off by a factor in the thousands on the same date). Always cross-check against the real tape before trusting a quoted number.
📜 Where This Position Came From — The Roll Evidence
This is the strongest material in this article, and it's the reason the framing above leans toward a roll rather than a fresh diagonal. Both legs of today's cross have a traceable history on the tape.
The September $75 call:
| Date | OI | Note |
|---|---|---|
| May 1, 2026 | 381 | nothing there |
| May 8, 2026 | — | 108,203 contracts traded, weighted $29.225 |
| May 11, 2026 | 108,472 | +108,092 vs. May 1 |
| Aug 4, 2026 (pre-trade) | 108,624 | flat for three months since |
On May 8, the tape shows two prints — 77,250 and 30,750 contracts — both multi-leg floor trades, executed at ≈65% across the bid-ask spread (a buy lean). MCHP closed that day at $99.09, after touching $105.91 intraday — its high for the period.
The December $65 call:
- July 31, 2026: 11,000 contracts traded @ $18.10, a block cross at ≈80% across (a buy lean). Open interest went 40 → 11,225.
- MCHP closed $74.29 that day — two sessions after bottoming at $71.235 on July 29.
And today, with MCHP at $80.88: the desk sells 55,000 of the September $75s at $10.57 and buys 55,000 more December $65s at $22.17 — five times the size of the original July 31 add.
What that means — this looks like a repair, not a victory lap
The September position was built with MCHP trading near $99–$106. The stock then fell to $71.24 — a ≈28% drawdown — and that call went from a weighted $29.225 down to $10.57. Today, with the stock having recovered to $80.88, the desk is selling roughly half that September position and rolling into a deeper in-the-money December strike with three more months of time.
If the September leg is a close — the stronger read — the realized loss is ($29.225 − $10.57) × 55,000 × 100 ≈ $102,602,500, or roughly $102.6M. That number is the whole story here. Meanwhile, the desk is adding to the December $65 position it started on July 31 at $18.10 (now $22.17, up ≈22%) — buying five times the original size.
Put together: a desk that got long Microchip near the highs, sat through a ≈28% drawdown, and is now rolling down and out — accepting a large realized loss to buy more delta (0.6554 → 0.7707 per contract) and three more months for the original thesis to work out. That's conviction being extended through pain, not a new idea showing up. (For contrast, today's flow in GOOGL used a similar roll mechanic on a winning position rolled up — same playbook, opposite circumstances.)
How confident are we in this reading?
Be precise about what's proven and what's inferred:
- Proven: the OI build at $75 (381 → 108,472 between May 1 and May 11) happened on May 8, on two multi-leg floor prints, at a buy-leaning ≈65%-across price.
- Inferred, not proven: that this means the desk was long those calls since May. The May 8 prints were multi-leg floor trades, meaning the September $75 call was one leg of a larger package — and per-leg aggressor readings are unreliable on multi-leg combos (the exchange allocates the net aggressor flag across legs, not per strike). "They were long from May" is an inference built from the ≈65%-across lean plus the open-interest build lining up with the trade date — a reasonable inference, but not a fact pulled straight off the tape the way the cross mechanism or the OI numbers are.
- The alternative — that the desk was actually short the September $75 calls from May and is adding to a winning short position today — can't be fully ruled out on the May 8 tape alone. But it sits awkwardly next to today's unambiguous long-side December purchase, which makes a same-desk short-since-May story a harder case to make.
✅ RESOLVED — The Roll Is Confirmed. The ≈$102.6M Loss Was Realized.
Updated 2026-08-05 pre-market. The ≈06:30 ET OPRA open-interest snapshot (reflecting the August 4 close) has published, and it landed on the roll-close outcome — the one the position history pointed to.
| Leg | Baseline OI (Aug-4 snap) | Resolving OI (Aug-5 snap) | Predicted | Δ | Print size | Verdict |
|---|---|---|---|---|---|---|
| Dec-18-2026 $65 C (bought) | 11,235 | 66,239 | ≈66,000 | +55,004 | 55,000 | ✅ OPEN (BTO) — confirmed |
| Sep-18-2026 $75 C (sold) | 108,624 | 56,577 | ≈53,624 | −52,047 | 55,000 | ✅ CLOSE (STC) — roll confirmed |
Both predictions landed. The December $65 call opened almost exactly one-for-one — 55,004 new contracts against a 55,000-contract print, against a predicted ≈66,000 and an actual 66,239. And the September $75 call fell 52,047 contracts, ≈95% of the print, against a predicted ≈53,624 and an actual 56,577.
The alternative is now dead. "A fresh new short" would have required open interest at the September strike to rise toward ≈163,624. It fell by more than 52,000 instead. There is no reading of that number other than a large existing long position being closed out.
Which means the number in the headline is real. The September $75 calls were bought in May at a weighted $29.225 and sold on August 4 at $10.57. With the close now proven rather than inferred, the realized loss is ($29.225 − $10.57) × 55,000 × 100 ≈ $102,602,500. This desk took a nine-figure loss on the September leg to fund five times its original size in deeper in-the-money December calls.
One inference remains an inference. The OI record proves the September sale closed a long position. It does not prove that the same desk was the one who built that position in May — that still rests on the May 8 open-interest build lining up with two buy-leaning multi-leg floor prints, and per-leg aggressor reads on combos are unreliable. The roll mechanics are confirmed; the continuity of the actor behind them remains a strong, well-evidenced inference rather than a tape-proven fact.
🤓 What This Actually Means — Plain English
The mechanism first. This is a block cross, not a sweep. Think of it as two parties who already agreed on a price sitting down and having a broker print the whole thing at once, off the public order book. There's a known counterparty on the other side. That means there's no "buying pressure" signal here the way there would be if someone hit the lit market and drove the price up — both legs filled right around the mid.
The structure: a diagonal call spread. They bought the lower strike ($65) expiring later (December) and sold the higher strike ($75) expiring sooner (September). That's a textbook diagonal. Here's the shape:
- The December $65 call is deep in the money — $15.88 of that $22.17 price is pure intrinsic value (what it'd be worth if exercised today), and only ≈$6.29 is time value. Buying a call this deep in the money behaves a lot like buying the stock itself: it moves almost dollar-for-dollar with MCHP (0.77 delta), but it costs $22.17 a share instead of $80.88, and the most you can lose is what you paid. That's the appeal — stock-like upside exposure, capped downside, less capital tied up.
- The September $75 call being sold is also in the money ($5.88 intrinsic, ≈$4.69 time value) and brings in $58.1M, financing more than half the cost of the December calls.
Why the open/close question mattered so much here — and how it resolved. There were two honest readings on trade day. The next-day open-interest snapshot settled it in favor of the first:
- Reading B — a roll down and out. ✅ CONFIRMED. The September $75 calls were built in May near MCHP's $99–$106 highs, rode a ≈28% drawdown down to $71.24, and were sold — closing that position, now proven by open interest falling 52,047 contracts — to fund a bigger add to the deeper in-the-money December $65 calls the same desk started on July 31. That picks up more delta per contract (0.6554 → 0.7707) and three extra months of time, while realizing a loss of roughly $102.6M on the September side. Note this isn't the standard "roll up and out" pattern (selling a lower strike, buying a higher one) — here the move is to a lower, more deeply in-the-money strike while extending duration, which reads as doubling down on the original bullish thesis rather than a defensive retreat.
- Reading A — a fresh diagonal. ❌ RULED OUT. A newly opened short September call would have driven open interest at that strike up toward ≈163,624. It fell to 56,577 instead. This reading is now excluded by the data, not merely disfavored by it.
By house convention, when the sold leg's size sits at or below its prior open interest — 55,000 against 108,624 here — the default lean is already toward the position being closed. The position history made that lean stronger than a coin flip, and the open-interest print has now converted it from inference to fact. What is still inference: that the same desk built the May position and unwound it here. The roll mechanics are proven; the continuity of the actor rests on a ≈65%-across buy lean on multi-leg floor prints, where per-leg aggressor reads are unreliable.
One more thing worth noting: MCHP's September $75 strike happens to sit almost exactly on the single strongest gamma wall on the whole chain (more on that below) — which lines up with the 108,624 contracts of pre-existing open interest built there back in May. That open-interest discrepancy and the size of that gamma wall are two views of the same underlying position.
📈 Technical Setup / Chart Check-Up
YTD Chart
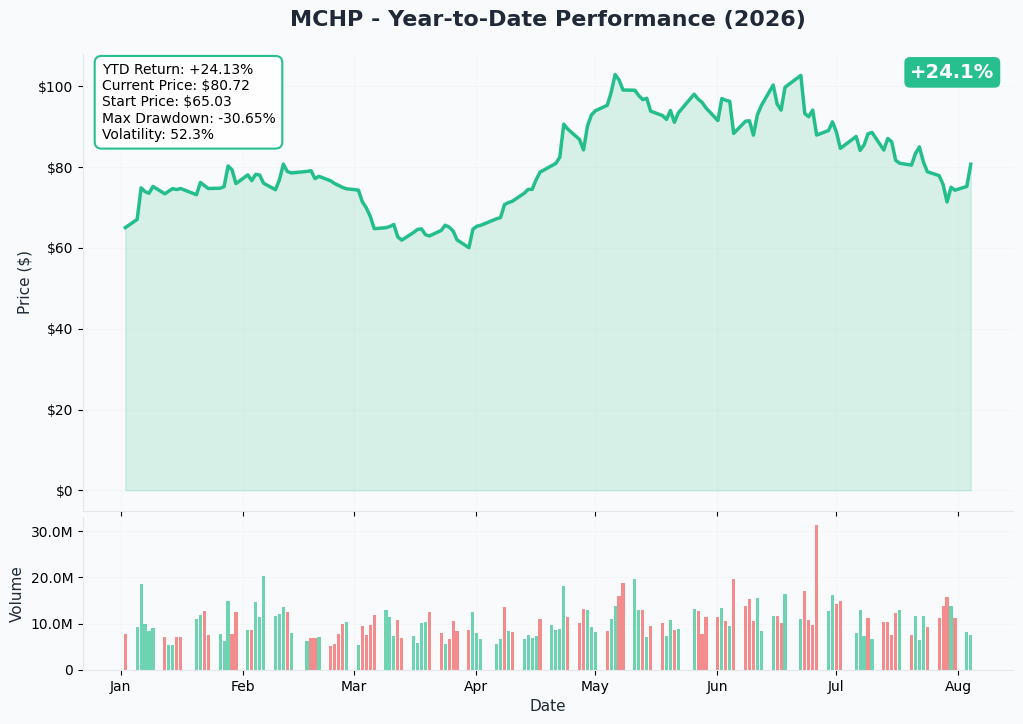
MCHP is up ≈24.1% over the trailing year — a steady grind higher, not a spike. This trade sits well above where the stock started the year, so both legs are working with intrinsic value baked in from the run already, not betting on a move from a depressed base.
Gamma-Based Support & Resistance
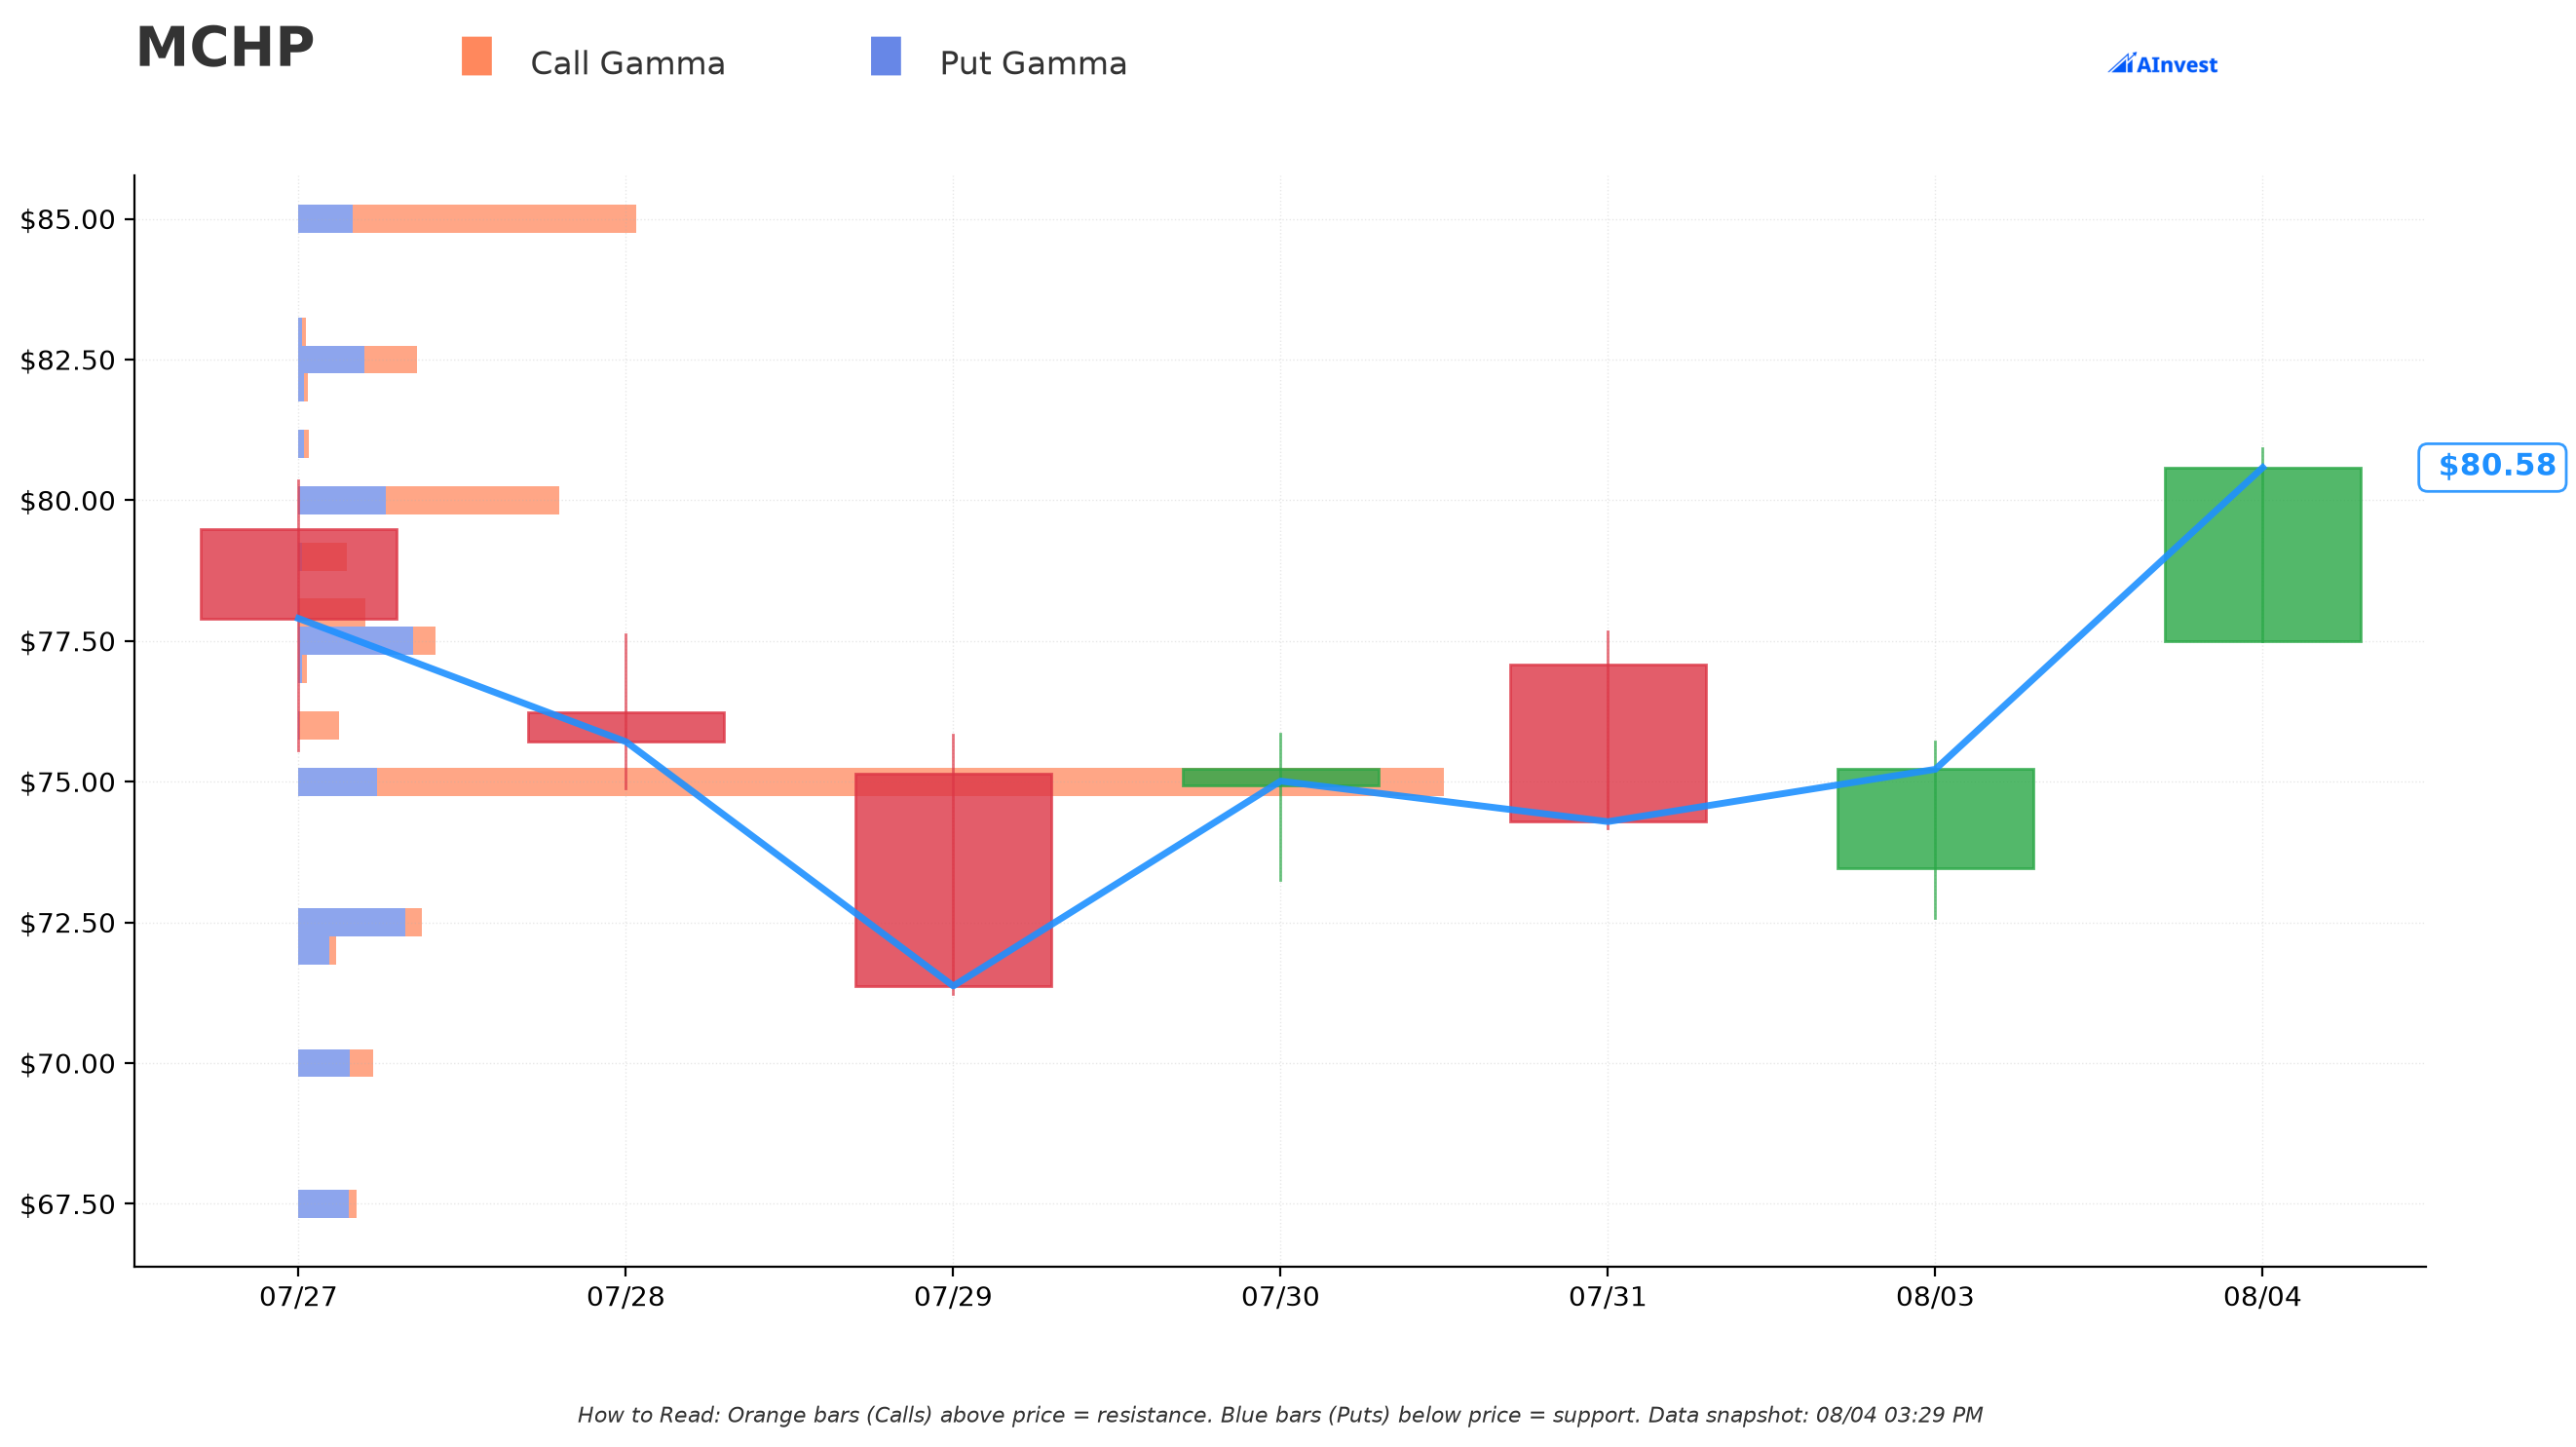
Reading gamma levels in plain terms: 🔵 blue zones are where put positioning tends to cushion the stock (support), 🟠 orange zones are where call positioning tends to cap it (resistance), and bigger bars mean a stronger level. With MCHP at $80.59 in this snapshot:
- $75 — Very Strong support wall. Total gamma exposure of 17.85 (in millions, dealer-scale units), and it's overwhelmingly call-driven (call gamma 16.61 vs put gamma 1.24). This is almost certainly the same 108,624 contracts of open interest sitting at the $75 strike from before this trade — it's the single strongest level on the board, only ≈6.9% below spot.
- $80 — Moderate support, essentially at-the-money (total gamma 4.09, split fairly evenly between calls and puts).
- $85 — Strong resistance wall, total gamma 5.31, ≈5.5% above spot, again mostly call-driven (call gamma 4.46 vs put gamma 0.85).
The bought December $65 strike sits well below all of this ($65 shows only modest total gamma of 1.52 on the chain), so it's not fighting a dealer-hedging wall the way the sold $75 leg is — it's simply riding the stock. The sold $75 leg, by contrast, sits right at the market's biggest gravitational point.
Implied Move
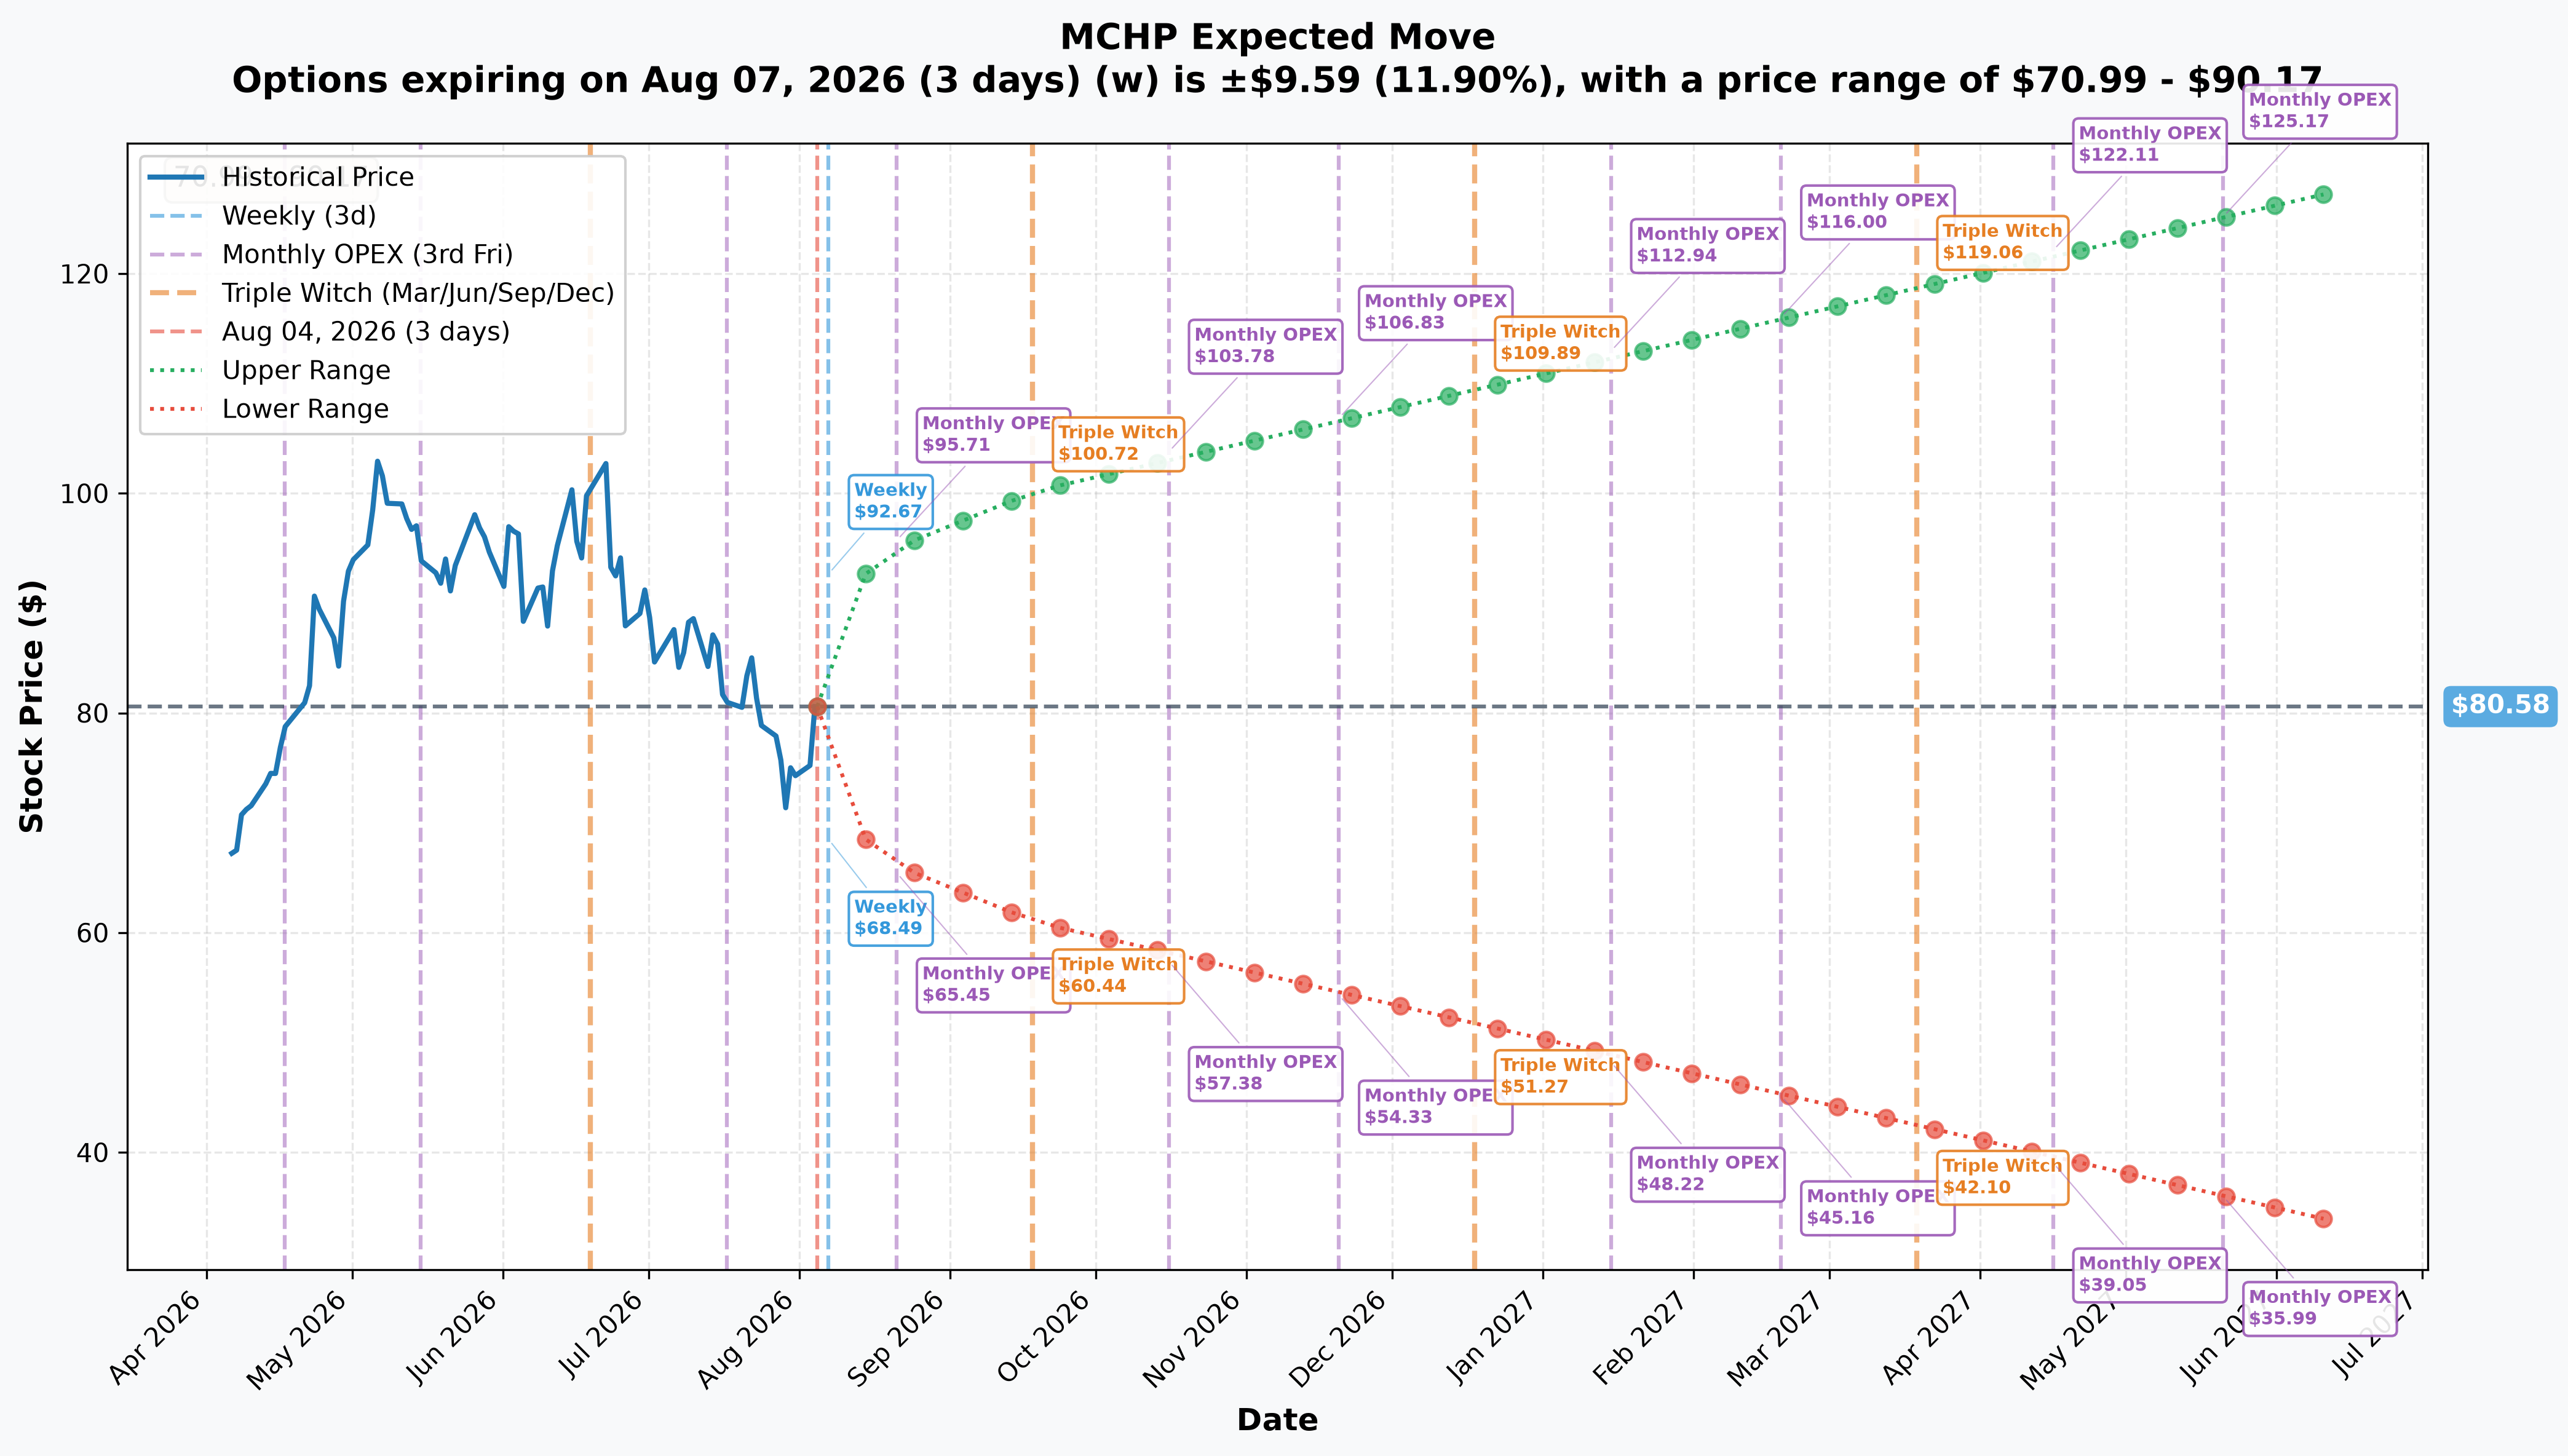
Quote-midpoint implied volatility pricing gives us a cone of expected price ranges (from MCHP_implied_move.json), and two of the horizons line up almost exactly with this trade's own legs:
| Horizon | Expiry | Days | Implied Move | Range |
|---|---|---|---|---|
| Weekly | 2026-08-07 | 3 | ±11.9% ($9.59) | $70.99 – $90.17 |
| Monthly OPEX | 2026-08-21 | 17 | ±18.11% ($14.59) | $65.99 – $95.17 |
| Quarterly (= short leg's own expiration) | 2026-09-18 | 45 | ±24.36% ($19.63) | $60.95 – $100.21 |
| Yearly LEAPS | 2027-06-17 | 317 | ±58.74% ($47.34) | $33.24 – $127.92 |
The weekly implied move is an unusually wide 11.9% for just 3 days — that's the options market pricing in the August 6 earnings report, which lands squarely inside this window. By the September 18 expiration (the short leg's own expiry, pulled from MCHP_implied_move.json OPEX labels), the market's pricing a $60.95–$100.21 range — the sold $75 strike sits comfortably inside that band, not near either edge, meaning there's real two-way risk on that short call between now and its expiration. For the long leg's own expiration (December 18, 2026), the chart's OPEX labels put the range at roughly $51.27–$109.89 — the bought $65 strike sits well above the low end of that range, meaning the December calls would need a genuinely large drawdown to lose their intrinsic value entirely.
🎪 Catalysts
📅 Upcoming
- August 6, 2026 — Q1 FY2027 earnings (ESTIMATED, not yet company-confirmed). MarketBeat notes Microchip "has not confirmed its next earnings publication date," but based on last year's reporting cadence the estimated date is Thursday, August 6, 2026, after market close with a conference call at 5:00 PM ET. This falls inside the weekly options window on this trade and squares with the unusually wide 11.9% weekly implied move above.
- September 30, 2026 — expected close of the Hailo acquisition. Announced July 24, 2026, Microchip is acquiring edge-AI processor maker Hailo, adding the Hailo-8/10/15 product lines, over 100 existing customers, and a developer community exceeding 10,000 users, to expand into edge AI and vision processing for robotics, drones, smart cameras, and industrial automation. Microchip said the deal "is not expected to have a material impact on its financial results." (stocktitan.net)
📅 Recent / Past
- August 4, 2026 (same day as this trade) — Microchip and Micron announced a collaboration on a high-performance PCIe Gen 6 storage architecture aimed at AI and data-center use cases. (stocktitan.net)
- July 24, 2026 — Hailo acquisition agreement signed (see above).
- July 16, 2026 — Introduced the PD-9601GCI, an industrial Power over Ethernet solution delivering 90W of power alongside 10/100/1000 Mbps data. (stocktitan.net)
- July 14, 2026 — Launched VectorBlox 3.0 Accelerator SDK for neural network implementation on FPGA platforms. (stocktitan.net)
🎲 Price Targets & Probabilities
Using the gamma walls and implied-move ranges together:
- Bull case ($85+): the $85 strong resistance wall is the first real ceiling, ≈5.5% above spot — inside the monthly OPEX implied-move range, so it's a realistic near-term target, not a stretch.
- Base case (≈$75–$81): price has spent time gravitating around the $75 support wall and current spot; this is the zone with the heaviest options positioning on the board (108,624 contracts of prior OI at $75 alone).
- Bear case ($75 and below): the $75 level is also the strongest support wall (total gamma 17.85, very strong) — a break below it would be notable given how much dealer hedging is anchored there. The September quarterly implied-move floor sits at $60.95, which is where a genuinely bad earnings reaction could take this if the market's pricing is right.
These are dealer-positioning and options-pricing zones, not certainties — earnings on August 6 (estimated) can reprice all of this within days.
💡 Trading Ideas
🛡️ Conservative — Sleep Well Strategy: Skip trying to mirror an institutional diagonal. If you want the earnings exposure without leverage, a small starter position in the stock itself, sized so a 10-15% earnings gap doesn't hurt, captures the same directional idea this trade implies without any of the open/close ambiguity.
⚖️ Balanced — Defined-Risk Diagonal, Smaller Size: A retail-sized version of the same idea — buy a longer-dated, moderately in-the-money call (e.g., a December or January expiration, strike below spot) and sell a shorter-dated, closer-to-the-money call against it (e.g., an August or September expiration near $85) to reduce cost basis. This caps risk to the net debit paid and mirrors the structure without needing $63.8M.
🚀 Aggressive — YOLO With Training Wheels: A single longer-dated, deep in-the-money call (similar shape to the December $65 leg here) gives stock-like upside participation with defined risk — the loss is capped at the premium paid, unlike outright stock on margin. This is still a real bet on direction into an earnings event; size it like one.
None of these are recommendations to copy this specific trade. And note what the resolved open interest tells you about copying it: the institution was closing the September leg, so mirroring "sell the September $75 call" would put you into a fresh short position that the desk here was busy exiting — the opposite side of what actually happened.
👥 How Different Traders Might Read This
🎰 YOLO Trader: The headline $63.8M net debit and +634,150 shares of delta look like a fresh, aggressive bet — but the position history says this is more likely an existing bullish position being defended through a ≈28% drawdown than new conviction showing up out of nowhere. Copying the "buy deep ITM calls" half of the structure is fine as its own idea; just don't mistake this for a fresh signal.
📊 Swing Trader: The gamma walls give you actionable levels — $75 as strong support (also right where the May position was built), $85 as resistance, both inside the monthly implied-move range. One update worth acting on: with the September $75 strike's open interest down 52,047 contracts, that "very strong" support wall is materially thinner than the pre-trade snapshot showed, so don't lean on it as hard into the August 6 estimated earnings date. The earnings print is the real catalyst to plan around this week, not the cross itself.
💰 Premium Collector: The confirmed roll-close means this is not a new short-vol position at all — it's an existing long being taken off, at a loss, to fund a different long. Nobody sold fresh calls into MCHP's earnings here, so there's no premium-selling precedent to draw from this print. The one transferable lesson: had the September leg opened fresh, it would have been someone shorting resistance-adjacent calls into a 24% quarterly implied move — and the only way to tell those two apart was the next-day open-interest number, not the trade print.
🔰 Beginner: A "diagonal call spread" just means buying one call and selling another call on the same stock, at different strikes and different expiration dates. The deep in-the-money call they bought (December $65) behaves a lot like owning the stock — it moves nearly dollar-for-dollar with MCHP — but costs less upfront and can't lose more than what was paid for it. That's a useful shape to know even outside this specific trade.
⚠️ Honest Risk & Limits — What the Tape Cannot Prove
Be clear-eyed about what this analysis can and can't tell you:
- Open vs. close on the September leg is now PROVEN — it closed. Size (55,000) sat below real prior OI (108,624), so the trade-day tape could not settle it. The 2026-08-05 OPRA open-interest snapshot did: OI fell 52,047 contracts, ≈95% of the print. The roll-close reading and the ≈$102.6M realized loss are confirmed. What remains inference is only whose position it was — the May-to-August continuity rests on a ≈65%-across buy lean on multi-leg floor prints, where per-leg aggressor reads are unreliable.
- We don't know the counterparty's identity, broker, or order ID. OPRA data never reveals who's on either side of a cross.
- We don't know if either party has a pre-existing position we can't see — this could be a hedge against stock, futures, or another options position entirely invisible to the option tape.
- Both legs filled at the mid with no aggressor signature, so there's no IV-change or NBBO-lean evidence to lean on here — that tool only works for trades that take liquidity, and a negotiated cross by definition doesn't.
- A big cross is not proof of conviction. $63.8M changing hands between two parties who already agreed on price is deliberate position management — read it as a data point, not a signal to follow blindly.
🎯 The Bottom Line
Real talk: the headline number is $63.8M net debit, but the real story is a desk defending a position through pain. The evidence — May's open-interest build near $99–$106, the ≈28% drawdown to $71.24, and the August 4 sale of September $75 calls at a weighted loss to fund a bigger deep-in-the-money December buy — pointed toward a roll down and out rather than a fresh bullish idea, and the next-day open-interest print confirmed it: OI at the September strike fell 52,047 contracts. The desk realized roughly $102.6M in losses to keep the original thesis alive with more delta and more time. The December $65 call purchase is proven new (OI +55,004 on a 55,000-lot). The one piece still resting on inference is whether the same desk owned the May position — that comes from multi-leg floor prints where per-leg aggressor reads aren't reliable. And the widely quoted open interest on the September leg was wrong by a factor of more than 15, which is part of what made the roll story visible in the first place.
Own it: if you're already bullish on MCHP into earnings, the gamma and implied-move levels here ($75 support, $85 resistance, $60.95–$100.21 by September) are useful regardless of how you read the flow.
Watching: the September $75 strike just shed more than 52,000 contracts of open interest — that's a meaningful chunk of the gamma wall discussed above coming off the board, and it's worth re-checking how that level behaves into the August 6 earnings print now that the positioning behind it has thinned.
Bearish: a roll through a large realized loss is not the same as fresh conviction, and it doesn't erase the fact that this desk sat through a ≈28% drawdown on the earlier position; earnings on August 6 (estimated) can add another leg to that story in either direction.
The lesson worth keeping: a big headline premium number can hide a repair job as easily as a fresh bet, and a quoted open-interest figure is not something to trust without checking the tape.
This article is for informational purposes only and does not constitute financial advice. Options trading involves substantial risk of loss and is not suitable for all investors. Past performance and options flow data do not guarantee future results. Always do your own research and consider consulting a licensed financial advisor before trading.