🐋 META $19.4M in Long-Dated Calls — One Opened, One Turned Out to Be a Short Being Covered
📅 2026-08-04 | 🔥 Unusual Activity Detected 🔄 Last updated: 2026-08-05 — the next-day OI snapshot inverted the read on the Jan-2028 $1,000 leg. See the ✅ RESOLVED box below.
🎯 The Quick Take
Two unrelated block trades hit Meta Platforms (META) about 16 minutes apart on 2026-08-04 — $11.4M into January 2027 $700 calls at 12:44 ET, then $8.0M into January 2028 $1,000 calls at 13:00 ET, a combined $19.4M net debit. They are not one structure: different expiries, different sizes, different mechanisms, and only one of them came with a stock hedge.
Both legs printed at sizes below their prior open interest, so neither could be called an opening position on trade day. The next-day open-interest snapshot has now resolved both — and they went in opposite directions. The Jan-2027 $700 call opened, though only about a third of it created new contracts. The Jan-2028 $1,000 call did not open at all: open interest fell 1,789 contracts, which means that $8.0M purchase was buying back a short call position, not opening a moonshot long. That inverts the read on the second trade — details in the ✅ RESOLVED box below.
🏢 The Company
Meta Platforms is the parent of Facebook, Instagram, WhatsApp and Messenger, and it's currently pouring enormous sums into AI infrastructure and its Reality Labs division. It's a $1.50 trillion market cap Communication Services name (Interactive Media & Services), and the stock is down ≈22.1% over the past 52 weeks — near the bottom of its $520.26–$796.25 range. Meta trades at a trailing P/E of 22.24 and a forward P/E of 18.39.
💰 The Option Flow Breakdown
📊 What Just Happened — Two Separate Trades
Trade 1 — 12:44:00 ET — 🤝 Block Cross
| Field | Detail |
|---|---|
| Time | 12:44:00 ET |
| Action | BUY |
| Type | CALL |
| Expiration | 2027-01-15 |
| Strike | $700 |
| Size | 4,000 contracts |
| Option Price | $28.49 |
| Premium | $11,396,000 |
| Prior OI | 116,263 |
| Spot at print | $578.46 |
| Mechanism | Block cross (negotiated, off-book, known counterparty) |
| Option symbol | META20270115C700 — view option chart |
Trade 2 — 13:00:29 ET — 🤝 Stock-Plus-Options Cross (hedged)
| Field | Detail |
|---|---|
| Time | 13:00:29 ET |
| Action | BUY |
| Type | CALL |
| Expiration | 2028-01-21 |
| Strike | $1,000 |
| Size | 2,200 contracts |
| Option Price | $36.35 |
| Premium | $7,997,000 |
| Prior OI | 15,440 |
| Spot at print | $581.21 |
| Mechanism | Stock-plus-options cross (negotiated, paired with an equity block) |
| Paired equity leg | 52,800 shares bought at $583, printed at 13:00:30 ET — one second later |
| Option symbol | META20280121C1000 — view option chart |
Combined: $19,393,000 net debit paid. Both prints were negotiated blocks — not lit sweeps that took the order book — so there's no urgency signature to point to here, no one "slamming the ask." A broker matched a buyer with a known counterparty on both prints.
🔄 ✅ RESOLVED — One Opened Partially, One Was a Close
Updated 2026-08-05 pre-market. The ≈06:30 ET OPRA open-interest snapshot (reflecting the August 4 close) has published. We said we would not assert BTO until the number was in — here is what it says, and on one leg it says the opposite.
| Leg | Baseline OI (Aug-4 snap) | Resolving OI (Aug-5 snap) | Δ | Print size | Day volume | Verdict |
|---|---|---|---|---|---|---|
| Jan-15-2027 $700 C (bought) | 116,263 | 117,723 | +1,460 | 4,000 | 4,476 | ⚠️ PARTIAL OPEN (BTO ≈37%) |
| Jan-21-2028 $1,000 C (bought) | 15,440 | 13,651 | −1,789 | 2,200 | 2,287 | 🔄 CLOSE (BTC) — INVERSION |
Trade 1 — the $700 call — opened, but only about a third of it was new. Open interest rose, so the direction is right: this was a buy-to-open. But it rose by just 1,460 contracts against a 4,000-contract print (≈37%). The other ≈2,540 contracts were sold by holders who were closing existing long positions, so those contracts changed hands rather than being created. The trade is real new length — roughly $4.2M worth of it in net-new terms, not $11.4M.
Trade 2 — the $1,000 call — inverted. Open interest fell by 1,789 contracts against a 2,200-contract print, with only 87 contracts of other volume at the strike all day. Contracts are only destroyed when both sides close, so this purchase was a buy-to-close: someone covering a short January-2028 $1,000 call, not opening a new one.
That flips the meaning of the second trade completely. It was not a whale paying $8.0M for a lottery ticket on META reaching $1,000 by January 2028. It was a desk retiring an existing short call obligation at that strike — which is a mildly bullish-leaning action in its own right (you buy back a short call when you no longer want the upside capped, or when you're unwinding the whole structure), but it is emphatically not the "someone is betting on a 72% move" story the print size suggests. Roughly 81% of the print provably destroyed open interest.
A note on the paired stock block, honestly stated. The 52,800-share equity leg printed one second later still matches the option leg's delta almost exactly, so the package was still delta-managed. But with the option leg now proven to be a close, the natural reading is that the equity block was unwinding an existing hedge rather than establishing a new one. We have not re-pulled the equity tape to verify the stock leg's side today, so treat that as the coherent inference it is — not as proven from the tape.
🤓 What This Actually Means — Plain English
Buying a call means paying money today for the right to buy META stock at a fixed price later. A LEAP call (Long-term Equity AnticiPation) is just a call option with more than a year until expiration — you're not betting on next week's wiggle, you're renting exposure to where the stock could be a year or more from now, and time decay eats at you slowly rather than fast.
Both of these are far out-of-the-money LEAP calls — the stock has to climb a long way before either one is worth anything at expiration:
- The $700 strike is ≈21% above where META traded at the time of the print ($578.46).
- The $1,000 strike is ≈72% above where META traded at the time of the print ($581.21).
Here's the nuance that matters most: these two trades are not the same kind of bet.
- The $700 call has no equity leg on the tape at all — nothing offsetting it. As printed, it reads as a straight, unhedged directional purchase: whoever's on the buy side is exposed dollar-for-dollar to META going up or down (bounded by the $11.4M paid).
- The $1,000 call arrived with 52,800 shares of META stock at $583, printed one second later. The option's delta-equivalent exposure is 2,200 contracts × 100 × 0.2554 delta ≈ 56,188 shares — the stock block covers ≈94% of that. That's a textbook delta-managed package, so this leg was never a simple "META goes up" bet in the first place. And per the resolved OI above, it wasn't a new position at all — the option leg bought back an existing short call, so the package reads as an existing delta-managed structure being taken off rather than a convexity trade being put on.
So don't read this as "$19.4M of bullish META call buying." Read it as: one partial new directional position (the $700 call, ≈37% net-new), and one existing short-call position being covered (the $1,000 call). The headline premium counts both as purchases; only one of them added exposure to the market.
📈 Technical Setup / Chart Check-Up
YTD Chart
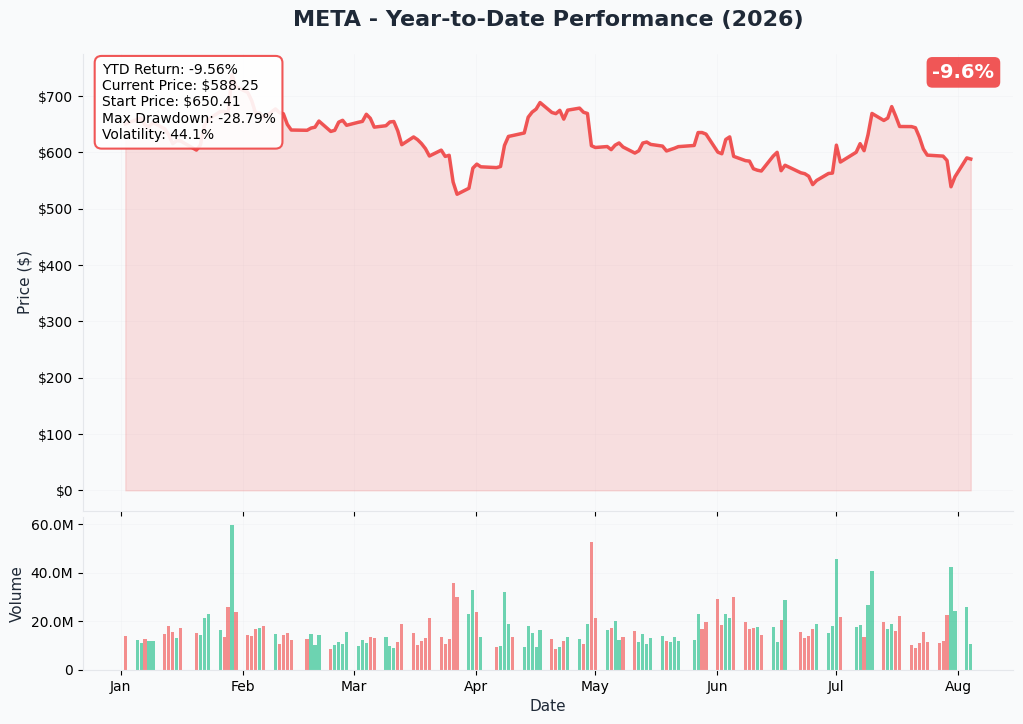
META is down ≈9.6% over the past year and has been grinding lower since the July 30 wave of analyst target cuts (see Catalysts below). The stock has spent recent sessions consolidating in the mid-$570s to $590s — right where both of these trades printed.
Gamma-Based Support & Resistance
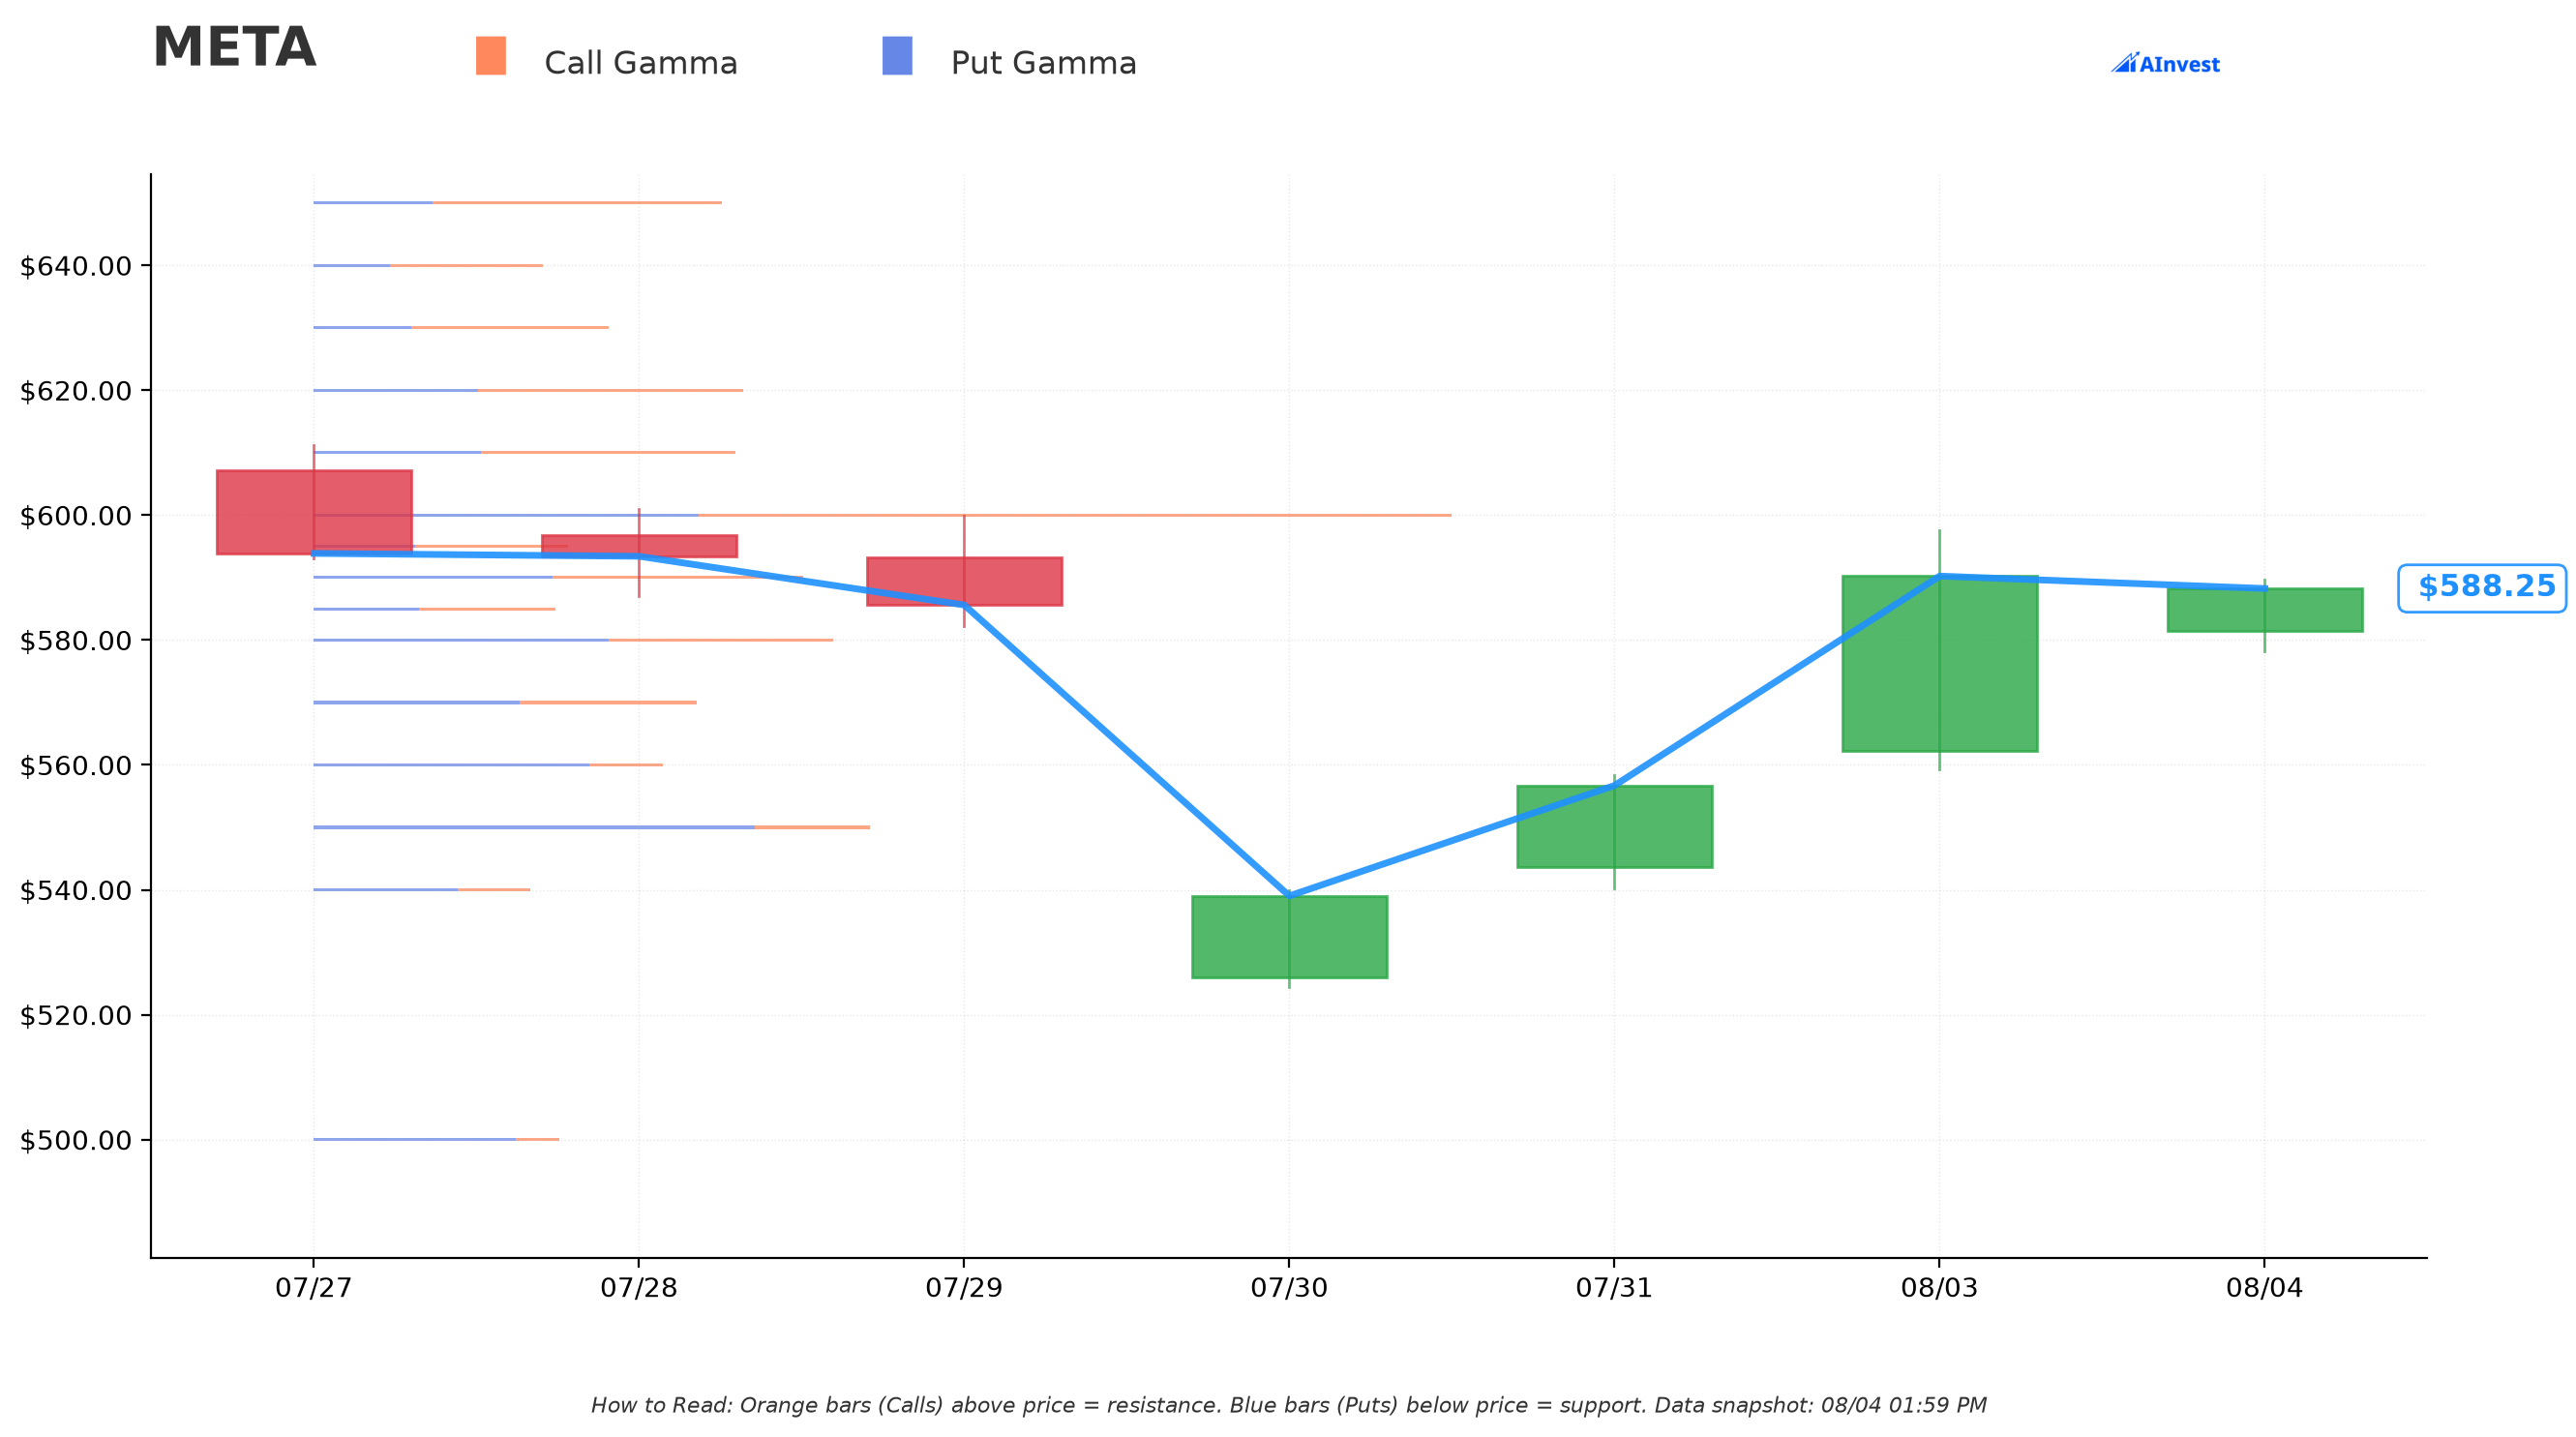
With META at ≈$588, the options market is currently showing:
- 🟠 Resistance directly overhead at $590 (very strong, +0.3% away) and $600 (very strong, +2.0% away) — these are the nearest walls the stock would need to clear.
- 🟠 A major call-gamma wall at $700 — the exact strike of Trade 1's Jan-2027 call — sitting ≈19% above spot. That's real dealer positioning built up at that level already; it's not a level pulled from nowhere.
- 🟠 Beyond that, resistance walls stack at $750 (≈27.5% away) and $800 (≈36% away). There is no meaningful gamma structure at $1,000 — Trade 2's strike is well past where the options market currently has any real open interest concentrated, which is consistent with how far out-of-the-money it is.
- 🔵 Support underneath at $580 (very strong, −1.4%), $570 (strong, −3.1%), and $550 (very strong, −6.5%).
In plain terms: the $700 call isn't just a round number — it's sitting on top of the single biggest call-gamma concentration currently visible on the chain outside of $600. The $1,000 call is out past all of it.
Implied Move
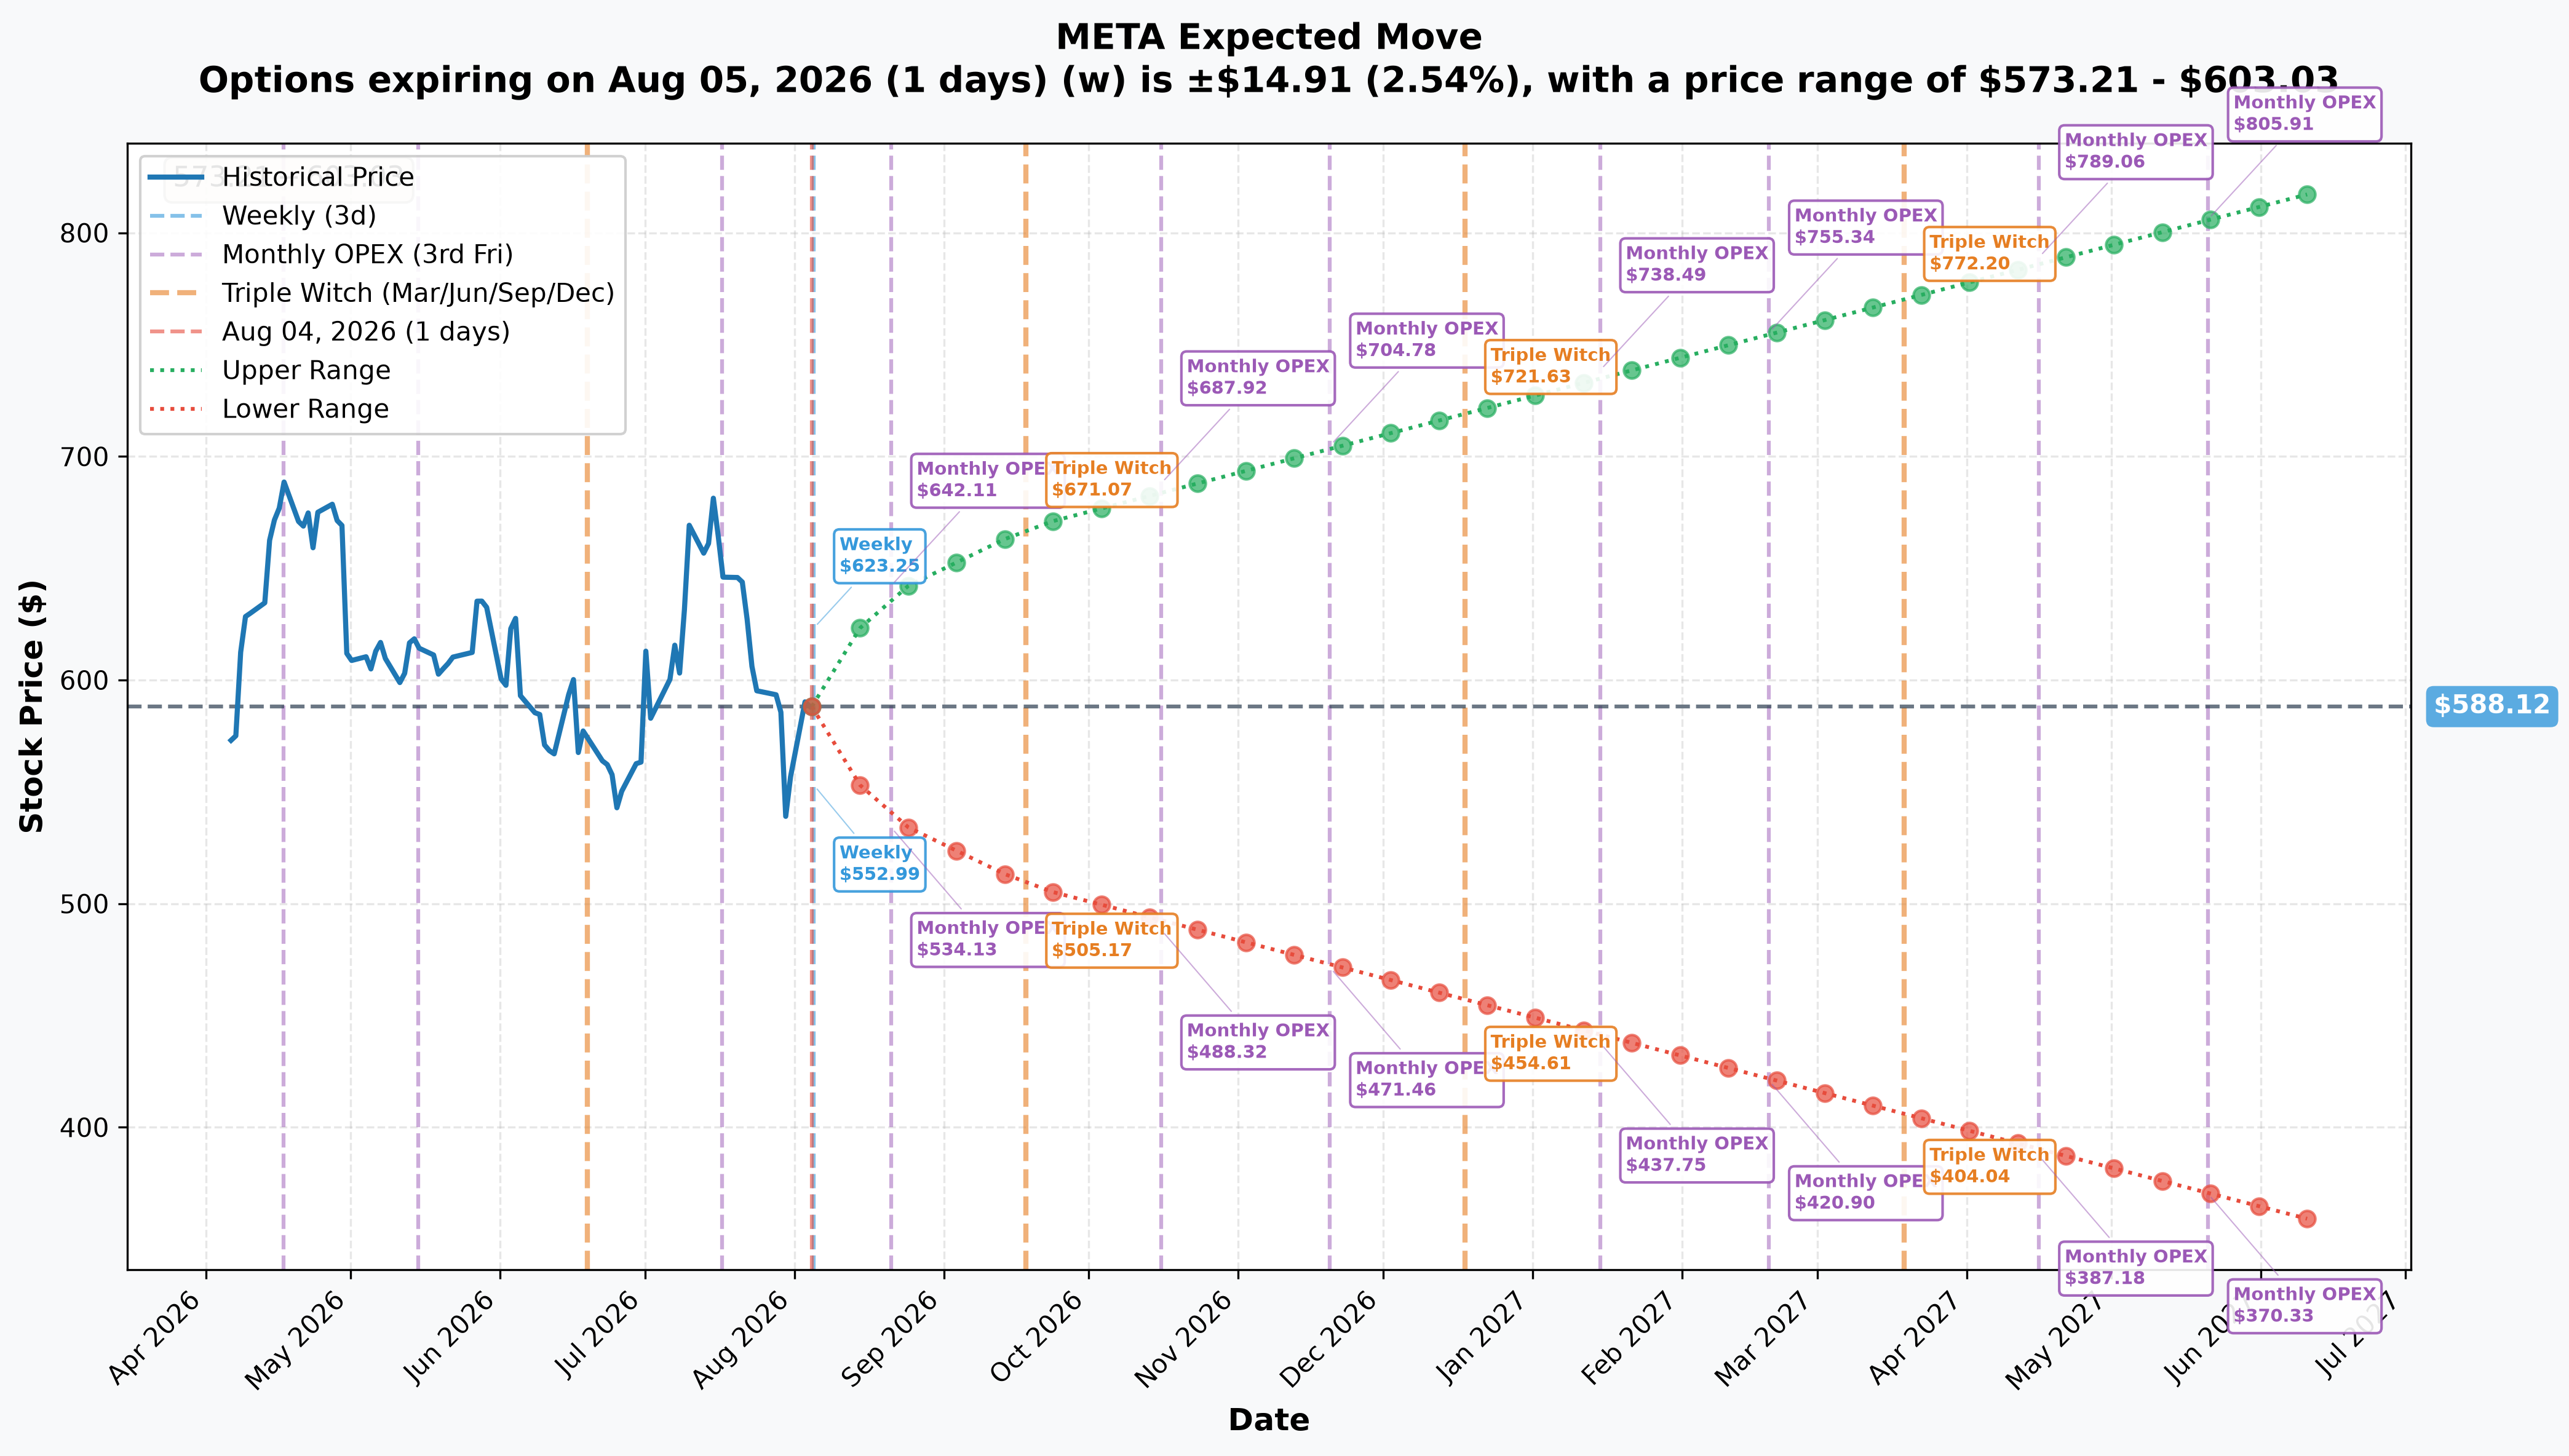
Reading straight off the option chain's implied volatility (META_implied_move.json):
| Timeframe | Expiry | Implied Move | Range |
|---|---|---|---|
| Weekly | 2026-08-05 | ±2.5% | $573.21 – $603.03 |
| Monthly OPEX | 2026-08-21 | ±8.7% | $537.27 – $638.97 |
| Quarterly (Triple Witch) | 2026-09-18 | ±13.6% | $507.98 – $668.26 |
| Yearly LEAPS | 2027-06-17 | ±39.6% | $355.16 – $821.08 |
Even the widest measure the option market is currently pricing — the one-year implied move out to June 2027 — puts the upper bound at $821, which is above the $700 strike but still well short of $1,000. That's the market's own volatility pricing confirming what the strike-distance math already told us: the $700 call is a stretch but inside the realm of what the option chain considers plausible over that horizon; the $1,000 call sits outside even the widest band currently priced anywhere on the chain.
🎪 Catalysts
Already happened:
Meta reported Q2 2026 on 2026-07-29 — this is company-confirmed and already in the past. Revenue beat at $60.80B (+28% YoY) vs. $60.22B consensus, but EPS missed badly at $6.18 vs. $7.19 consensus (MarketBeat). Management guided 2026 capex to $130–145B, and free cash flow collapsed to $784M on $31.08B of quarterly capex (StockTitan). The next day, 2026-07-30, seven separate analyst desks cut their price targets — zero raises — including Susquehanna ($900→$650) and Wells Fargo ($835→$640) (MarketBeat price target).
Upcoming:
The next earnings date is ESTIMATED, not company-confirmed — Meta has historically reported Q3 in late October, so treat late October 2026 as an estimate pending confirmation from Meta IR. What is confirmed is the Q3 revenue guide of $61.0B–$64.0B, issued on the July 29 call (MarketBeat) — that implies sequential growth of only +0.3% to +5.3% off the Q2 base, a visible deceleration worth watching.
The single biggest catalyst ahead is 2027 capex guidance, which management is expected to first sketch on the Q3 call (estimated late October 2026) and formalize on the Q4 call (estimated late January 2027). A number materially above the current $130–145B framework would likely pressure the stock further; a signal that capex is plateauing is arguably the most powerful re-rating catalyst available given the current 18.39 forward P/E.
How the catalysts map onto these two trades: the January 2027 $700 call expires before the Q4 2026 print, meaning it spans the Q3 2026 earnings report and lives right up against the expected Q4 2026 call — it's a bet that gets to see roughly two more earnings events play out. The January 2028 $1,000 call spans roughly six more quarterly reports, including the full 2027 capex guide cycle and whatever the 2027 numbers turn out to be.
Also worth flagging: Reality Labs posted $431M in quarterly revenue against a $4.62B operating loss (StockTitan), and on 2026-07-28 Meta announced a data-center joint venture with BlackRock in El Paso, Texas, at ≈$14B in development cost (StockTitan) — the kind of partner-financed buildout that's becoming a recurring theme and a test of whether the market treats it as capex relief or hidden leverage.
🎲 Reading This Four Ways
🎰 YOLO Trader
Two separate $8–11M prints on far-OTM LEAPS is the kind of flow that gets attention — but "unusual size" isn't the same as "high probability," and after the OI resolution there's less here than the headline implies. The $1,000 call was a short being covered, so there is no whale betting on a 72% move to follow. The $700 call did open, but only ≈37% of it created new contracts. If you're chasing the remaining idea, understand you're buying cheap optionality on a stock in a downtrend that needs to rise ≈21% just to reach the strike — not following a proven winner.
🎯 Swing Trader
Neither of these trades tells you anything about the next few weeks. The weekly implied move is only ±2.5% ($573–$603), and both blocks were negotiated off the lit book — no aggressor signature, no urgency read. If you trade the near-term, the gamma walls at $590 and $600 matter more to you than either options print.
💵 Premium Collector
The $700 call sitting on the biggest visible call-gamma wall outside of $600 is a data point worth banking for future covered-call or credit-spread strike selection — $700 already has real dealer hedging flow around it. Selling premium into a level that already has structural resistance can make sense, but that's a separate trade idea, not an endorsement of buying what these two prints bought.
🌱 Beginner
The lesson here turned out to be even better than the one we started with: not every "someone bought $19M of calls" headline is even a purchase in the sense you'd assume. One leg (the $700 call) was a plain directional buy with no visible protection. The other (the $1,000 call) came with an equity hedge covering ≈94% of its delta — and the next morning's open-interest number showed it was buying back a short position, not opening a new one. "Bought" on the tape can mean "opened a bet" or "closed an obligation," and the only way to tell is the next day's open interest. Learning to ask that question is worth more long-term than copying any single print.
⚠️ Risk Factors & Honest Limits
- Both legs are long-dated, far out-of-the-money, on a stock that is down ≈9.6% over the past year. These are not high-probability trades by construction — they're cheap optionality on a large recovery or an AI-capex payoff materializing.
- Open/close is now resolved, and one leg went against the original framing. Size was below prior OI on both prints, which is why the BTO framing was held provisional. The 2026-08-05 OI snapshot confirmed the $700 call as a partial open (≈37% net-new) and the $1,000 call as a close, not an open. The corrected reads are in the RESOLVED box above; the original "two long LEAP purchases" framing is wrong for the second trade.
- The tape cannot tell us who did this or why. No broker/MMID, no customer identity, no order ID, and no visibility into any other hedges (futures, other expiries, other tickers) the buyer may be running alongside this. We can see the 52,800-share stock block that paired with Trade 2 because it printed one second later — we cannot see anything equivalent for Trade 1, which is why it reads as unhedged, but absence of a visible hedge on the tape is not proof none exists elsewhere.
- These were negotiated block/cross prints, not lit sweeps. That means no NBBO-aggressor signal to lean on for directional conviction — a known counterparty took the other side of both trades by pre-arrangement.
- Time decay is real and continuous. A LEAP call losing to theta over a year-plus horizon is a slow bleed, not a single risk event — both positions need the stock to actually move, not just "eventually."
Options carry substantial risk and are not suitable for every investor. This is not a recommendation to buy or sell any security — it's a breakdown of what printed on the tape and what it can and cannot tell us.
Last updated: 2026-08-05 — next-day OI resolution added; the Jan-2028 $1,000 leg was re-read from BTO to BTC (a close), and the Jan-2027 $700 leg marked a ≈37% partial open.