📘 META — Two Trades, Same Name, Opposite Intent: One Hedged Flat, One $69.8M and Completely Naked
🔄 Updated August 10, 2026. The March $650 call confirmed as a clean open and the $750 call confirmed as a net open at ≈42% of its headline size — so the naked long is real, but smaller than $69.8M of premium suggests. The September $650 leg inverted: open interest fell 13,553 → 12,489, so today's 2,000-lot sale was net closing, not the second day of short-building we described. That makes Trade 1 read as a roll out rather than a fresh calendar spread. The delta-hedge finding — the 97% match that defines the trade — is unaffected.
Meta Platforms Inc runs Facebook, Instagram and WhatsApp, plus Reality Labs for VR and AR. Sector: Communication Services / Internet Content & Information. Market cap $1.51T — down 22.6% — with the stock at $592.60, up 0.46% today (StockAnalysis). Follow it on the Meta ticker page.
🤝 Trade 1 — The Calendar Spread (13:30:11)
At 13:30:11, with the stock at $591.83, one package crossed as a stock-plus-options cross — a negotiated block that carries a share leg by definition. Same strike, two expiries:
Sell 2,000 September-18 $650 calls at $10.05, and buy 2,000 March-19-2027 $650 calls at $59.75.
| Time | Buy/Sell | C/P | Expiration | Strike | Size | Volume | OI (prior) | Option Price | Premium | Spot | Option Symbol |
|---|---|---|---|---|---|---|---|---|---|---|---|
| 13:30:11 | SELL | CALL | 2026-09-18 | $650 | 2,000 | 2,473 | 13,553 | $10.05 | $2,010,000 | $591.83 | META20260918C650 |
| 13:30:11 | BUY | CALL | 2027-03-19 | $650 | 2,000 | 2,006 | 826 | $59.75 | $11,950,000 | $591.83 | META20270319C650 |
Net: a $9,940,000 DEBIT. Package delta +45,360 shares.
Same strike, different expiries. We called it a calendar spread. The March leg is a proven open (2,000 against 826 of prior open interest, since confirmed at +1,949); the September leg traded below its 13,553 existing contracts and could not be proven either way on the day. It has since resolved as a close — see the resolution box below — which makes this package a roll out from September to March at the same strike, rather than a freshly established calendar. The economics discussed below are unchanged; what changes is that the September exposure was being retired rather than created.
⭐ The Hedge Landed 61 Seconds Later — and It Matches to 3%
This is the finding that defines the trade. One minute after the options printed, a 44,000-share block crossed the equity tape at $591.50, carrying the condition flags that mark it as the stock side of a negotiated options package.
We computed the package's delta independently from the option Greeks: +45,360 shares.
44,000 against 45,360 is a 97.0% match.
That is not a coincidence — it is the counterparty neutralising the position's directional exposure at the moment of execution. Which means this trade expresses no opinion about where Meta's share price goes. Somebody spent $9.94M on a view about time and volatility, and paid to remove the share-price bet entirely.
What a Calendar Spread Actually Bets On
Short the September $650 call, long the March-2027 $650 call, hedged to flat delta. What is left is a bet on the shape of the volatility term structure: that the near-dated option loses value to time decay faster than the long-dated one, or that longer-dated volatility is cheap relative to near-dated.
The economics are lopsided by design: $10.05 collected against $59.75 paid. The September call has six weeks to live and 25 delta; the March call has seven months and 48 delta. The buyer is financing a small slice of a long-dated position with a short-dated sale.
🔍 Yesterday, Somebody Sold 6,300 of That Same September Call
The September $650 strike has been active. Open interest ran 4,403 → 6,851 through late July, then jumped to 13,553 overnight.
We pulled yesterday's tape. On August 6, a 6,300-lot block printed at $11.20 — at the bid, 0% across the spread — also as a stock-plus-options cross. A block at the bid is a sale, and the open interest rose by 6,702 the next morning, so that sale opened a short call position.
Today, another 2,000 of the same strike is sold — and we wrote that the strike was being systematically sold on consecutive sessions. The August 10 snapshot corrected that. Open interest at September $650 went 13,553 → 12,489, down 1,064, so today's sale did not add to the short line; it shrank it. For open interest to fall, contracts must be retired on both sides of the print — so today's seller was closing a long, not opening a short.
The pattern therefore lasted exactly one session. Yesterday's 6,300-lot sale is still a proven short-opening (open interest rose 6,702 the next morning, and that stands). Today's 2,000 went the other way. Two sales at the same strike on consecutive days, opposite meanings — which is precisely why the size of a print never settles open versus close on its own.
⭐ Trade 2 — $69.8M of January-2027 $750 Calls, With No Hedge At All (15:52:35)
Eight minutes before the close, with the stock at $594.76, a single-leg floor block printed on the Philadelphia exchange:
Buy 32,000 January-15-2027 $750 calls at $21.80 — $69,760,000.
| Time | Buy/Sell | C/P | Expiration | Strike | Size | Volume | OI (prior) | Option Price | Premium | Spot | Option Symbol |
|---|---|---|---|---|---|---|---|---|---|---|---|
| 15:52:35 | BUY | CALL | 2027-01-15 | $750 | 32,000 | 32,241 | 245,456 | $21.80 | $69,760,000 | $594.76 | META20270115C750 |
Delta 0.2505 ⇒ +801,600 shares of exposure.
This block was 32,000 of the contract's 32,241 total volume — 99.3% of everything that traded there all day. Nothing else of size happened at that strike.
The Contrast That Makes This Page Worth Reading
We searched the equity tape around 15:52:35 and found 300 QCT shares in a five-minute window. Against +801,600 shares of delta, that is nothing.
This trade is unhedged. Compare it with the morning's calendar, where a 44,000-share block matched the package delta to 97% within 61 seconds. Same underlying, same session, opposite intent: the first trade deliberately removed its directional exposure; the second is pure directional exposure, and eight times larger.
A Very Large Position Already Sits at This Strike
The January-2027 $750 strike holds 245,456 contracts — one of the biggest single lines in Meta's chain. Its history explains where it came from:
| Jul 24 | Jul 27 | Jul 28 | Jul 29 | Jul 30 | Jul 31 → Aug 7 |
|---|---|---|---|---|---|
| 217,935 | 217,464 | 217,641 | 229,279 | 245,273 | drifts 245,921 → 245,456 |
Flat near 218,000, then +11,638 and +15,994 across July 29–30 — Meta's confirmed earnings date and the session after it. Somebody added ≈27,600 contracts around that print. Since then the line has been essentially static, drifting down about 465 contracts over five sessions.
Today's 32,000 arrives on top of that. At a size below the existing 245,456, today's tape cannot prove whether it adds to that position or takes some off — and this one matters, because a $69.8M ticket means opposite things in the two cases.
Why the Fill Tells You Nothing
The block printed at $21.80, exactly the midpoint between a $21.60 bid and a $22.00 ask — and it printed as a manually negotiated floor block, not a lit trade.
Both facts point the same way: there is no aggressor signal here. A midpoint fill means nobody reached across the spread, and a floor block is arranged off the open book by definition. We will not tell you this was urgent buying, because the tape does not say so. A single-leg floor block also means no paired option leg exists — this is not part of a spread.
✅ RESOLVED — The August 10 Snapshot
Resolving OPRA open interest is timestamped August 10 and reflects the August 7 close.
| Leg | Baseline (Aug-7) | Resolving (Aug-10) | Δ | Print size | Δ as % | Day vol | Verdict |
|---|---|---|---|---|---|---|---|
| Jan-2027 $750 call (bought) | 245,456 | 258,969 | +13,513 | 32,000 | 42.2% | 32,241 | ✅ OPEN (BTO) — net, ≈42% |
| Mar-2027 $650 call (bought) | 826 | 2,775 | +1,949 | 2,000 | 97.5% | 2,011 | ✅ OPEN (BTO) — as predicted |
| Sep-18 $650 call (sold) | 13,553 | 12,489 | −1,064 | 2,000 | −53.2% | 2,555 | 🔄 CLOSE — not more short exposure |
Trade 2 — the one we said to watch — landed between our two numbers. We named ≈277,500 for "somebody added $69.8M of exposure" and ≈213,500 for "a large holder took some off." It came in at 258,969: net open, but only ≈42% of the print created new contracts. So the naked long is real and it is directionally what we said — it is just not 32,000 contracts of new exposure. Roughly 18,500 of that block changed hands between existing holders. The $69.8M headline overstates the new money by more than half, and that is the honest way to size it.
Trade 1's March leg confirmed cleanly — 826 → 2,775 against a predicted ≈2,830.
Trade 1's September leg went the way we listed third. We said a rise of ≈2,000 meant more short call exposure and a fall meant covering. It fell 1,064. That is the covering case, and it reverses the consecutive-session short-building story: yesterday's 6,300 opened a short, today's 2,000 helped retire one. The package is a roll out from September to March, not a fresh calendar.
What survives untouched: the 61-second, 44,000-share equity block matching the package's +45,360-share computed delta to 97.0%. That is the finding that defines Trade 1, it rests on the tape rather than on open interest, and nothing in this resolution disturbs it. Selling 2,000 September calls is the same delta whether it opens or closes.
🤓 What This Actually Means — Plain English
A calendar spread is a bet on time, not direction. You sell an option that expires soon and buy one at the same strike that expires later. If the stock goes nowhere, the near option decays to zero faster than the far one, and you keep the difference.
A roll out is that same pair of legs with one difference: the near option was already yours. That is what open interest showed here — the September call was being handed back, not written fresh. The cash flows look identical on the tape; the position that results is not. After a calendar spread you are short September and long March. After a roll out you are simply long March, with the September obligation gone.
The delta hedge is what proves the intent here. A directional trader wants the share-price exposure — that is the whole point. Somebody who sells 44,000 shares against their own options package one minute later is deliberately throwing that exposure away. What remains is a pure volatility position.
Why these strikes? Note that the analyst average target is $756.95 — essentially on top of Trade 2's $750 strike. The street's consensus price is exactly where that $69.8M was placed. Trade 1's $650 strike sits 9.7% above the current price. Near enough that the September call carries real premium to sell, far enough that it is not likely to be exercised in six weeks. Note that the analyst consensus target of $756.95 sits well above it — the street thinks Meta gets past $650 eventually, which is exactly why the March call costs six times the September one.
One honest caution about the fill: on a negotiated cross the price is agreed as part of the package rather than swept off the lit market. The September leg printed at the midpoint and the March leg at 82% across — but per-leg aggressor readings are unreliable on a multi-leg package, because the engine allocates a net price across the legs. We are not reading urgency into either number.
📊 The Charts
One-Year Price Action
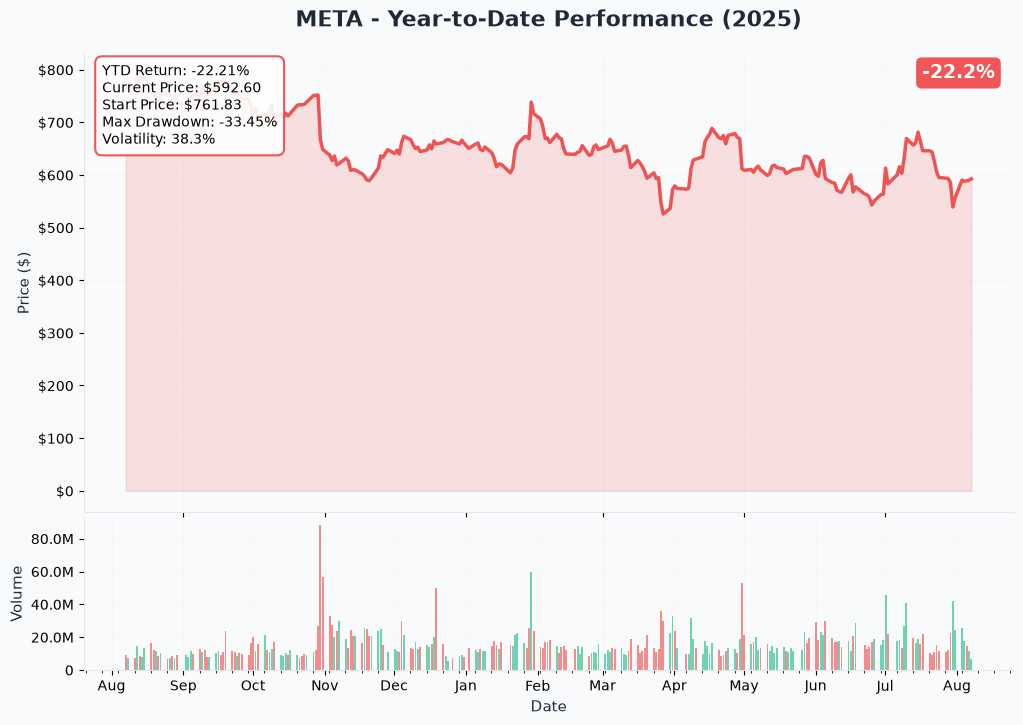
Meta is −22.2% over the past year and sits about 25.6% below its 52-week high of $796.25. Market capitalisation is down 22.6% even though FY2025 revenue grew 22.17% to $200.97B — net income slipped 3.05% to $60.46B (StockAnalysis). That is the AI and Reality Labs spending story in two numbers: revenue compounding, margin under pressure, multiple compressed.
Gamma Support and Resistance
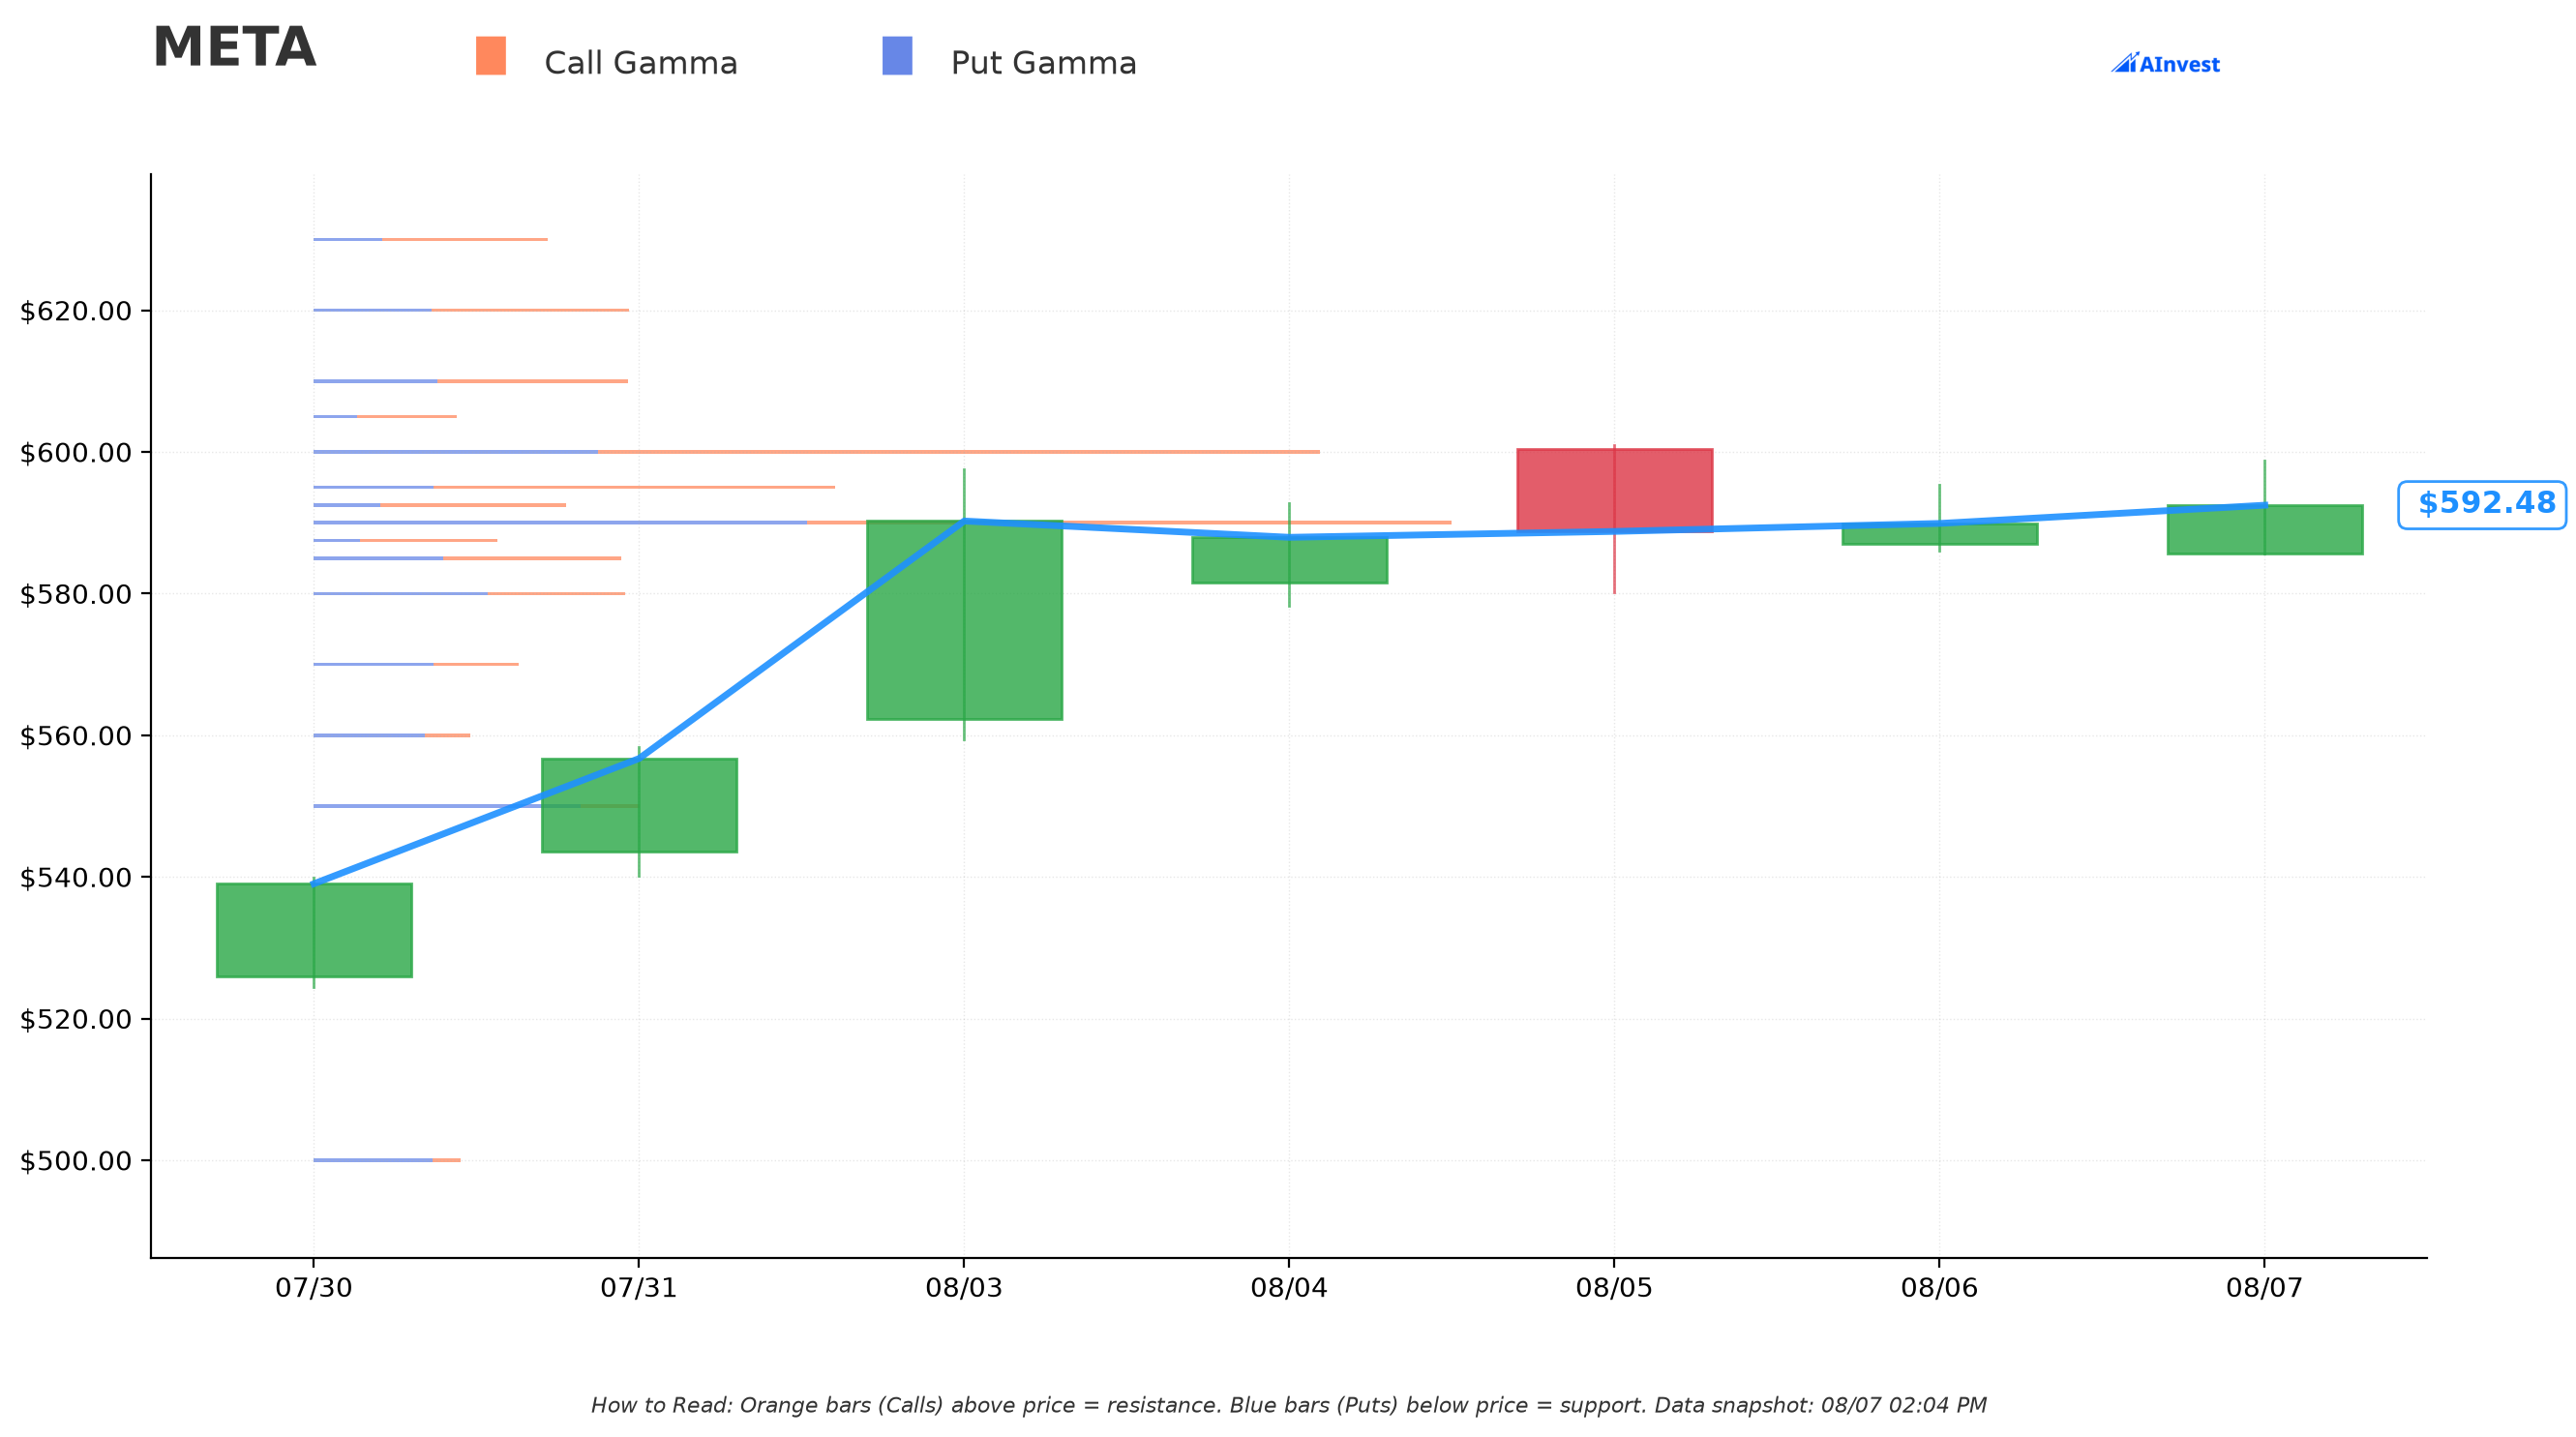
Dealer gamma clusters tightly around spot: support at $590, $585, $580 and $550, resistance at $595, $600, then a long gap before $700 and $750. The stock is sitting right on the $590 support shelf.
Note where the traded strike falls. $650 sits in the empty corridor between the $600 and $700 gamma levels — a zone with little hedging activity to slow the stock down if it gets there. That is a meaningful detail for anyone short that September call.
Implied Move
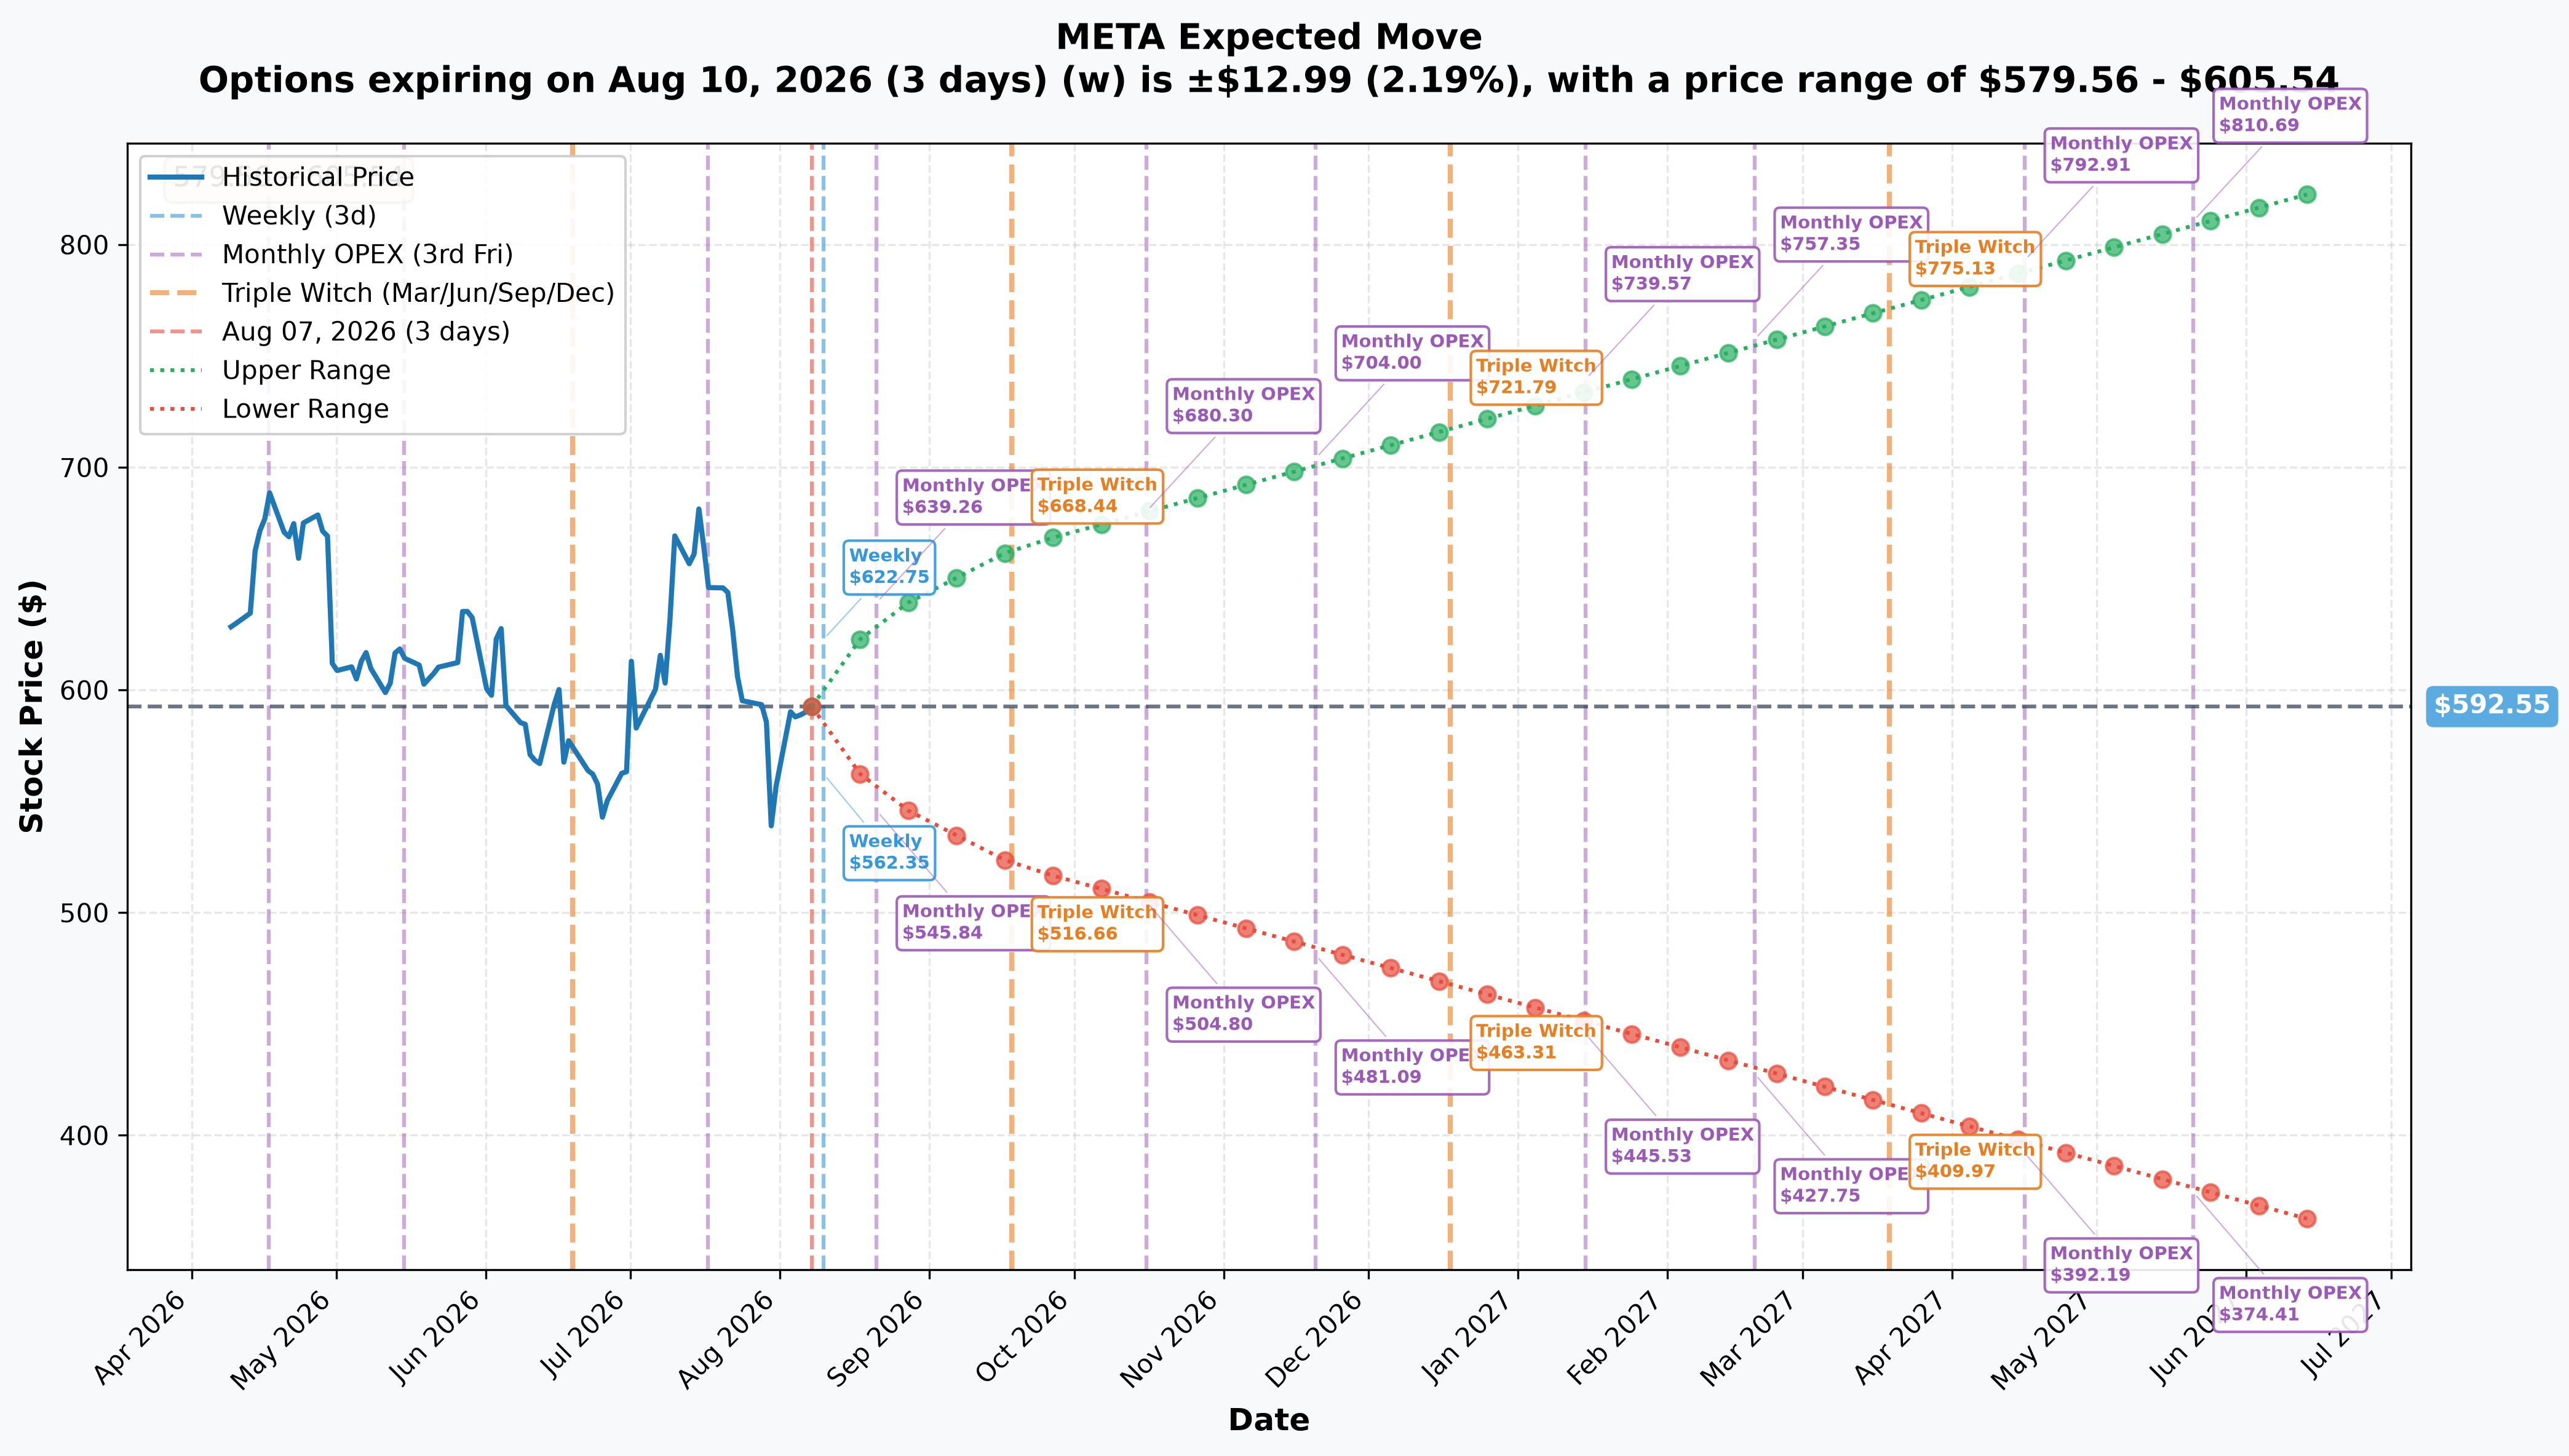
The chain prices ±2.19% by August 10 ($579.56–$605.54), ±6.76% by August 21 ($552.51–$632.59), ±12.01% by September 18 ($521.40–$663.70), and ±39.22% out to June 2027 ($360.18–$824.92).
Hold the September range against the short strike. The market's own expected range reaches $663.70 — above the $650 call that was sold. So that strike is not a comfortable distance away; it sits inside the distribution the chain is pricing. The seller is being paid $10.05 for a risk the market considers genuinely live.
The longer range matters for the other legs: through June 2027 the chain reaches $824.92, and the March-2027 expiry sits inside that horizon. That is why Trade 1's long call cost $59.75.
And it puts Trade 2's $750 strike in perspective. That strike sits comfortably inside the June-2027 upper bound of $824.92 — so the market does not treat $750 as a reach, which is why a January-2027 call there still costs $21.80 with the stock at $594.76. Meta needs +26.1% to reach the strike and +29.8% to clear the $771.80 breakeven. Demanding, but squarely inside what the chain prices.
📅 Catalysts
- Most recent earnings: July 29, 2026 — confirmed (StockAnalysis). Already past, and it sits before both expiries traded today.
- No forward earnings date is published, so we will not invent one. On Meta's usual cadence an autumn print would fall inside the March-2027 expiry but after the September expiry — which would be a genuinely relevant asymmetry for a calendar spread. We flag it as an inference, not a fact.
- Legal: a New Mexico court ordered Meta to pay $942 million in child-safety damages (StockAnalysis). Small against a $1.51T market cap, but a live marker of regulatory exposure.
- Consensus Strong Buy, average target $756.95 (+27.73%) across 62 analysts (StockAnalysis). Deep coverage — this average carries far more weight than a thin three-analyst figure.
- FOMC held 3.50–3.75% on July 29 on a 9–3 vote, three officials preferring a hike (Federal Reserve). September 15–16 falls inside the September expiry; all three remaining meetings fall inside the March-2027 expiry (Federal Reserve).
👥 Four Ways to Read This
🎲 The YOLO trader — Trade 1 offers nothing to chase: it was hedged flat the minute it printed, so whatever it bets on, it is not Meta's share price. Trade 2 is the opposite — naked upside needing +29.8% by January. That is a real directional position, though the resolution scales it down: ≈13,500 contracts of genuinely new exposure, not the full 32,000 the $69.8M headline implies. It still needs Meta to do something it has not done in a year.
📈 The swing trader — the useful structure is the gamma map: $590 support, $595–$600 resistance, then an empty corridor up to $700. If Meta clears $600 there is little hedging friction until well above it. Trade 1's $650 short strike sits in that gap; Trade 2's $750 strike is far beyond it. Neither is a near-term signal — the nearest thing to one is that a desk was willing to pay $69.8M for January upside on a stock down 22% in a year.
💰 The premium collector — study Trade 1's ratio: $10.05 collected against $59.75 paid. That is not premium collection; the sale finances a small part of a much larger long-dated purchase. And note the September range reaches $663.70, so the sold strike sits inside the expected distribution rather than safely outside it. On Trade 2 you would be the seller of a $750 January call at $21.80 — against a strike the June-2027 range still contains.
🌱 The beginner — today's lesson is on this one page twice over: look for the stock leg. Trade 1 printed with a 44,000-share block against a computed 45,360 of delta — a 97% match — which turns "a $9.9M bullish-looking call purchase" into "a hedged bet on volatility." Trade 2, seven times bigger, had 300 shares against +801,600 of delta — no hedge, genuinely directional. Same ticker, same day, and the only thing that separates them is whether you checked.
⚠️ Honest Risk and Limits — What the Tape Cannot Prove
- ✅ The September leg is now settled: it reduced the short line, not added to it (13,553 → 12,489). Our "systematically sold on consecutive sessions" framing was wrong on day two.
- We cannot prove today's participant is yesterday's, and the resolution makes that caveat sharper rather than softer — the two consecutive sales moved open interest in opposite directions, which is itself mild evidence they were different books.
- We do not know the broader book. A roll out may itself be one leg of something larger.
- Per-leg aggressor readings are unreliable on a negotiated multi-leg cross, so we have not read urgency into either fill.
- A short call at $650 carries uncapped risk if it is naked, and the strike sits inside the chain's own September range and in a gamma gap. We cannot see whether it is covered.
- ✅ Trade 2 resolved as a net open — but only ≈42% of it. Open interest rose 13,513 against a 32,000-contract print, so roughly 18,500 contracts changed hands between existing holders. The direction is settled; the size is smaller than the $69.8M headline, and any read of "new conviction" should be scaled to the 13,513 figure, not the 32,000.
- Trade 2 is unhedged as far as we can see, but absence of a hedge on the consolidated tape is not proof there is none — a position can be offset elsewhere, in futures or in a portfolio we cannot observe. Open interest does not speak to this.
Nothing here is investment advice.
Last updated: August 10, 2026 — ⏳ provisional open/close flags resolved against the August 10 OPRA open-interest snapshot. The September $650 leg resolved as a close (calendar → roll out); the $750 call confirmed as a net open at ≈42% of the print; the March $650 open confirmed.