🔀 MRVL Options Flow: Three Unrelated Trades, One a Textbook Zero-Delta Financing Vertical (Net ≈$7.21M Credit)
📅 2026-08-03
✅ UPDATE — August 4, 2026 pre-market: all four legs confirmed OPEN — including Trade 1, which was the one we could not call. The Jan-2028 $300 call rose 3,655 → 5,908 (+2,253) against a 2,500-lot print, settling it as STO (sold to open), not STC. See the ✅ RESOLVED box.
🎯 The Quick Take
Three separate MRVL options trades printed on 2026-08-03, at three different times, using three different execution mechanisms — they are not one package and should not be read as a single strategy. A desk sold $11.80M of far-dated calls in a negotiated block cross, a separate account built a deep-in-the-money call vertical in a price-improvement auction (not a cross) whose combined delta is essentially zero (a financing structure, not a directional bet), and a third account bought $4.55M of deep-in-the-money puts in a lit stock-plus-options print. Net across all three: ≈$7.21M collected. MRVL is +112.4% year-to-date — the single biggest gainer on today's board — after a violent round trip that took it roughly 42-45% below its 52-week high in late July before a sharp rebound.
🏢 Company Overview
Marvell Technology (MRVL) designs data-infrastructure semiconductors. Its current center of gravity is custom AI silicon — custom XPUs and "XPU-attach" accelerator components for hyperscale cloud customers — alongside data-center electro-optics (PAM4/coherent DSPs, silicon photonics), Ethernet switching, storage controllers, and DPUs, per the Q1 FY2027 results release.
| Item | Value |
|---|---|
| Exchange / Ticker | Nasdaq: MRVL |
| Sector | Information Technology — Semiconductors |
| Market cap | ≈$167.0B |
| 52-week range | $61.44 – $329.88 |
| YTD performance | +112.4% (biggest gainer on today's board) |
| Recent drawdown | ≈−45% in July 2026 alone (worst month since Feb 2001); ≈42-45% below the 52-week high as of early August |
Source: stockanalysis.com.
💰 The Three Trades — Read Separately, Not As One Structure
⚙️ Mechanism map — read this before the trade table. These three trades used three different execution mechanisms, and the words are not interchangeable. Trade 1 was a block cross (a broker matched a buyer and a seller off the open book). Trade 2 was a price-improvement auction — exposed for price improvement and matched, which is not a cross. Trade 3 was a lit stock-plus-options print. Only Trade 1 is a cross; do not carry that label across to the other two.
Trade 1 — 10:24:43 · a long-dated call sold in a negotiated block cross. A single-leg block cross printed at the bid — a known counterparty took the other side off the open book, no aggression involved.
Trade 2 — 11:40:40 · a deep-in-the-money call vertical with essentially zero directional exposure. Both legs printed together in a price-improvement auction (a facilitated, worked complex order — not a cross, not a lit sweep).
Trade 3 — 12:03:19 · a deep-in-the-money put bought in a lit stock-plus-options combo. The option leg is reported here; the paired equity leg reports on the stock (NMS) tape, which was not independently re-pulled for this write-up — flagged below as an honest limit.
Full Trade Table
| Time | Buy/Sell | Call/Put | Expiration | Strike | Option Price | Premium | Volume | OI (prior) | Size | Spot | Option Symbol | Mechanism |
|---|---|---|---|---|---|---|---|---|---|---|---|---|
| 10:24:43 | SELL | CALL | 2028-01-21 | $300 | $47.21 | $11.80M | 2,978 | 3,655 | 2,500 | $186.70 | MRVL20280121C300 | 🤝 Block cross |
| 11:40:40 | BUY | CALL | 2026-08-14 | $117 | $71.39 | $3.09M | 500 | 0 | 433 | $188.27 | MRVL20260814C117 | Price-improvement auction |
| 11:40:40 | SELL | CALL | 2026-08-14 | $118 | $70.42 | $3.05M | 500 | 0 | 433 | $188.27 | MRVL20260814C118 | Price-improvement auction |
| 12:03:19 | BUY | PUT | 2026-10-16 | $300 | $114.60 | $4.55M | 655 | 57 | 397 | $190.29 | MRVL20261016P300 | Lit (stock+option combo) |
Net across all three trades: ≈$7.21M credit (collected $11.80M, paid a ≈$42K net debit on the vertical, paid $4.55M for the puts).
✅ RESOLVED — Next-Day OI Is In (August 4, 2026 pre-market)
The OPRA open-interest snapshot timestamped August 4, 2026 ≈06:30 ET reflects the close of business August 3 — the definitive open-vs-close test we flagged when this published. Here is what it says.
| Leg | Baseline OI (Aug-3 snap) | Resolving OI (Aug-4 snap) | Δ | Print size | Δ as % of print | Verdict |
|---|---|---|---|---|---|---|
| Jan-21-2028 $300 call (sold) — Trade 1 | 3,655 | 5,908 | +2,253 | 2,500 | ≈90.1% | ✅ OPEN (STO) |
| Oct-16-2026 $300 put (bought) | 57 | 1,053 | +996 | 397 | ≈251% | ✅ OPEN (BTO) |
| Aug-14-2026 $117 call (bought) | 0 | 500 | +500 | 433 | ≈115% | ✅ OPEN (BTO) |
| Aug-14-2026 $118 call (sold) | 0 | 500 | +500 | 433 | ≈115% | ✅ OPEN (STO) |
Verdict: the one genuinely unresolved question is now answered — Trade 1 was an OPENING sale. We flagged it ⏳ provisional because 2,500 contracts printed against 3,655 already open, which made STO and STC equally consistent with the tape. Open interest rose by 2,253, or ≈90% of the print, so this was new short call inventory created, not a long position being sold out. That confirms the premium-collection read: someone opened a far-out, long-dated short call rather than exiting an old long. The two short-dated $117/$118 legs went from a literally empty strike (0 open interest) to 500 contracts — the cleanest possible open — and the Oct $300 put added more than double the flagged size as other buyers joined. All four legs: opening. No closes anywhere in this session's MRVL flow.
🤓 What This Actually Means — Plain English
Trade 1: selling a call 61% above spot, 2.5 years out. Someone collected $11.80M selling 2,500 January-2028 $300 calls at the bid — meaning a buyer with an existing position hit their price, or a market-maker facilitated a negotiated block. Because the size (2,500) sits below the prior open interest (3,655), the tape alone cannot prove whether this opened a new short call (STO — a very long-dated covered-call/overwrite, collecting income against a large existing long position) or closed out an existing long call (STC — someone who bought this call earlier in the year, possibly during the June run toward $310, taking profit now). Both are plausible reads: MRVL is up 112.4% YTD, so monetizing that run by selling far-OTM, multi-year calls is a rational income trade for a long-term holder; equally, a call bought near the June highs and sold now for $47.21 would represent a straightforward profit-take. We are not asserting either with confidence — the next-day OI print settles it.
Trade 2: the interesting one — a vertical that is not a bet on direction at all. Buying the $117 call and selling the $118 call, same expiration, same size (433 each), is a call vertical spread — but look at the pricing: $71.39 paid minus $70.42 collected is a net debit of just $0.97 on a full $1.00 strike width. When a two-leg same-right spread at adjacent strikes prices almost exactly at the strike width, that is the classic deep-in-the-money financing / "box-style" tell — both legs are so far in the money (spot ≈$188 versus $117/$118 strikes) that the spread's value at expiration is all but locked in at $1.00/share regardless of where MRVL trades between now and August 14. The combined delta on this package is +74 shares against roughly 43,300 shares of notional exposure per leg — statistically zero. This is not a bullish or bearish position; it behaves like a short-term loan collateralized by deep-ITM options, likely used for margin/collateral management or balance-sheet financing rather than a market view. Both legs are proven fresh opens (prior OI was zero on both strikes), so we know with certainty this is a brand-new position — we just can't (and shouldn't) read any market opinion into it.
Trade 3: a deep-in-the-money put, proven open, paired with an unseen stock leg. Buying 397 October-16 $300 puts at $114.60 when spot is ≈$190 means the put is already ≈$110 in the money — MRVL would need to more than double from here for this put to even approach being at-the-money. The size (397) cleared the tiny prior open interest (57), so this is a confirmed new position (BTO). Because the mechanism tag reads "stock+option combo," the option print is very likely one leg of a package that also includes a stock trade reported separately on the equity tape — commonly used to build a synthetic short, a protective collar, or a financing structure against a long stock or margin position. We did not independently re-pull the paired equity leg for this write-up, so treat the "hedge, not speculation" read as inferred, not proven — see Honest Limits below.
Bottom line on order types: Trade 1 is ⏳ provisional (STO or STC — unprovable today); Trade 2 is a confirmed-open, zero-delta financing vertical (BTO the $117 / STO the $118, both PROVEN_OPEN); Trade 3 is a confirmed-open long put (BTO, PROVEN_OPEN), likely hedge-adjacent given the combo tag.
📈 Technical Setup
YTD Chart
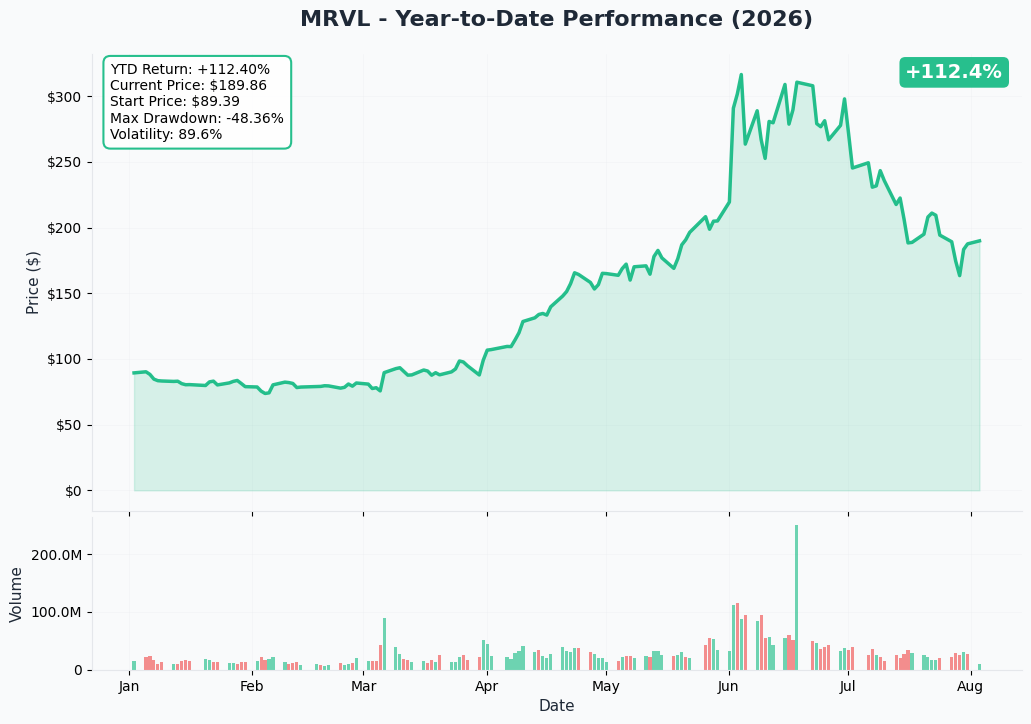
MRVL is +112.4% YTD, but the path was anything but smooth: a run to a closing high of $310.58 on 2026-06-18, a −47.4% peak-to-trough collapse to $163.40 by 2026-07-29 (MRVL's worst month since February 2001, alongside a broader semiconductor-sector rout — SOXX fell 27.4% in July, its worst month since September 2001), and then a sharp two-day rebound (+12.2% on 2026-07-30, +5.5% premarket on 2026-07-31) on hyperscaler capex commentary and AWS's disclosure of a $25B annualized custom-chip revenue run rate. As of early August the stock sits roughly 42-45% below its 52-week high of $329.88 even after the bounce — a name that has been violently two-sided in both directions this year, which is the context for why a long-term holder might be selling far-dated upside calls to bank some of the gain (Trade 1) while another account is putting on deep protective-style puts (Trade 3).
Gamma-Based Support & Resistance
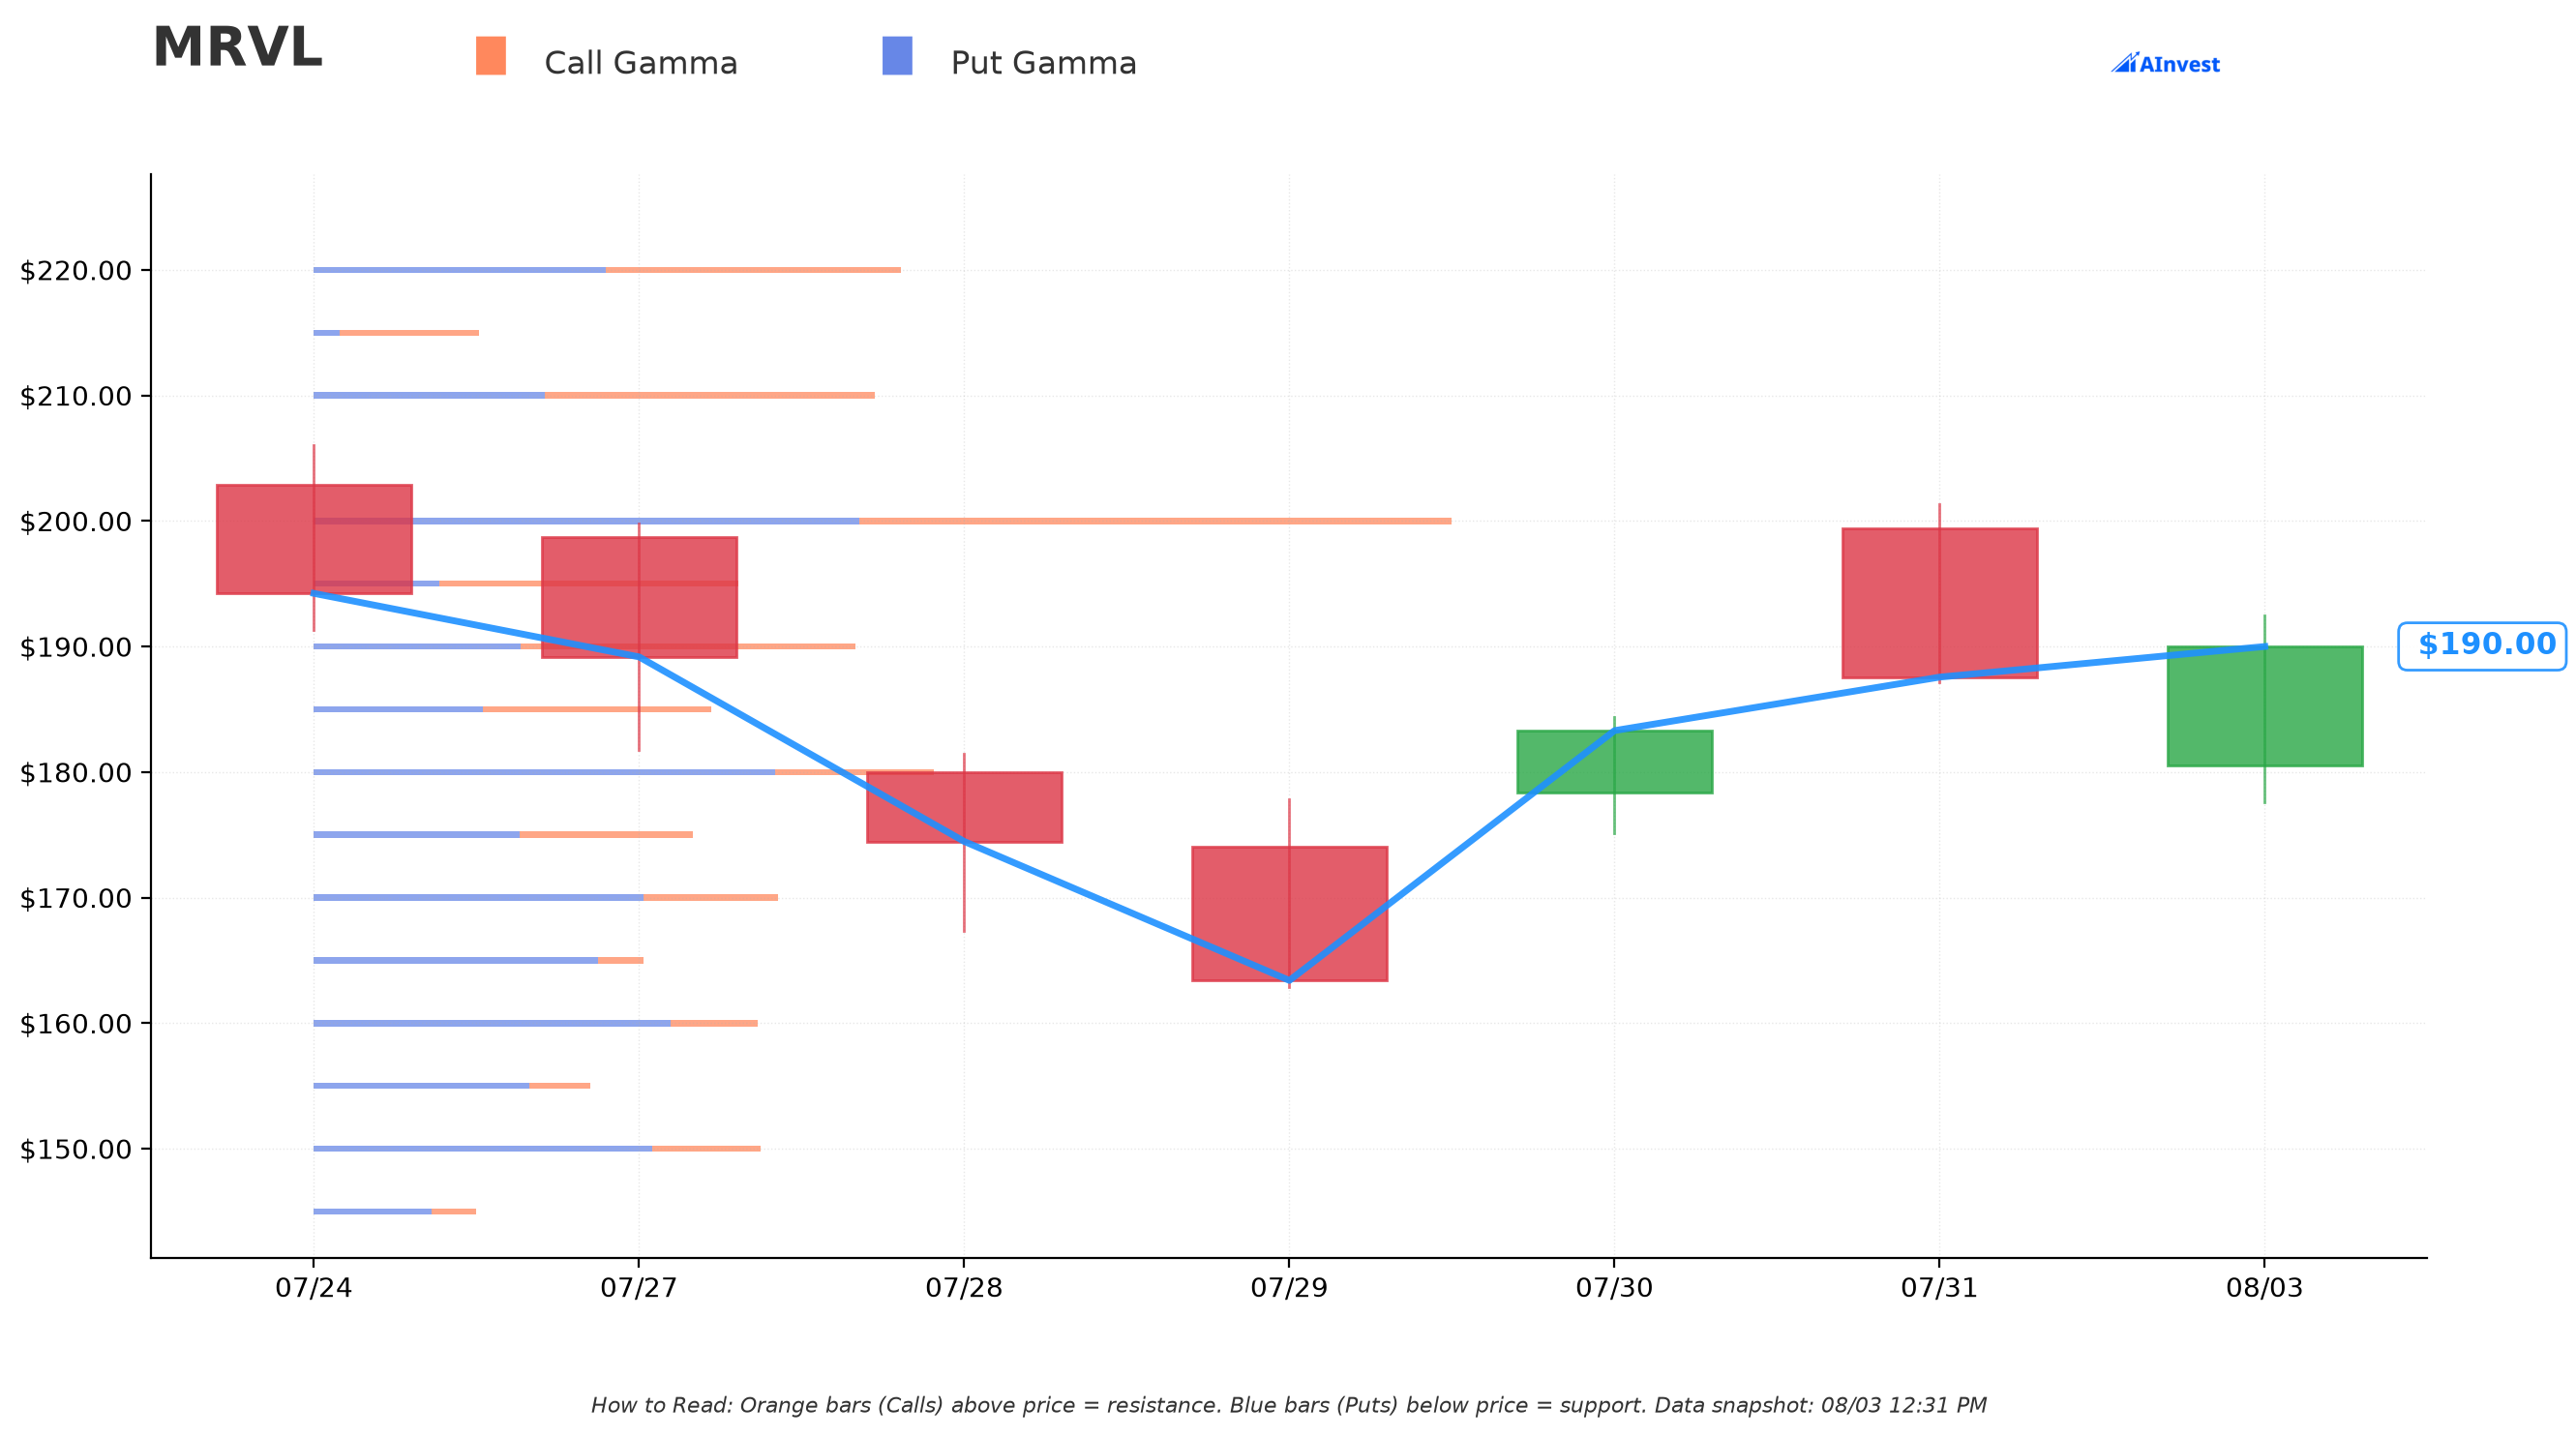
Reference spot for this gamma map: $190.00.
- Support: $180 (≈5.3% below spot) — moderate put-gamma concentration (≈$4.44B total gamma at the strike).
- Resistance: $195 (≈2.6% above spot) — moderate call-gamma concentration (≈$3.05B total gamma).
- Resistance: $200 — the strongest nearby level (≈5.3% above spot), tagged the Resistance Wall, with ≈$8.16B in total gamma, split roughly evenly between calls and puts. This is the level dealer hedging is most likely to lean against on a rally.
Reading the wider map: gamma below spot (down toward $150-$170) is heavily put-dominated (net-negative gamma), consistent with a market still pricing real downside tail risk after the July crash; gamma above $200 (especially $240 and $250) turns increasingly call-dominated, consistent with speculative upside interest re-building after the bounce. None of today's three MRVL trades sit anywhere near these near-dated gamma levels — the $117/$118 vertical and the $300 strikes are both well outside the gamma-relevant zone, reinforcing that Trades 1 and 3 are duration/hedge plays rather than near-term directional bets on the $180-$200 battleground.
Implied Move
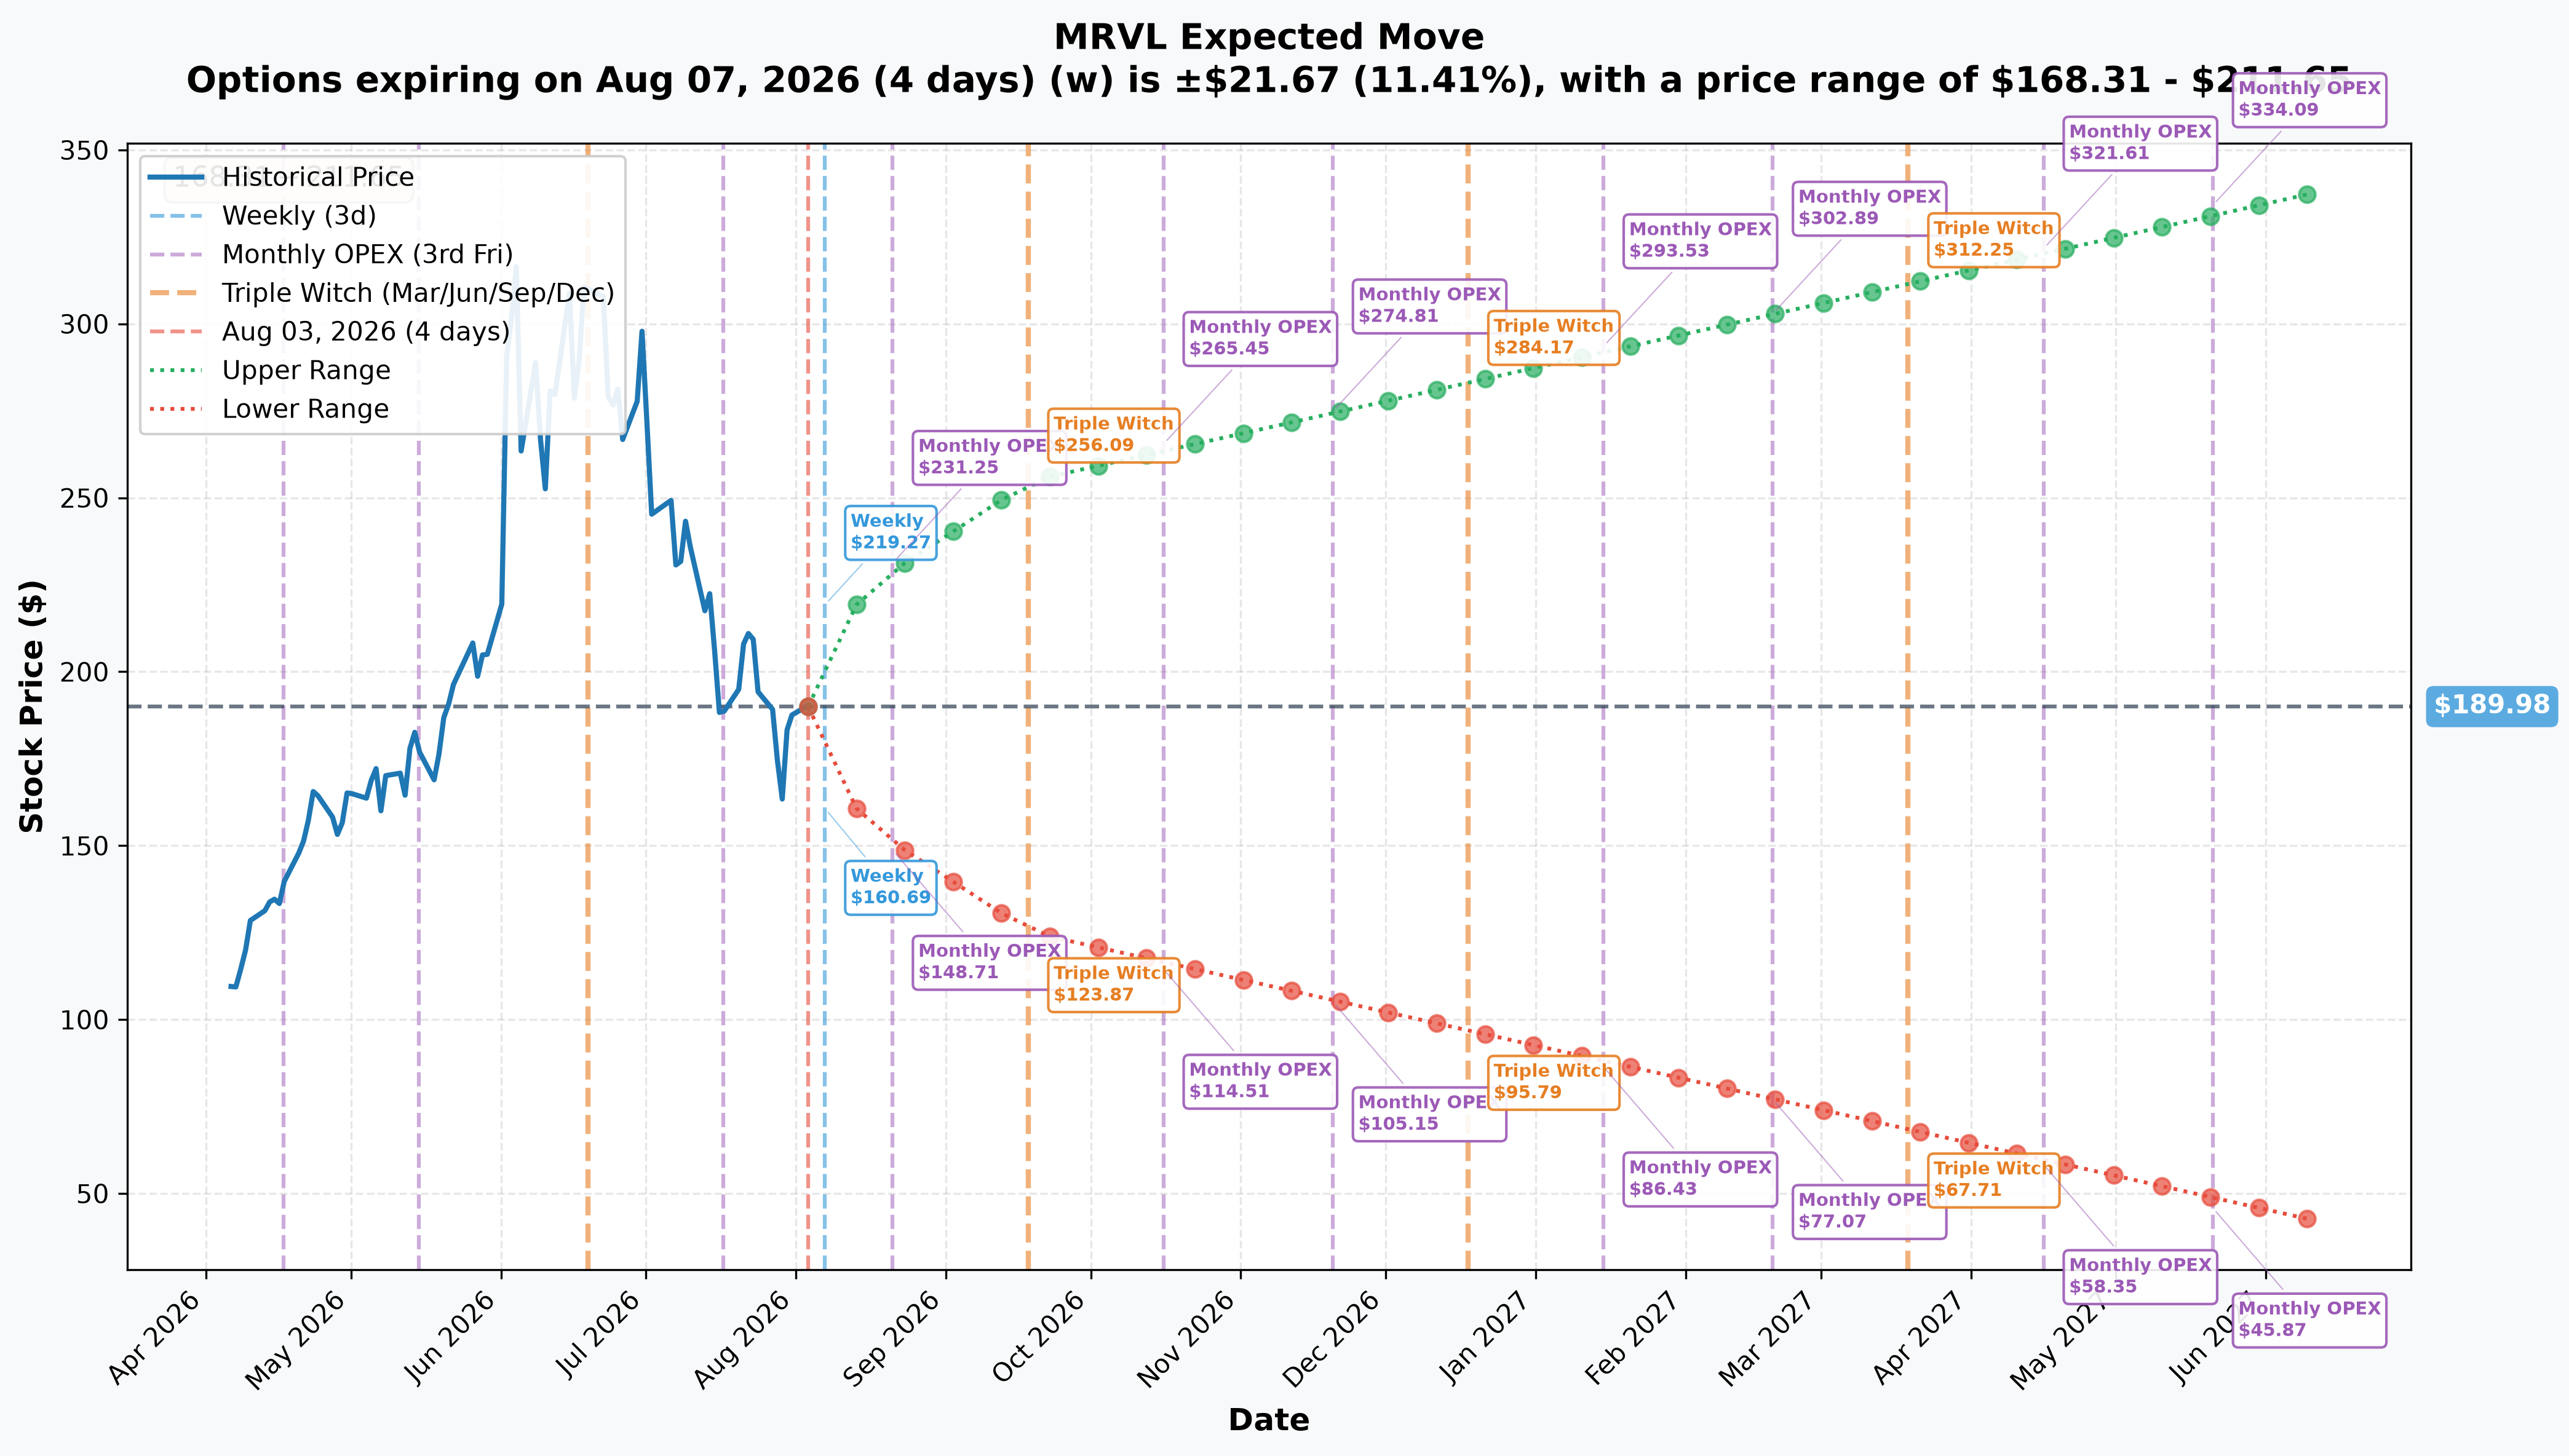
| Expiry | Days to expiry | Implied move | Range |
|---|---|---|---|
| Weekly (2026-08-07) | 4 | ≈11.4% (≈$21.67) | $168.31 – $211.65 |
| Monthly OPEX (2026-08-21) | 18 | ≈20.8% (≈$39.46) | $150.52 – $229.44 |
| Quarterly / Triple Witch (2026-09-18) | 46 | ≈34.1% (≈$64.86) | $125.12 – $254.84 |
| Yearly LEAPS (2027-06-17) | 318 | ≈78.8% (≈$149.73) | $40.25 – $339.71 |
The Aug-14 expiry used in Trade 2 isn't a labeled point on this curve — it sits between the weekly (Aug-07, ≈11.4%) and monthly-OPEX (Aug-21, ≈20.8%) readings, so the market is pricing something in the low-to-mid teens percent for that window. That confirms just how deep in the money the $117/$118 vertical is: even the high end of a plausible Aug-14 implied-down-move keeps spot nowhere close to those strikes, which is exactly why the package prices near its intrinsic width with near-zero delta.
The Jan-2028 expiry in Trade 1 is far beyond the longest horizon in this data (the 318-day yearly LEAPS reading) — we do not have a reliable implied-move number that far out, and note that as an honest limit rather than estimate one. What we do know: implied volatility here is elevated across every horizon (≈11% over 4 days alone), consistent with a stock that just posted a 45% monthly decline and a 12% one-day rebound.
⚡ Catalysts, Mapped to Each Expiry
🟡 Inside the Aug-14 expiry (Trade 2, the financing vertical) — no earnings inside this window
The next Marvell earnings date falls after this expiry, so Trade 2 carries zero earnings event risk by construction (which also reinforces why it prices as a flat financing structure rather than a volatility bet):
- FMS 2026, Aug 4-6, Santa Clara — Marvell's Booth #805 showcase (PCIe 6.0 SSD controller, CXL memory pooling, Octeon DPU, Photonic Fabric); VP Mark Kuemerle keynote on Aug 5 (Marvell press release). A product showcase, not a financial event — it historically does not move a stock this size materially.
- The Q2 FY2027 conference-call date announcement is likely due in this window too, based on the pattern from Q1 (announced 23 days ahead — Q1 call announcement).
- Continuation (or failure) of the late-July sector rebound — SOXX remains ≈23% below its June high even after bouncing.
🔴 Inside the Oct-16 expiry (Trade 3, the deep ITM put) — contains the next earnings print
- Q2 FY2027 earnings, estimated for 2026-08-27 — the date itself is vendor-estimated, not yet confirmed by Marvell (MarketBeat), but the guidance behind it is confirmed: $2.700B revenue (±5%) and $0.93 (±$0.05) non-GAAP EPS, ≈+34.6% YoY at the midpoint (Q1 FY2027 press release).
- This would also be new CFO Dan Durn's first guide since taking the role effective 2026-06-15 (CFO transition release) — a new-CFO first print carries its own idiosyncratic risk.
- Amazon's Trainium 3 production ramp is modeled for 2H 2026, i.e., inside this reporting window (Benzinga, Jul 14 2026).
- ⚠️ Boundary caution: the big hyperscalers' next quarterly capex updates (the kind that drove MRVL's +5.5% move on 2026-07-31) typically land in late October, likely just after the Oct-16 expiry — don't credit this expiry with that catalyst.
🔵 Inside the Jan-21-2028 expiry (Trade 1, the far-dated call sale) — a franchise-level trade, not a catalyst-window trade
This expiry sits ≈2.5 years out and is best read as a bet on (or income harvest against) Marvell's multi-year custom-silicon thesis rather than any single event:
- The FY2027 and FY2028 revenue outlook raise flagged by CEO Matt Murphy on 2026-05-27 (press release) — FY2028 ends just before this expiry.
- Google's custom LPU "Merope", sized by KeyBanc at $10-12B lifetime revenue on 2-3M units, launching 2028-2029 — largely after this expiry, so the LEAP captures the anticipation/design-win confirmation more than the revenue itself (Benzinga, Jul 14 2026).
- NVIDIA's $2B investment and NVLink Fusion partnership (press release) and the Polariton acquisition aimed at 3.2T+ optical interconnect (press release).
- Amazon's signed five-year custom-silicon agreement remains the anchor customer relationship this whole LEAP is a referendum on (Barchart).
- Consensus price targets cluster ≈$245-$271, roughly 29-43% above current levels, with zero Sell ratings across trackers (stockanalysis forecast · MarketBeat) — useful context for judging how far above consensus fair value the $300 short-call strike actually sits.
👥 Four-Reader Interpretation
🎲 YOLO trader: None of today's three MRVL trades is a good template to copy directly. The Jan-2028 call sale is a multi-year, wide-market, capital-intensive short that isn't practical to replicate at retail size; the vertical is a zero-delta financing structure with essentially no payoff to chase; and the Oct-16 put is already so deep in the money that buying it fresh here offers little leverage relative to its cost. If you want directional exposure into the Aug-14 or Oct-16 windows, note that implied volatility is already elevated (≈11% over just 4 days) — you'd be paying up for a move that may already be priced.
📊 Swing trader: The gamma map gives a cleaner near-term frame than any of today's trades: $180 support, $195-$200 resistance (with $200 the single strongest level) into the Aug-14 expiry, which carries no earnings risk. A range-bound approach between those gamma levels, with a plan to reassess ahead of the ≈Aug-27 estimated earnings date (which sits inside the Oct-16 expiry), is more directly actionable than trying to fade or follow any of the three prints above.
💰 Premium collector: Trade 1 is the instructive template — selling far-OTM, long-dated calls against an existing long position to harvest income after a large run (MRVL is +112.4% YTD). The catch: doing this 2.5 years out means committing to a strike that consensus targets (≈$245-$271) already sit well below, so the "insurance premium" you're giving up is real upside room if the custom-silicon thesis plays out. Also note the position here is ⏳ provisional open/close — if you're modeling this as a template, wait for OI confirmation on whether the $300 call was actually opened fresh or closed out.
🌱 Beginner: The best lesson in today's MRVL flow is Trade 2. When you see two options at adjacent strikes, same expiration, same right, trading against each other for a net price that's almost exactly equal to the distance between the strikes ($0.97 versus a $1.00-wide spread here), that is a sign the position has no real directional opinion baked in — it behaves more like a short-term loan than a bet on the stock. Not every big options print is a signal about where a stock is headed; some are just financing plumbing. Combined with the fact that Trade 1's open-or-close status is genuinely unknowable until tomorrow's OI print, this is also a good reminder that "big money did something" doesn't always translate to "big money has a strong opinion."
⚠️ Honest Risk & Limits
- Trade 1's open/close status cannot be proven from today's tape. Size (2,500) is below prior open interest (3,655) — it could be a fresh short call (STO) or a partial close of an existing long call (STC). We are explicitly not asserting either; only the next-day OI print resolves it.
- Trade 3's paired equity leg was not independently re-pulled for this analysis. The mechanism tag (stock+option combo) strongly implies a stock-side leg exists on the NMS tape, but we did not verify its size or direction here — treat the "likely hedge-related" framing as inferred, not proven.
- The tape cannot tell us broker, counterparty identity, order ID, or any invisible stock/futures hedge sitting behind any of these three trades. What looks like a pure financing vertical (Trade 2) could still be one leg of a larger book we can't see.
- Price volatility caveat: two independent live sources disagreed by roughly 5% on MRVL's intraday price on 2026-08-03 (one showing +1.67%, another showing −3.06% from the prior close). We used the spot prints embedded directly in each trade's own tape record ($186.70–$190.29) as the ground truth for this write-up.
- The Q2 FY2027 earnings date (2026-08-27) is a data-vendor estimate, not a Marvell-confirmed date as of this writing — if it shifts, the Aug-14-vs-Oct-16 catalyst split described above would need to be revisited.
- Options trading involves substantial risk of loss and is not suitable for all investors. Deep-in-the-money options, long-dated LEAPS, and multi-leg structures each carry their own liquidity, assignment, and pricing risks that this write-up does not fully quantify. Nothing here is a recommendation to buy or sell any specific position — it is a forensic read of what printed on the tape today.
Come back tomorrow pre-market (≈06:30 ET) for the next-day open-interest update, which will resolve whether Trade 1 opened a new short call or closed an existing long one.
Last updated: August 4, 2026 — next-day OPRA open-interest resolution added (✅ RESOLVED box above). Original analysis published August 3, 2026.