🤝 NBIS — $20M Deep-ITM Call Cross Is Delta-Hedged Financing, Not a Bullish Bet
Published: 2026-06-17 | Last updated: 2026-06-18 | Nebius Group (NBIS)
✅ Updated 2026-06-18 — OPEN CONFIRMED (fresh, but non-directional): Next-day OPRA OI on the Dec-2028 $180C rose 5,857 → 6,854 (Δ +997), matching the 1,000-lot print — a confirmed fresh open of the deep-ITM call leg. But this remains a delta-hedged synthetic-put / financing package (paired with a short-stock block), so it is NOT a bullish call. The fresh-open verdict is settled; the non-directional read stands. See the ✅ RESOLVED box below.
Quick Take
A $20M deep-ITM December 2028 $180 call block crossed in NBIS at 11:13 ET. On a screenshot it reads like a massive bullish bet. It is not. The options tape shows it printed as a negotiated block cross — a broker matched a buyer and seller off the open book — and 315 milliseconds later an 88,000-share NBIS stock block traded at $280.75 carrying a Qualified Contingent Trade marker. That is the delta hedge. Computing the call's delta independently from its price (implied volatility ≈108%) gives 0.879 — meaning 1,000 contracts × 100 shares × 0.879 = 87,900 shares needed to neutralize directional exposure. The actual stock block was 88,000 shares: a 0.07% match. Long deep-ITM call plus short ≈88,000 shares is a delta-neutral synthetic / financing package. There is no net directional bet here.
Company Overview
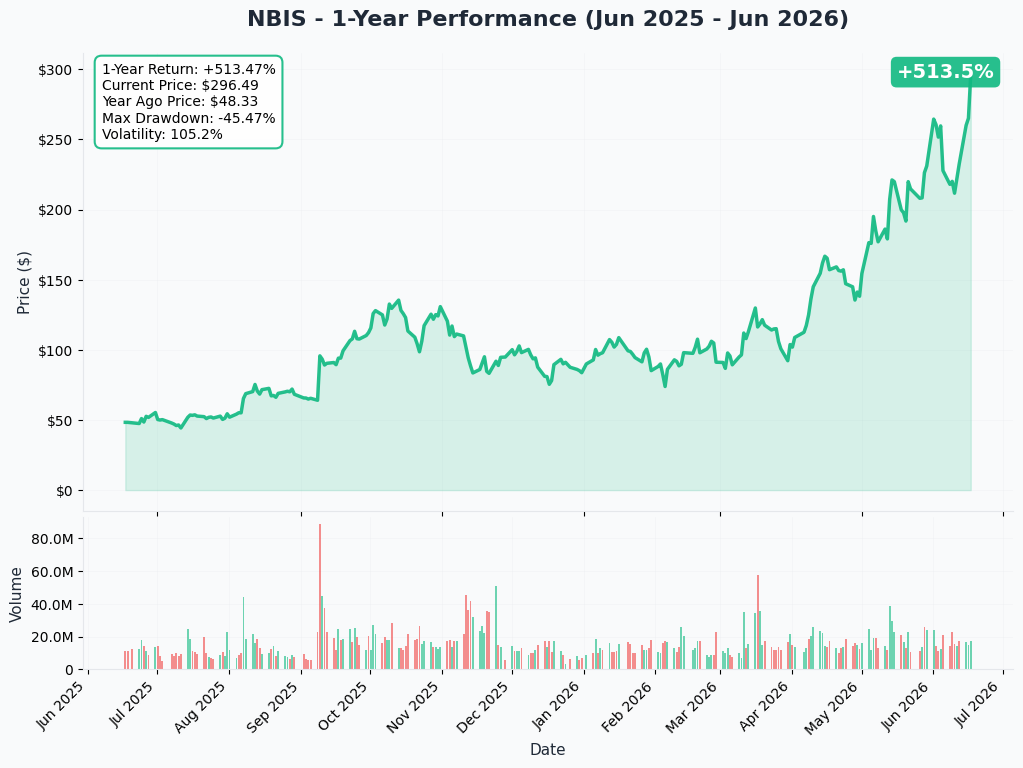
Nebius Group (NBIS) is an Amsterdam-headquartered AI-cloud and GPU-infrastructure company ("neocloud") listed on Nasdaq. It provides GPU compute capacity, platform software, and inference services, competing directly with CoreWeave (CRWV) and serving hyperscalers including Microsoft and Meta as customers. In Q1 2026 Nebius reported revenue of $399M, up 684% year-over-year, swung to a positive adjusted EBITDA of $129.5M, and holds a contracted backlog of roughly $44–46B across its two anchor customers. The stock has run approximately +160% year-to-date through June 17, 2026, and is set to join the Nasdaq-100 effective June 22, 2026. The current price trades above the average sell-side price target, reflecting a hyper-premium valuation on a still-scaling revenue base.
The Trade
Options Leg
| Field | Detail |
|---|---|
| Date / Time | 2026-06-17 / 11:13:18 ET |
| Buy / Sell | BUY |
| Call / Put | CALL |
| Expiration | December 15, 2028 |
| Strike | $180.00 |
| Volume | 1,000 contracts |
| Open Interest (prior day) | 5,900 contracts |
| Option Price | ≈$198.55 / contract |
| Gross Premium | ≈$20,000,000 |
| Spot at Print | ≈$280.75 |
| Intrinsic Value | ≈$100.75 (deep in-the-money) |
| Execution Type | Negotiated block cross (known counterparty, off-book) |
| Order Type | BTO (delta-hedged financing) — ✅ confirmed fresh open (next-day OI +997); non-directional |
| Option Symbol | NBIS20281215C180 |
Paired Stock Hedge Leg
| Field | Detail |
|---|---|
| Time offset | +315 milliseconds after the call cross |
| Direction | SHORT (sold) |
| Shares | 88,000 |
| Price | $280.75 |
| Gross notional | ≈$24.7M |
| Equity tape marker | Qualified Contingent Trade (QCT) — contingent on the options leg |
| Hedge-ratio check | Delta 0.879 × 1,000 × 100 = 87,900 shares needed; actual 88,000 = 0.07% deviation |
The QCT designation on the equity tape is the standard regulatory marker for a stock block that is contingent on a simultaneous options transaction. It confirms the two legs are mechanically linked — not coincidental.
✅ RESOLVED — Next-Day OI Confirms a Fresh (Non-Directional) Open (2026-06-18)
| Leg | Pre-print baseline (EOD 2026-06-16) | Resolving (EOD 2026-06-17) | Δ | Verdict |
|---|---|---|---|---|
| Dec-2028 $180C | 5,857 | 6,854 | +997 | ✅ OPEN confirmed (fresh) |
The next-day OPRA open-interest snapshot settles the open/close question. OI on the December 2028 $180 call rose +997 contracts (5,857 → 6,854), almost exactly matching the 1,000-lot trade size — confirming a brand-new opening of the deep-ITM call leg, not a partial close of an existing position.
But the open being confirmed does not make this a bullish bet. The leg printed as a deep-ITM call cross paired 315 ms later with a short-stock hedge block (Qualified Contingent Trade), and the call's independently computed delta of 0.879 matches the 88,000-share short to within 0.07%. That is a synthetic-put / financing package — delta-neutral and non-directional. So the resolved verdict is: the call leg was freshly opened, but the overall structure remains a hedging / financing trade with effectively zero directional content. The open/close question is resolved (OPEN); the non-directional interpretation is unchanged.
🤓 What This Actually Means — Plain English
Why would a desk buy a $20M deep-ITM call and immediately short 88,000 shares?
When a call is so far in-the-money — the $180 strike is about $100 below today's $280 price — it behaves almost identically to owning the stock. Its delta of 0.879 means that for every $1 the stock moves, the call gains or loses about $0.88. Shorting 88,000 shares neutralizes that sensitivity: the gain on one side offsets the loss on the other, leaving a position that is essentially directionally flat.
So what is the point? Several legitimate institutional motives fit:
- Synthetic exposure / balance-sheet financing. The desk gains long-dated exposure to NBIS through the call at a fraction of the outright share cost (the call is bought with a premium, not the full ≈$28,000 per 100-share block notional). The short-stock leg earns the "stock rebate" (interest on the short proceeds), which can offset the cost of carry on the call. The net result is economic exposure similar to owning stock, financed more efficiently through the options market.
- Synthetic-put creation. Long deep-ITM call + short stock = synthetic long put. A desk that wants to earn premium from selling that synthetic put to a counterparty uses this structure without carrying outright directional risk.
- Delta-hedged market-making or facilitation. An options desk that bought this call from a client would immediately short shares to flatten its own book. The cross mechanism confirms both sides had pre-agreed on price — the broker assembled a buyer and a seller before printing.
In all cases: the desk running this structure is not expressing a view that NBIS goes up. It is positioning for financing economics, optionality pricing, or client facilitation — mechanisms that work whether the stock rises, falls, or goes sideways.
What the tape shows: negotiated block cross (call leg) + Qualified Contingent Trade block (stock leg, 315 ms later) + delta match to within 0.07%. Three independent confirmations of delta-hedged, non-directional intent. This is not a whale loading up on NBIS calls.
Technical Setup
Gamma Support / Resistance Levels
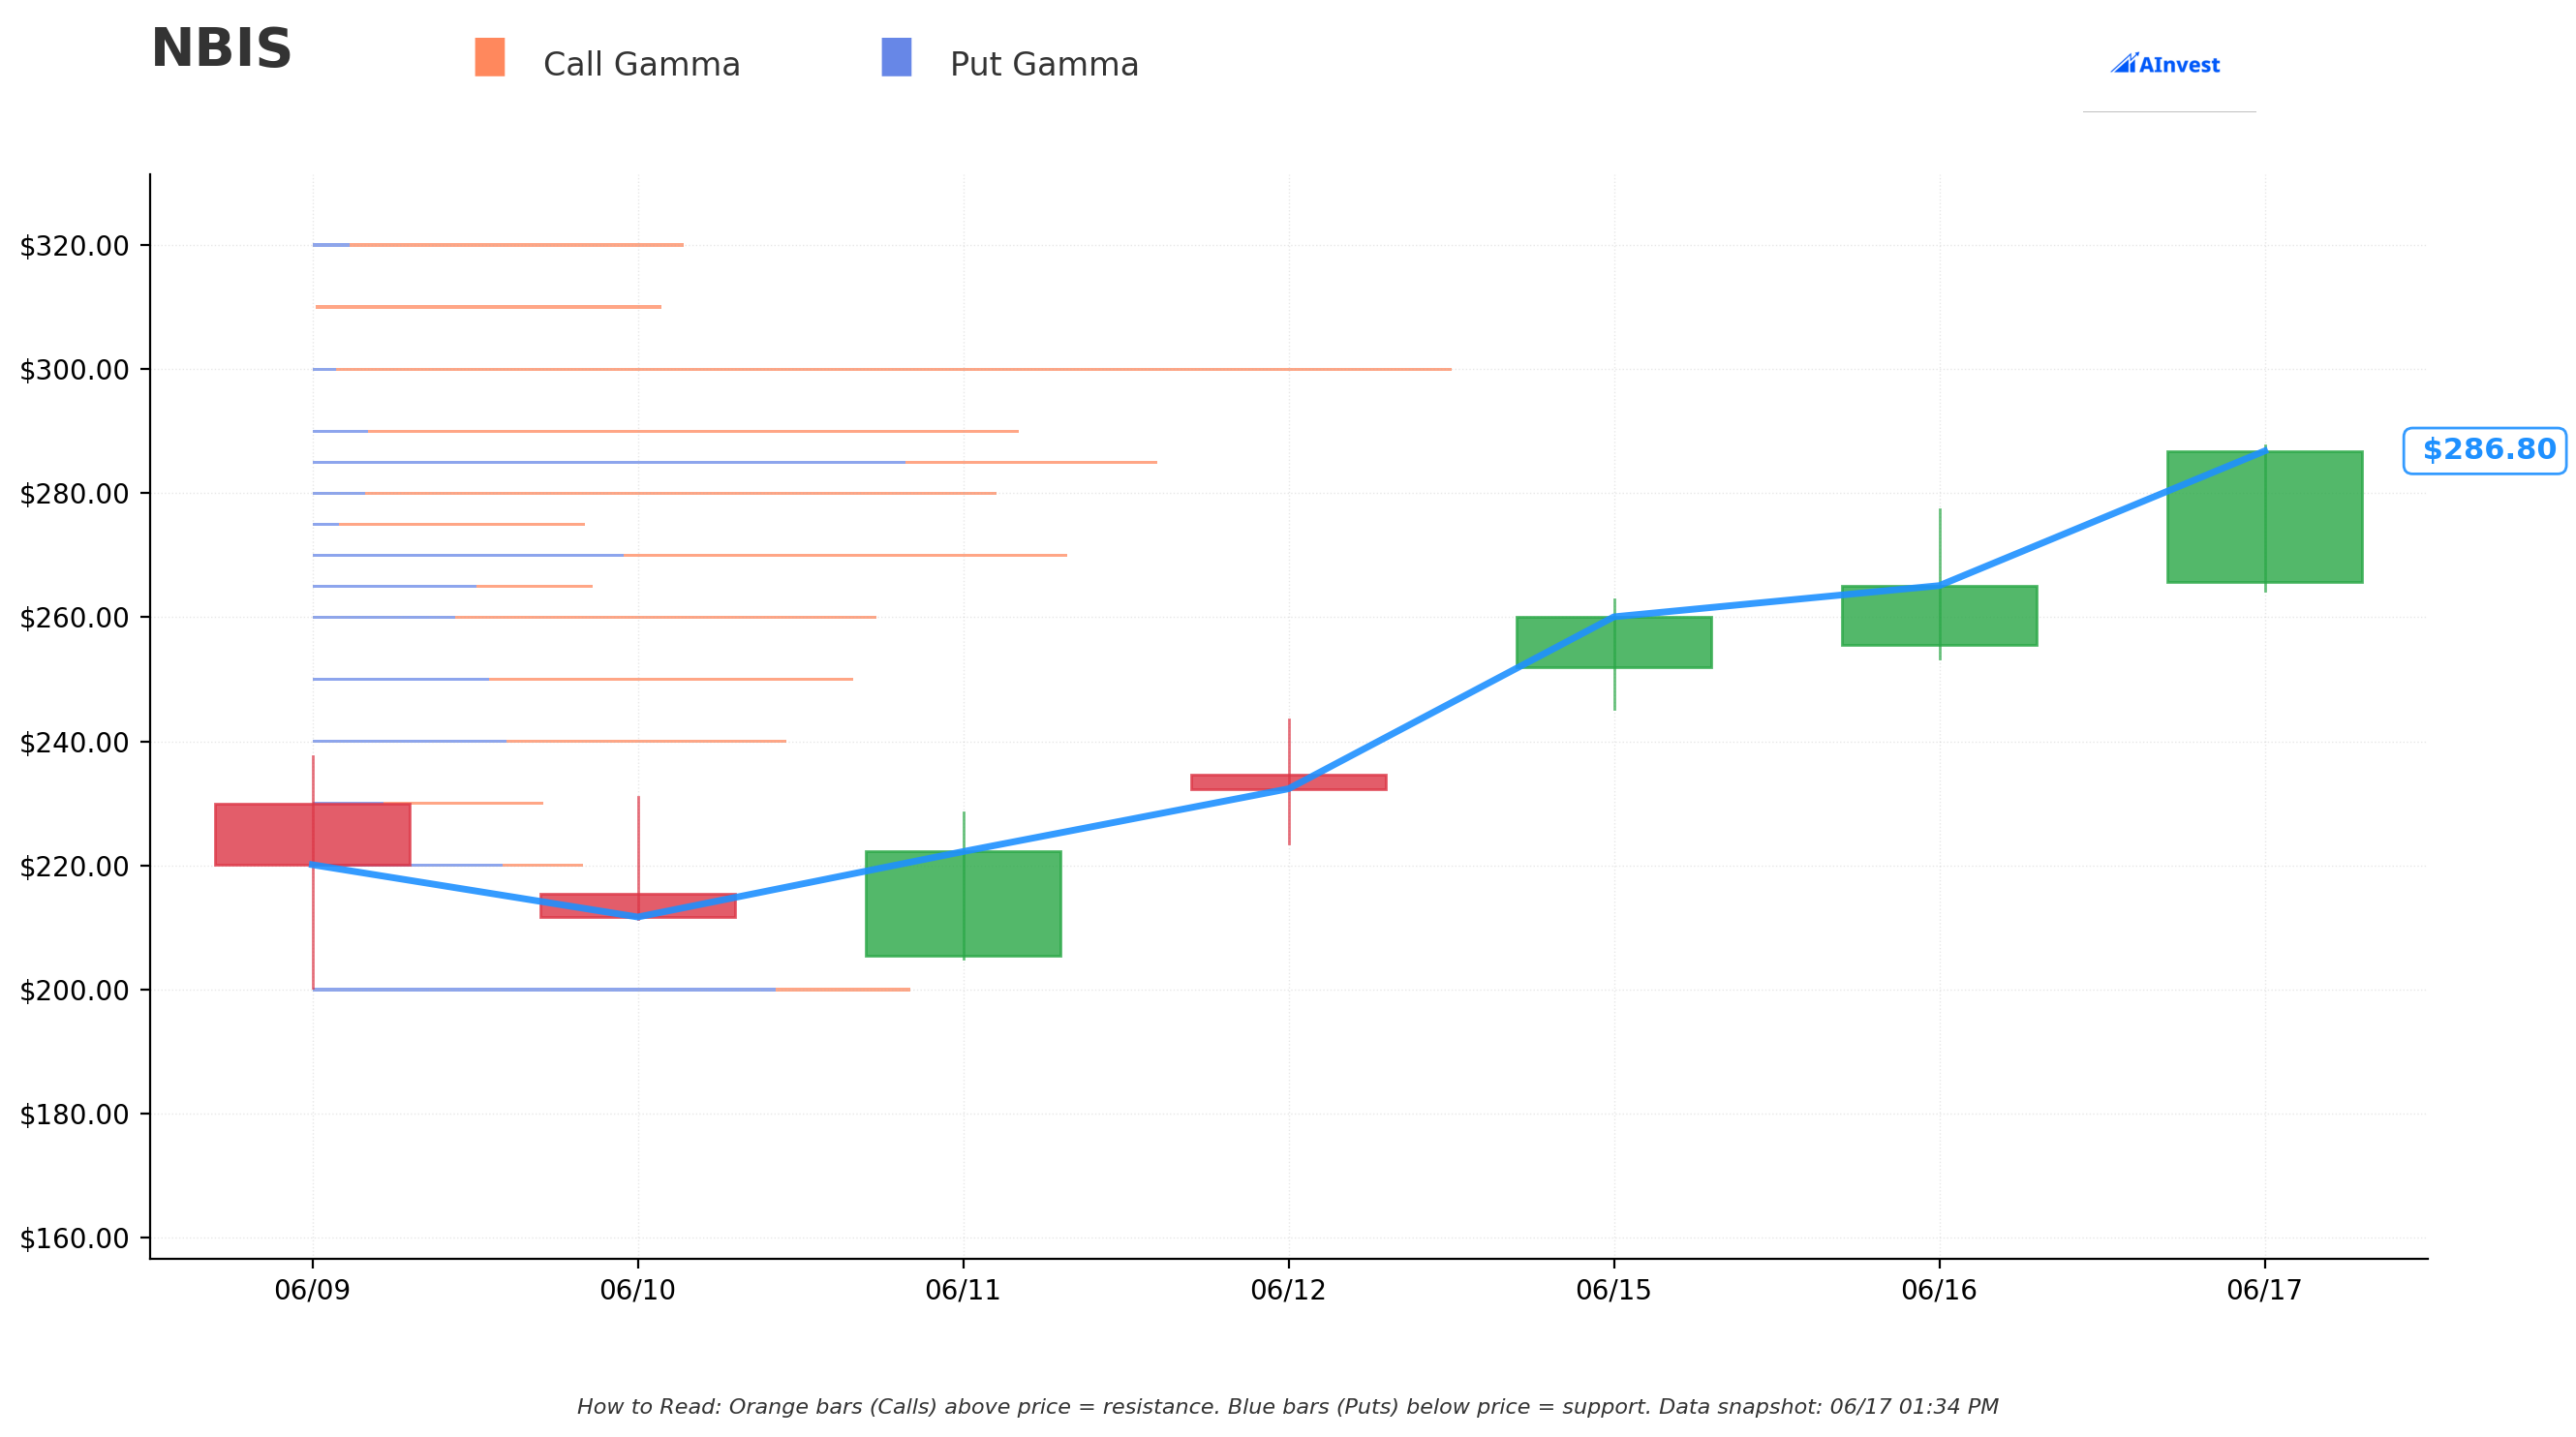
From the gamma exposure data (spot ≈$286.9 at model run):
Nearby levels with meaningful gamma concentration:
| Strike | Character | Distance from Spot | Notes |
|---|---|---|---|
| $285.0 | Mixed (net put-heavy) | ≈0.7% below | Highest total GEX near spot (2.34); net negative — put gamma dominates, acts as local support |
| $287.5 | Call-heavy | At spot | Thin; spot is essentially straddling the $285–$290 gap |
| $290.0 | Call-heavy resistance | ≈1.1% above | Strong call GEX (1.78); market-maker hedging activity likely adds friction above this level |
| $280.0 | Call-heavy | ≈2.4% below | Large call GEX (1.74); positive net — tends to act as support via MM delta hedging |
| $300.0 | Call-wall resistance (moderate) | ≈4.6% above | The only resistance level formally identified; 3.15 total GEX, almost entirely calls |
| $270.0 | Call-heavy | ≈5.9% below | 2.09 total GEX; positive net — a deeper support shelf |
| $260.0 | Call-heavy | ≈9.4% below | 1.56 total GEX; positive net |
Key takeaway: The gamma profile shows no formal support levels below spot (the model returns an empty support list), but the $280 and $270 strikes carry substantial positive net call gamma that tends to act as magnetic/dampening support. Above spot, $290 is the first friction point and $300 is the only model-identified resistance. In a high-IV name like NBIS, gamma walls can be breached rapidly — treat these as areas to watch rather than hard floors or ceilings.
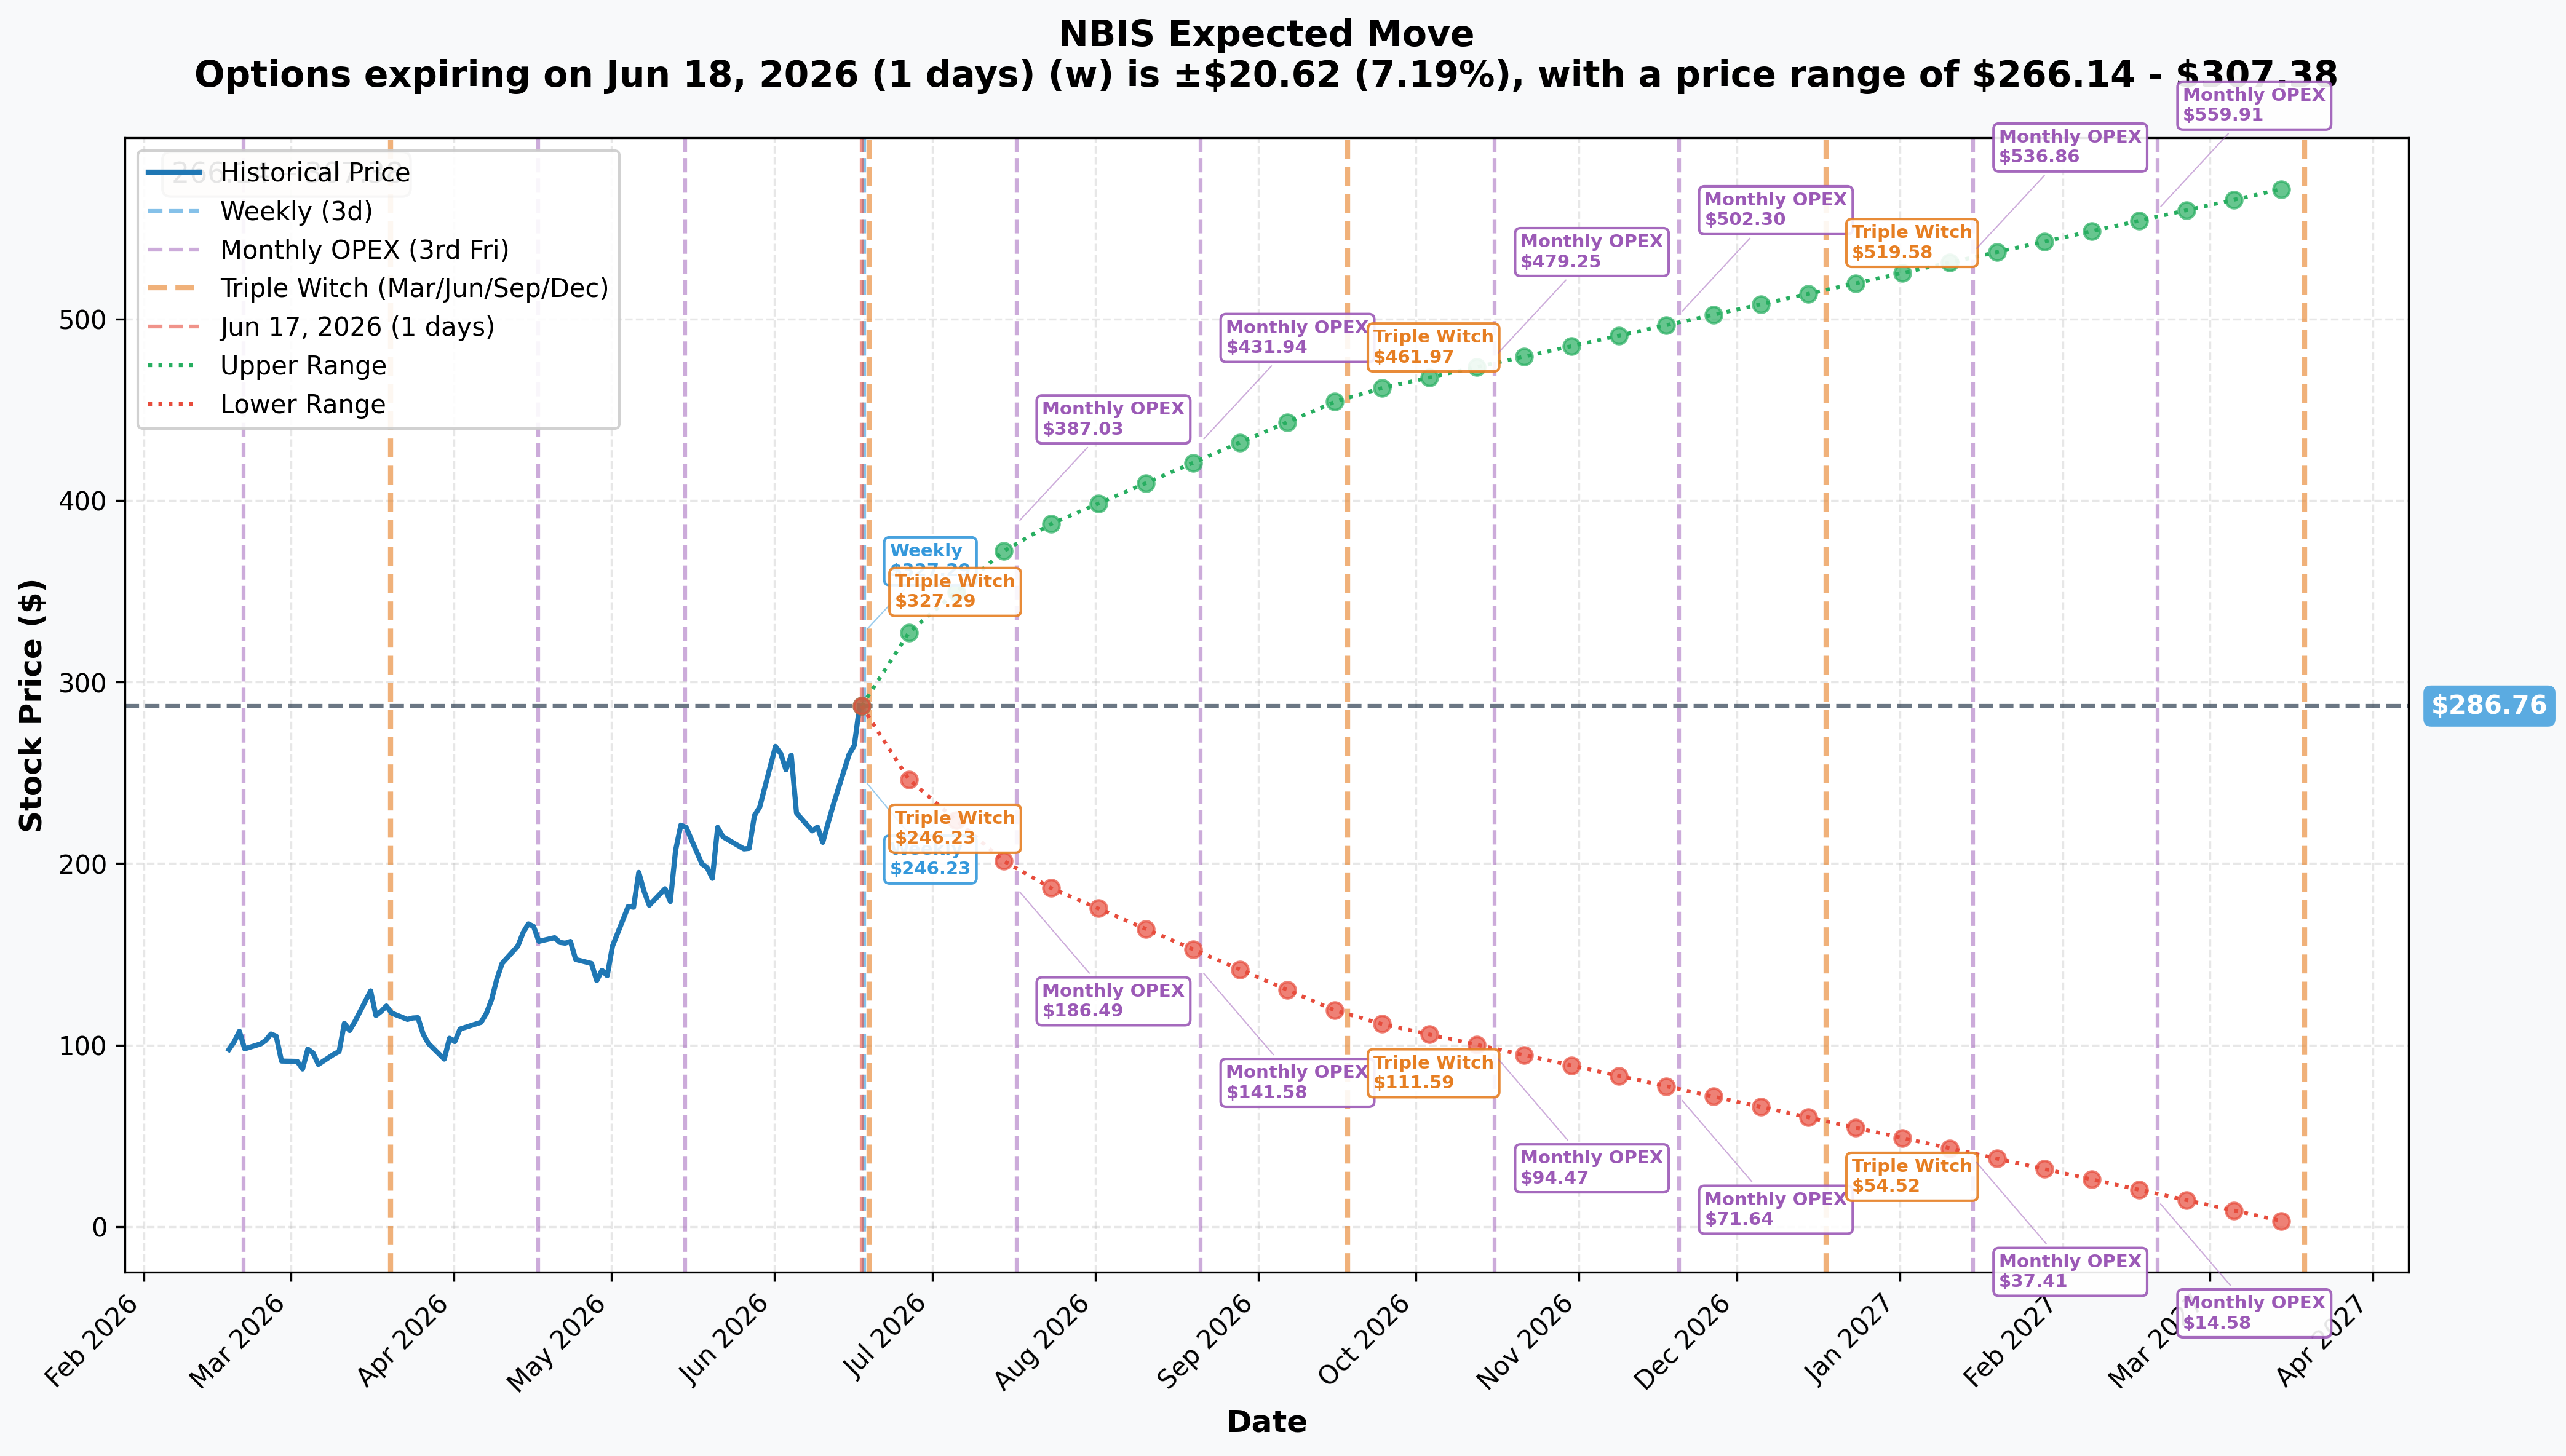
Implied Move Ranges (from options pricing, as of June 17)
| Horizon | Expiry | Implied Move (%) | Upper Range | Lower Range |
|---|---|---|---|---|
| This week (1 day) | June 18, 2026 | ±7.2% | $307.38 | $266.14 |
| Monthly OPEX | July 17, 2026 | ±32.4% | $379.55 | $193.97 |
| Quarterly | September 18, 2026 | ±59.8% | $458.13 | $115.39 |
| LEAPS (9 months) | March 19, 2027 | ±100.4% | $574.63 | $0 (floor) |
NBIS implied volatility is extreme by any standard — a ±7% single-week range and a ±32% monthly cone reflect both the stock's recent parabolic run (+160% YTD) and the implied-volatility demand from the Nasdaq-100 inclusion rebalance underway. The December 2028 call in today's trade was priced at ≈108% implied volatility. These wide cones confirm that the options market is pricing NBIS as a high-uncertainty, high-beta name — useful context for understanding why a sophisticated desk would use options structures (rather than outright stock) to manage long-dated exposure.
Catalysts (Backdrop for the Name)
These are general context for NBIS as a company, not confirmation of the flagged trade's thesis — remember, the trade is non-directional.
Recent (last ≈3 months)
-
Q1 2026 earnings (reported May 13): Revenue $399M, up +684% YoY, beat consensus per Futurum Group. AI-cloud revenue grew to $389.7M (+841% YoY). Adjusted EBITDA swung to +$129.5M (from −$53.7M a year earlier). FY2026 guidance: revenue $3.0–3.4B, ≈40% adj. EBITDA margin, ARR exit target $7–9B; capex raised to $20–25B per Futurum Group.
-
Microsoft contract (≈$19.4B multi-year): Access to 100,000+ Nvidia GB300 chips; contract cash flows help finance capex via secured financing per The Motley Fool and Nebius newsroom.
-
Meta contract ($12–15B over five years): Dedicated AI infrastructure beginning deployment early next year; current available capacity reported sold out per Data Center Dynamics.
-
Eigen AI acquisition (closed June 10, 2026): ≈$643M deal (inference + model optimization) per SEC Form 6-K.
-
Bloom Energy power deal: Up to $2.6B in service fees for ≈250 MW of guaranteed power — addresses the binding constraint in AI buildout per StocksToTrade.
-
UK expansion: £1.7B across three Nvidia deployments targeting ≈65 MW by 2027 per StocksToTrade.
-
Financing raises: ≈$4.34B in convertible senior notes (March 2026) and an additional $1B convertible private placement per SEC Form 6-K and Nebius newsroom.
Upcoming
-
June 22, 2026 — Nasdaq-100 inclusion takes effect. Passive index and ETF funds managing $800B+ must hold NBIS; mechanical demand tailwind, though much of this may already be priced in the mid-June surge per Nasdaq IR and Foreign Policy Journal.
-
≈Late August 2026 (estimated) — Q2 2026 earnings. Not yet formally dated; the window is modeled from prior cadence per Market Chameleon. Key watch items: ARR trajectory vs. the $7–9B exit target, EBITDA margin durability, capex pace vs. the $20–25B plan, and connected-capacity ramp toward 800 MW–1 GW.
-
H2 2026 — capacity ramp milestones. Build-out of the 1.2 GW Pennsylvania AI factory, Bloom ≈250 MW power, and UK ≈65 MW sites; any new hyperscaler deal would be a fresh catalyst per Data Center Dynamics.
-
Late 2026 — first Nvidia Vera Rubin NVL72 deployments. Being among the first clouds to deploy next-generation Nvidia silicon is both a competitive milestone and a sentiment lever per Data Center Dynamics.
-
Ongoing — convertible / equity dilution overhang. The $20–25B capex plan implies continued external capital raises on top of the existing converts; dilution risk is structural per Futurum Group.
4-Reader Interpretation
YOLO / short-term trader
Do not use this trade as a signal to buy NBIS calls. A delta-hedged cross generates zero directional pressure on the underlying. The desk that bought the call simultaneously shorted 88,000 shares — canceling any bullish flow. If you are bullish NBIS into the Nasdaq-100 rebalance (June 22), that is a separate thesis supported by the fundamental backdrop, not by this print.
Swing trader (days to weeks)
The Nasdaq-100 inclusion on June 22 is the nearest concrete catalyst. Passive funds that replicate the index must buy NBIS before the open that day, creating mechanical demand. However, a meaningful "buy-the-rumor" bid has already been building since the announcement (the stock ran ≈12.9% in after-hours on the inclusion news). Mean-reversion risk post-June 22 is real — "sell-the-news" dynamics are common after index-inclusion surges. The gamma data shows $290 as the first friction level above current spot and $280–$285 as near-term support. The weekly implied-move cone (±7.2%) puts the one-day range at approximately $266–$307.
Premium collector / options seller
Implied volatility near ≈108% on the December 2028 contract is elevated even for a high-beta growth name. The wide monthly (±32%) and quarterly (±60%) implied-move cones suggest the market is pricing substantial uncertainty — which cuts both ways. Selling premium here means collecting rich time value but facing outsized mark-to-market swings if the stock continues its parabolic behavior. The name is above the average sell-side target (≈$244) at ≈$268–287, leaving compression risk if sentiment rotates.
Beginner
A desk just paid $20M for call options on NBIS — but that does not mean they think the stock is going up. They immediately shorted nearly 88,000 shares to cancel out any directional bet. Think of it like buying car insurance while agreeing to pay any accident costs: the two sides offset each other. What remains is a complex financing and positioning structure that professional trading desks use to manage exposure on their balance sheets. The headline dollar amount looks dramatic, but the actual directional content of this trade is effectively zero.
Honest Risk / Limits — What the Tape Cannot Prove
- Counterparty identity and motive are unknown. The tape confirms the structure (call cross + QCT stock block + delta match) but cannot reveal who the desk or counterparty is, what their broader book looks like, or whether they hold other NBIS positions that change the net directional exposure.
- The 0.07% delta-hedge match is very tight but not mathematically perfect. A 100-share round lot requires exactly 87,941 shares at delta 0.879; 88,000 shares was used. The difference (59 shares) is well within normal rounding for institutional execution. The structural read (non-directional financing) is robust.
- The open/close classification is now RESOLVED. Next-day OPRA OI confirmed a fresh open — OI on the Dec-2028 $180C rose +997 (5,857 → 6,854), matching the 1,000-lot print (see the ✅ RESOLVED box above). This was a new opening of the call leg, not a partial close. Either way the directional implication is unchanged: the structure remains a delta-hedged synthetic-put / financing package and is non-directional.
- Implied volatility of ≈108% is model-dependent. The Black-Scholes delta calculation uses this IV as an input; if the desk used a different pricing model or vol surface, the precise hedge ratio might differ slightly. The QCT marker and 315 ms timing are the tape-level confirmations independent of any model.
- No information about the full package. Institutional desks often layer delta hedges across multiple instruments (futures, ETFs, correlated names). The 88,000-share short is the single visible stock hedge — there could be offsetting positions elsewhere that change the net exposure entirely.
- Catalysts are context, not confirmation. The Nasdaq-100 inclusion, Microsoft/Meta contracts, and earnings growth are real and material, but they describe the company, not the intent of this specific non-directional trade.
Article generated: 2026-06-17. ✅ Last updated: 2026-06-18 — next-day OPRA OI confirmed a fresh open on the Dec-2028 $180C (5,857 → 6,854, Δ +997); still a non-directional delta-hedged financing package.
Options trading involves substantial risk of loss and is not suitable for all investors. This analysis is for informational purposes only and does not constitute a recommendation to buy or sell any security.