🤝 NET $4.67M "Bull Call Spread" — Probably Convertible-Bond Hedging, Not a $450 Bet
📅 2026-08-12 | 🤝 Stock-and-Options Cross Detected
✅ Updated 2026-08-13 pre-market — the next-day OPRA open interest confirmed both legs opened, essentially on the published numbers. The $450 call rose 0 → 1,001 (+1,001) from literal zero against a predicted ≈1,000, and the $300 call rose 175 → 1,135 (+960) against a predicted ≈1,175. Both BTO / STO labels stand. See the ✅ RESOLVED box.
🎯 The Quick Take
A desk crossed 1,000 June-2027 $300 calls against 1,000 June-2027 $450 calls on Cloudflare, Inc. (NYSE: NET) — a bull call spread for a ≈$4.67M net debit — but it printed as a stock-and-options cross, meaning shares traded alongside the options as one package. Cloudflare priced a $2.175 billion 0% convertible note just one day earlier (August 11, 2026), settling one day later (August 13); the timing, the paired equity leg, and the size together make convertible-related hedging flow the best-evidenced explanation — not "someone thinks Cloudflare goes to $450." The option structure alone does not express a clean directional view. It's the third trade of this exact stock+options shape on today's board, alongside CRWV and HUM — worth noting as a pattern, not a coincidence.
💰 The Option Flow Breakdown
📊 What Just Happened
Cloudflare — the connectivity-cloud company behind a huge share of the internet's CDN, DDoS protection, zero-trust security and now its "agentic internet" infrastructure — is a ≈$110.5B company trading at ≈44x trailing sales and a ≈210x forward P/E, among the richest multiples in infrastructure software. Cloudflare runs a global network that sits in front of customer applications, handling content delivery, application performance, DDoS/web-app security, zero-trust network access, and its Workers developer-compute platform, where customer code runs directly on Cloudflare's edge. Founded in 2009, headquartered in San Francisco, led by co-founders Matthew Prince (CEO) and Michelle Zatlyn (President); the listed security is the Class A share on NYSE. We could not verify the Class A/Class B voting-ratio or founder voting-control percentage from an accessible source — the underlying research flagged this as a disclosure gap, so we're not asserting "founder super-voting control" as fact here.
Sector/industry: Technology — Software Infrastructure. Shares outstanding ≈356.08M; enterprise value ≈$109.9B; net cash ≈$633M.
The growth is real, and it's accelerating rather than fading: Q2 2026 revenue of $696.1M, +36% year over year — the fastest growth print in years — beat consensus non-GAAP EPS ($0.29 vs $0.2684), and management raised full-year guidance for the second time this year. The stock is +≈55.7% year-to-date in 2026, on top of +75.2% in 2025. So this is a name that has already more than doubled over two years and trades at a valuation priced for perfection — but one that keeps delivering acceleration, not deceleration.
The other half of the story, though: the growth is getting more expensive to produce. Free-cash-flow margin fell from 13% in Q1 2026 to 8% in Q2 2026, gross margin has compressed ≈475 basis points since FY2024 (77.3% → 71.8% GAAP), and the GAAP net loss widened to −$170.0M in Q2, from −$22.9M in Q1 — all consistent with AI-inference capital intensity eating into the margin story even as the top line accelerates.
🤓 What This Actually Means — Plain English
Let's decode the spread from first principles. You paid $79.25 per contract for the right to buy Cloudflare at $300 (the $300 call), and you collected $32.55 per contract for giving someone else the right to buy your shares at $450 (the $450 call you sold). Net, you're out of pocket $46.70 per contract, or ≈$4.67M for the 1,000-lot package.
- Selling the $450 call funds ≈41% of the cost of buying the $300 call ($32.55 ÷ $79.25). That's the whole point of a bull call spread: you give up any profit above $450 in exchange for a big discount on your $300 call.
- The cap: no matter how high Cloudflare flies, this position tops out at $150 of value per contract ($450 − $300 strike width) — worth $15M gross on 1,000 contracts. Subtract the $4.67M paid, and maximum profit is ≈$10.33M, a ≈2.2:1 reward-to-risk ratio.
- The breakeven is $346.70 — spot ($310.91) plus the $46.70 paid. Cloudflare needs to be +11.5% higher by June 17, 2027 just to get money back.
- The full loss scenario: if Cloudflare is below $346.70 — worse, below $300 — at expiration, the entire ≈$4.67M is gone. This is a defined-risk trade; you can't lose more than the debit, but you can lose all of it.
- Max profit requires $450, ≈+44.7% from today's spot — a genuinely aggressive target.
Now the part that changes everything: this printed as a stock-and-options cross, meaning a paired share leg traded alongside the calls. When a call spread is bundled with stock in one negotiated package, the resulting position's net directional exposure is not simply "long a bull call spread." It's consistent with several very different intents that have nothing to do with a retail-style bullish bet: a dealer/market-maker managing inventory, a facilitated block for a convertible-arbitrage book, or hedging flow tied to a corporate financing event.
The strongest, best-evidenced hypothesis here: this is hedging flow tied to Cloudflare's new convertible bond, not a standalone directional bet. Cloudflare priced a $2.175 billion 0% convertible note on August 11, 2026 — one day before this print — with a conversion price of $496.94 (a 60% premium) and capped calls struck at $854.12; settlement is expected August 13, 2026, two days after this trade. Dealers hedging a convert of that size are structurally trading listed calls and shares together, and the timing here — one day after pricing, two days before settlement, wrapped in a paired equity leg, at meaningful size — lines up with exactly that kind of flow.
But be precise about what this hypothesis is and isn't. It's a strong circumstantial case built on timing and structure, not a mechanical match. The strikes here ($300 and $450) do not line up with the convertible's own economics — the conversion price is $496.94 and the capped-call cap is $854.12, neither of which is $300 or $450. So this is not "the issuer's own capped call showing up in the listed market" — it's a separate, unrelated pair of strikes that simply happens to be trading as a cross in the same 48-hour window as the bond deal. The honest alternative that stays on the table: this could still be an outright bull call spread from a desk that independently likes Cloudflare and chose to execute it as a negotiated block. The tape cannot distinguish the two. The takeaway either way: you can price the levels ($346.70, $450) as real numbers on the stock, but you should not read this print as proof of conviction that Cloudflare is going to $450. Copying just the two call legs is copying half a structure whose other half — the stock — you can't see.
📋 Full Trade Details
| Time | Buy/Sell | Call/Put | Expiration | Premium | Strike | Volume | OI | Size | Spot | Option Price | Option Symbol |
|---|---|---|---|---|---|---|---|---|---|---|---|
| 13:10:28 | BUY | CALL | 2027-06-17 | $7,925,000 | $300 | 1,000 | 175 | 1,000 | $310.91 | $79.25 | NET20270617C300 |
| 13:10:28 | SELL | CALL | 2027-06-17 | $3,255,000 | $450 | 1,000 | 0 | 1,000 | $310.91 | $32.55 | NET20270617C450 |
🤝 Mechanism: stock-and-options cross — shares traded alongside the options as one negotiated package, known counterparty, off the lit book. No urgency here; this was arranged in advance, not swept off the screen.
- Net debit: ≈$4.67M ($46.70 × 1,000 × 100)
- Max profit: ≈$10.33M (at $450 or above)
- Breakeven: ≈$346.70, ≈+11.5% from spot
- Max loss: the full ≈$4.67M, if Cloudflare is at or below $300 at expiration
✅ RESOLVED — Both Legs Opened, One From Literal Zero
Updated 2026-08-13 pre-market. Resolving OPRA snapshot timestamped August 13 (reflects the August 12 close, after this print); baseline is the August 12 snapshot (reflects the August 11 close, before this print).
| Leg | Baseline (Aug-12) | Resolving (Aug-13) | Δ | Print size | What we published | Verdict |
|---|---|---|---|---|---|---|
| Jun-17-2027 $450 call (sold) | 0 | 1,001 | +1,001 | 1,000 | "we expect tomorrow's open interest near $450 to print ≈1,000" | ✅ OPEN (STO) — from zero, 100.1% |
| Jun-17-2027 $300 call (bought) | 175 | 1,135 | +960 | 1,000 | "we expect tomorrow's open interest near $300 to print ≈1,175" | ✅ OPEN (BTO) — 96% of size |
Both predictions landed. The $450 leg was unfalsifiable in the best sense — zero prior open interest means every contract had to be new, and 1,001 confirms it. The $300 leg captured 96% of its print, with ≈40 contracts matching against existing holders.
The spread is real and new on both sides. Neither line fell, so no part of this was an existing position coming off.
The article's central caution is untouched by this check. Open interest proves the option legs opened; it says nothing about the paired stock leg or about whether this is convertible-bond hedging rather than a directional $450 view. That remains the more likely explanation, and open interest cannot adjudicate it.
📈 Technical Setup / Chart Check-Up
YTD chart
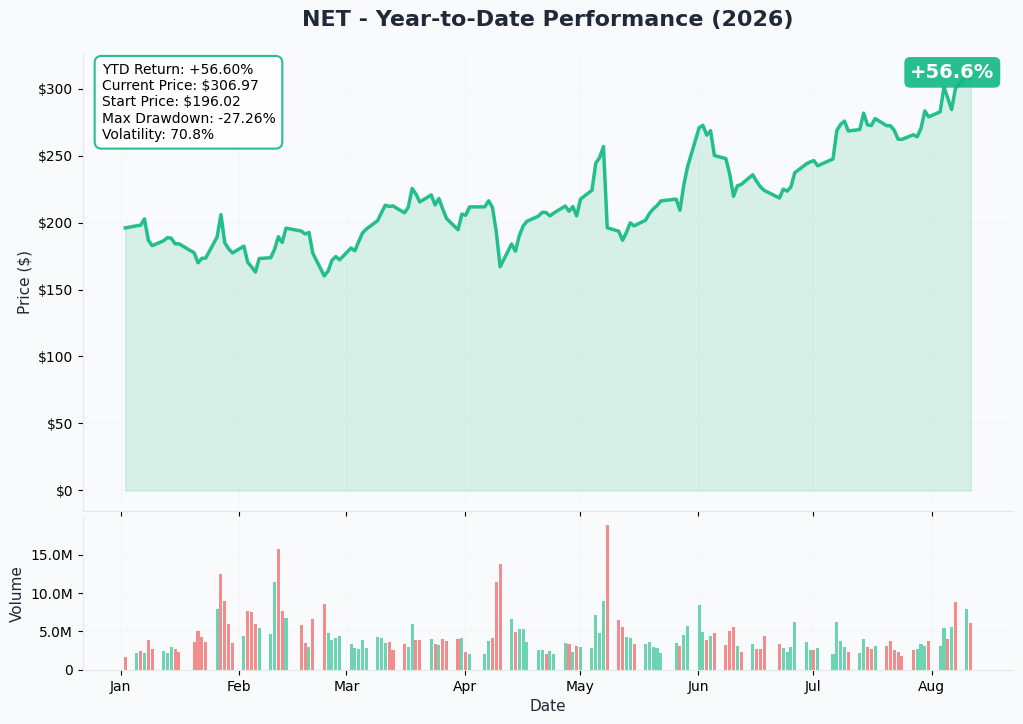
Cloudflare is trading within ≈4% of its 52-week high after a ≈27.6% six-week run off the June 30, 2026 close of $245.28, accelerated by the August 6 earnings beat and guidance raise. The one-year chart shows a stock that has been in an uptrend nearly the entire period, punctuated by the post-earnings gap on August 7.
Gamma-based support & resistance analysis
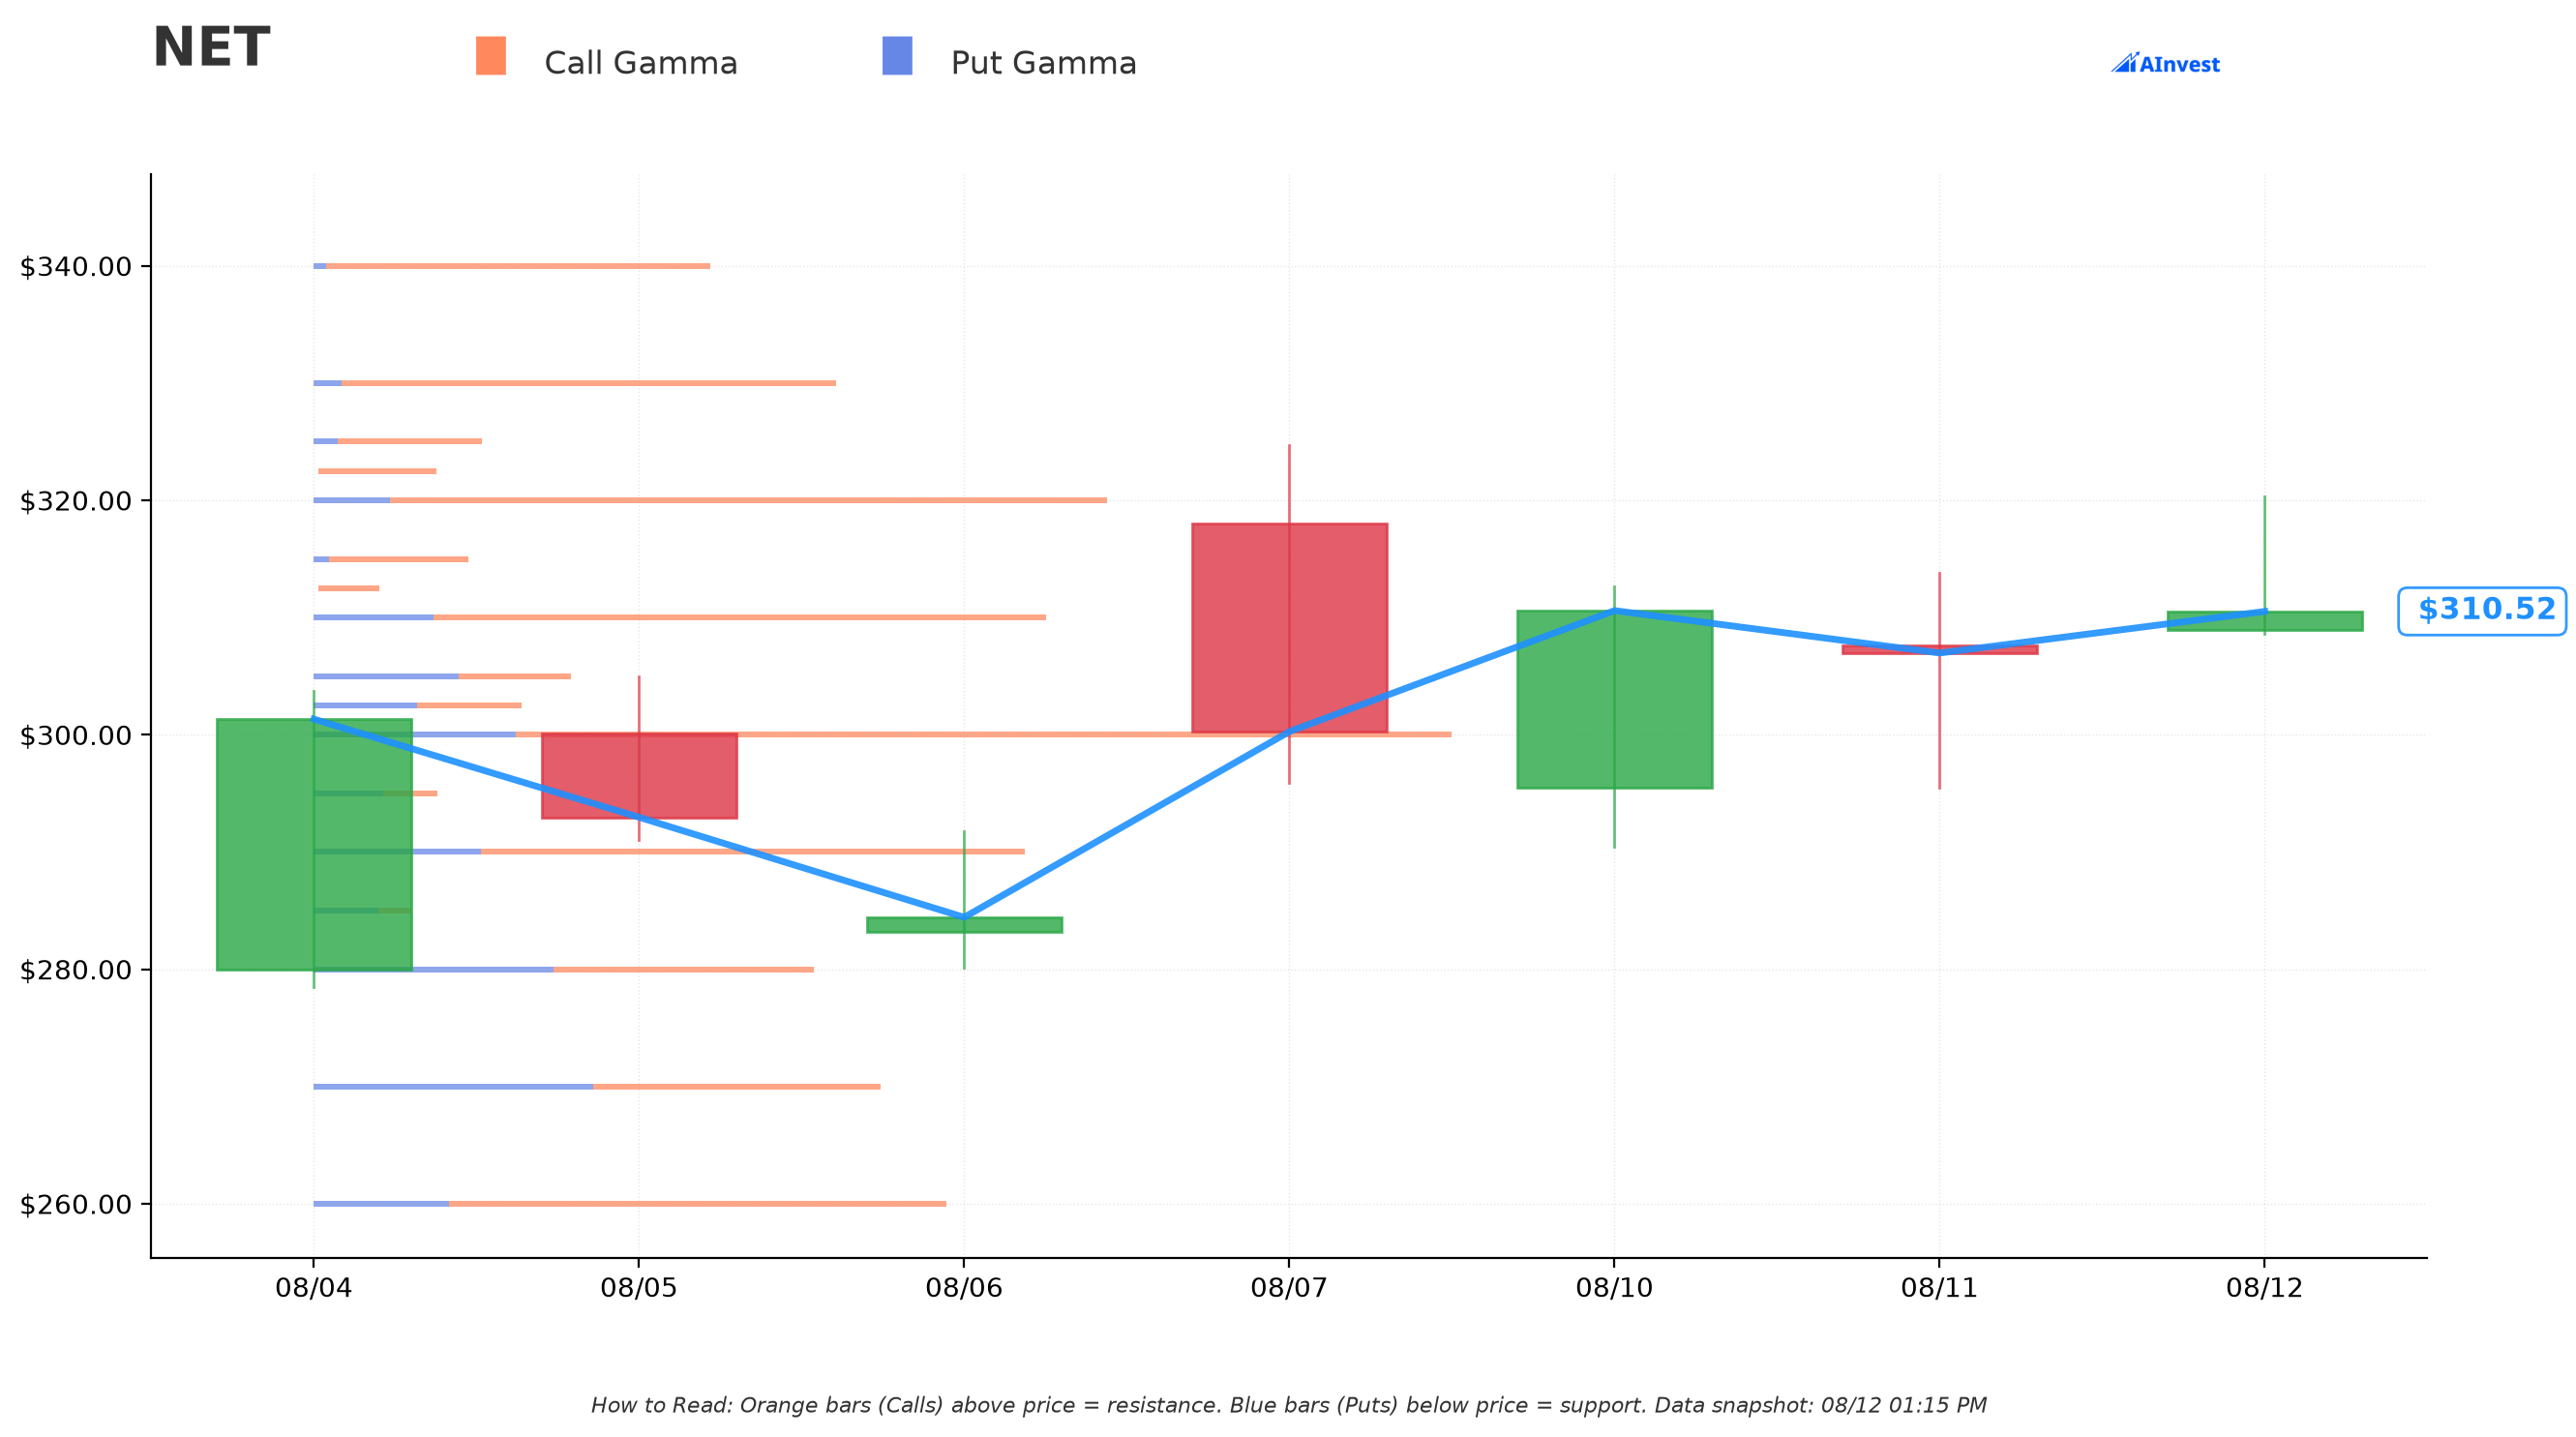
Be honest about this one: the chain returned no material gamma support or resistance levels for NET at a spot of $310.39. The strike-by-strike gamma exposure is thin and diffuse — no single strike stands out as a wall the way it does on higher open-interest names. That's not unusual for a stock that just had a huge volatility event (earnings, then a convertible pricing) reshuffle the whole options chain; positioning simply hasn't concentrated yet. Translation: don't lean on gamma levels to time this trade right now — the implied-move numbers below are the more reliable read.
Implied move
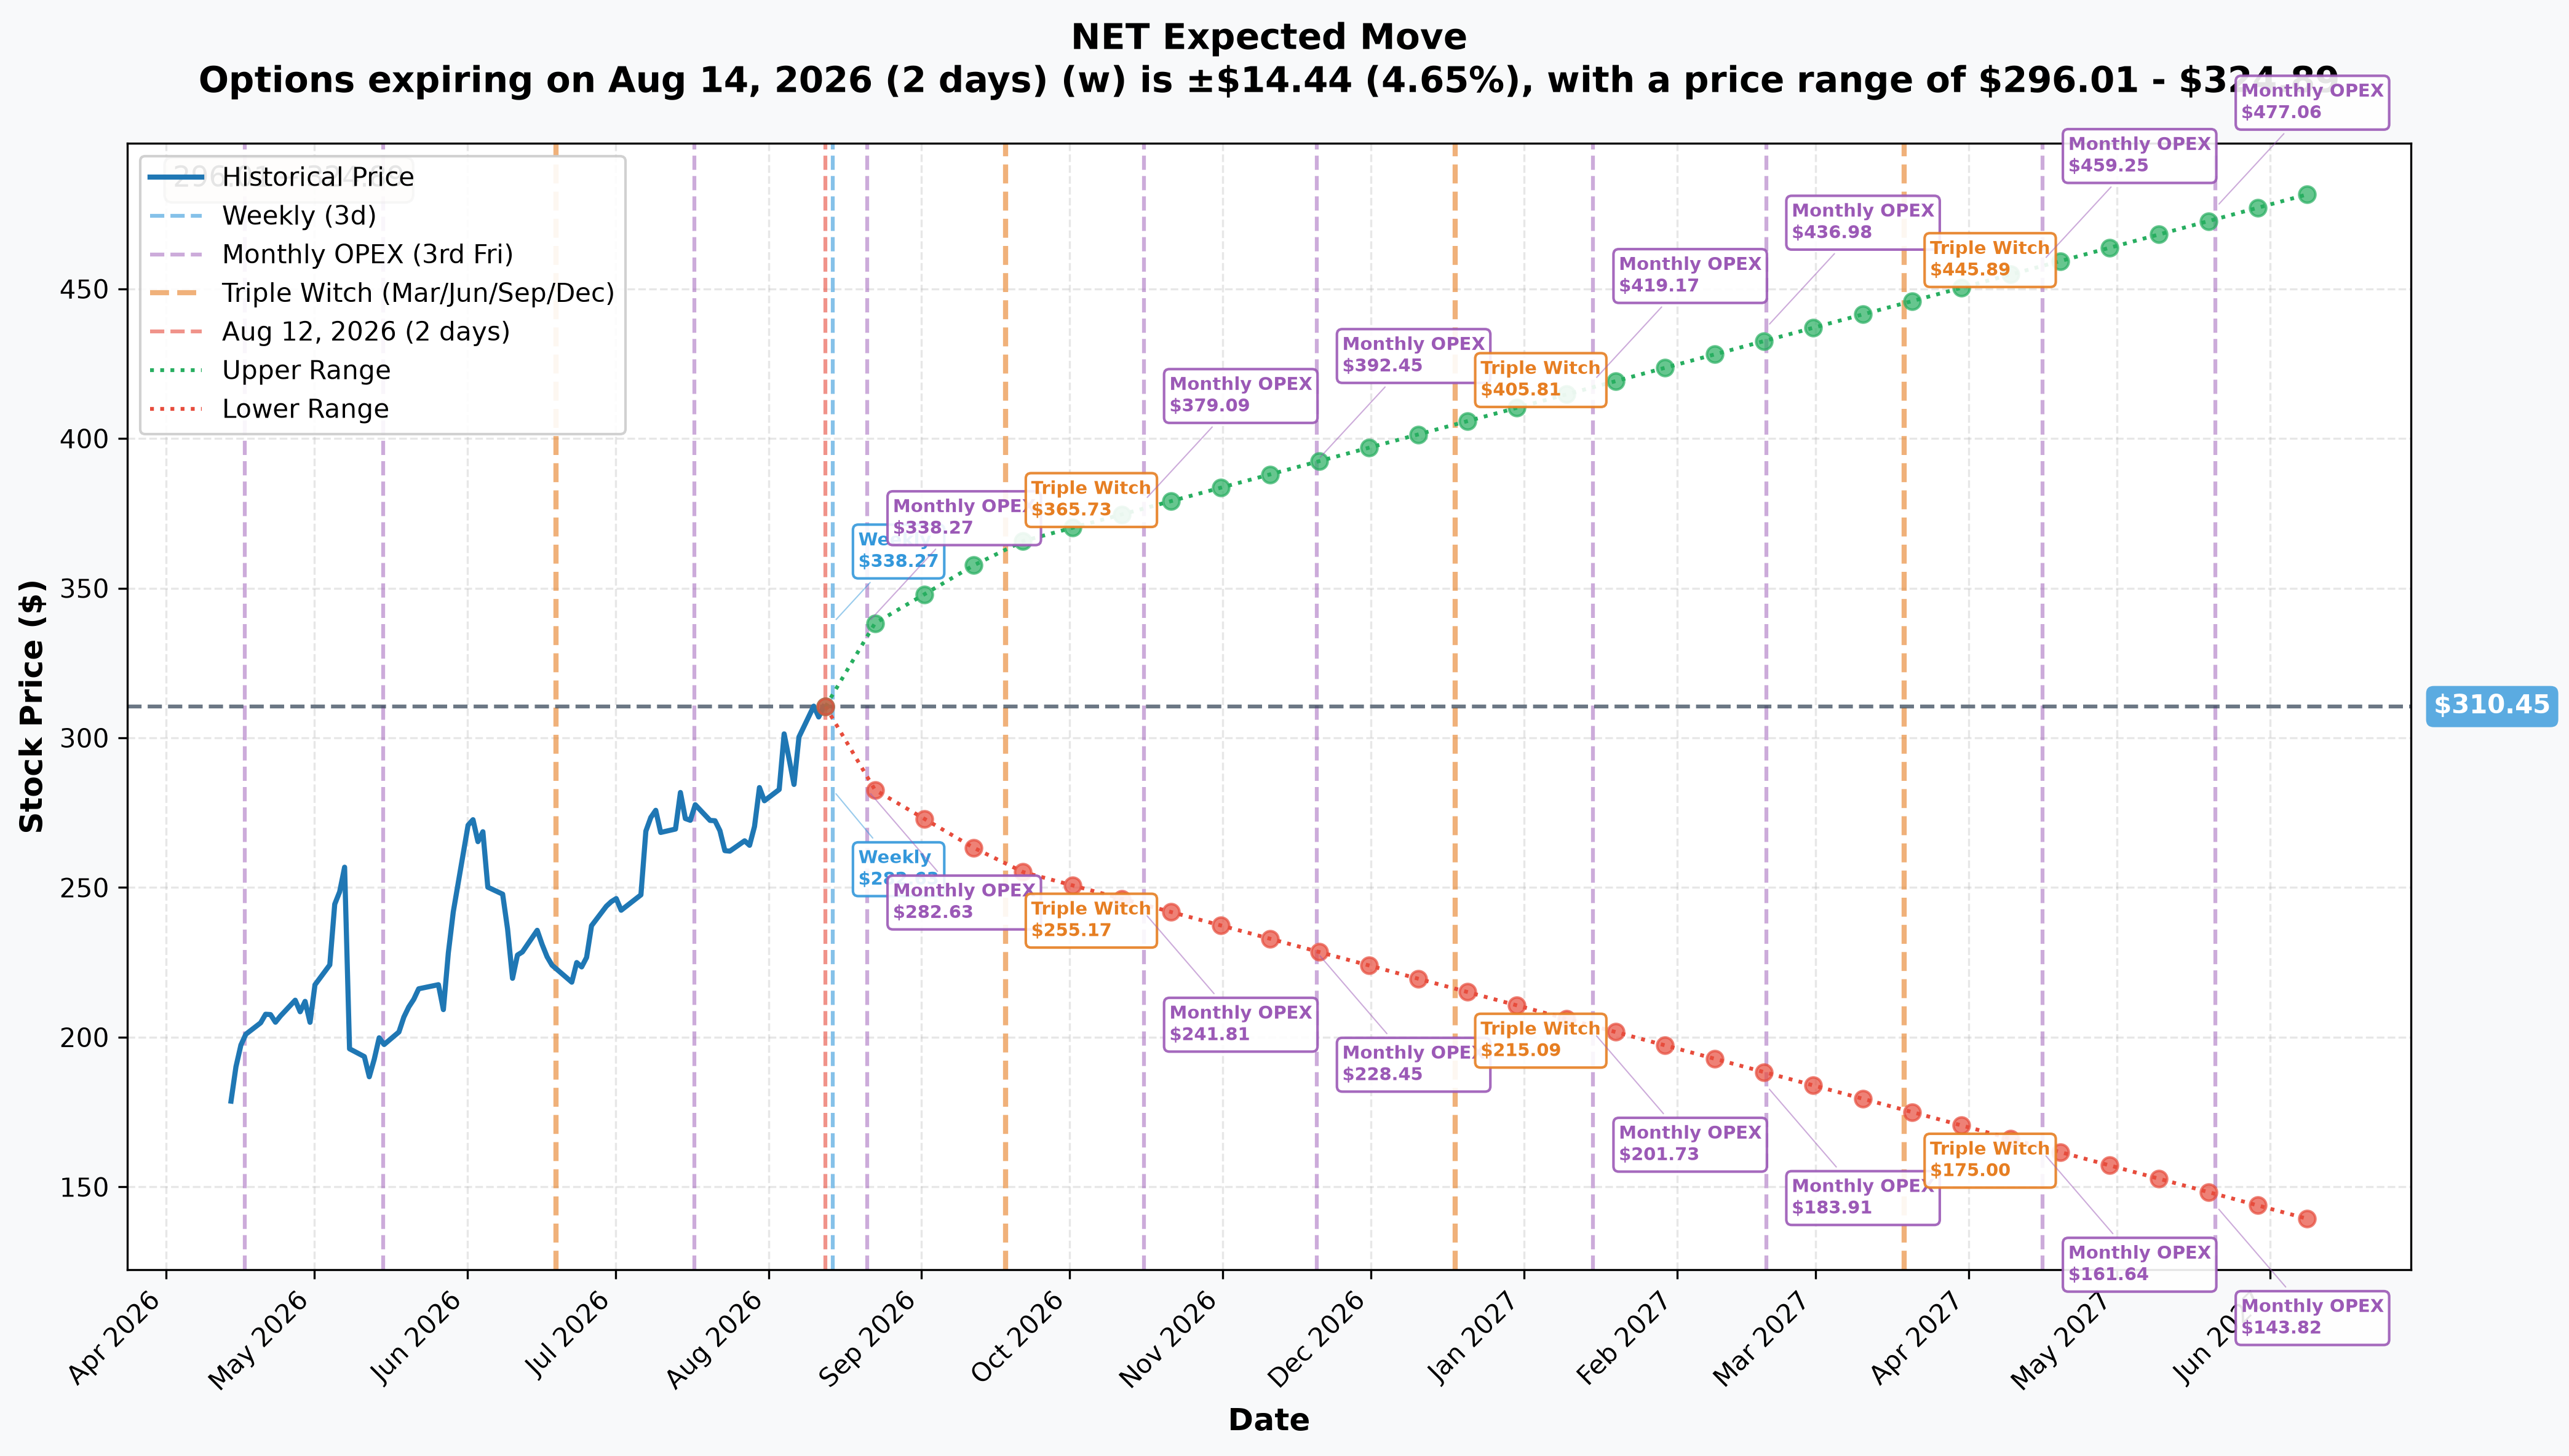
The options market is pricing:
- To August 14, 2026 (2 days): ≈±4.65%, range $296.01 – $324.89
- To August 21, 2026 (9 days): ≈±8.65%, range $283.60 – $337.30
- To September 18, 2026 (37 days): ≈±17.38%, range $256.51 – $364.39
Here's the inference worth sitting with: even the five-week implied-move range only reaches into the low $360s on the upside — well short of the $450 short strike, and it doesn't even fully clear the $346.70 breakeven on a one-standard-deviation basis. Getting to $450 by June 2027 requires either a much bigger move than the market is currently pricing over any near-term window, or a slow, sustained grind well beyond what implied volatility captures at 37 days. That's not proof the trade can't work — options prices are about near-term uncertainty, not a ten-month forecast — but it's a useful gut-check on how far outside "normal" pricing the $450 strike sits today.
🎪 Catalysts
Already happened (last three months)
- Q2 2026 results, August 6, 2026: revenue $696.1M, +36% YoY, non-GAAP EPS $0.29 (beat $0.2684 consensus), FY2026 revenue guidance raised to $2,864–2,870M (Q2 2026 results). Stock closed $284.43 on results day, then $300.27 the next session (+5.6%), then $312.99 by August 12 (daily price history).
- Analyst target reset, August 7–11, 2026: roughly a dozen firms raised targets after the beat, topping out at Citi's $265 → $400 (ratings log; price-target log). Consensus sits at $333.55 (17 Strong Buy / 7 Buy / 8 Hold / 1 Sell / 1 Strong Sell) in one tabulation and $320.19 in another — both agree the high target is $400. The bear tail is real, not token: one tabulation shows 4 Sell ratings with a low target of $136; another shows a low of $160 (price targets; forecast page) — both imply roughly −48% to −56% downside in the bear case, a useful counterweight to the $450 upside case this trade's short strike implies.
- $2.175 billion 0% convertible notes priced, August 11, 2026 — conversion price ≈$496.94 (60% premium), capped-call cap ≈$854.12, maturing August 15, 2031, settlement expected August 13, 2026 (pricing announcement). This is almost certainly the reason a stock+options cross like this one exists at all — dealers hedging a convert of this size trade shares and listed calls together.
- FedRAMP High authorization, August 10, 2026 — opens higher-classification U.S. federal workloads (source).
- "Agents Week" product launches, August 4–10, 2026 — a dense slate including Cloudflare Wallets/cloudflare.pay (agent payment rails), AI Search, the Kitesurf agent browser, next-gen MCP, and a unified Workers AI + AI Gateway control plane (company blog) — the concrete product wedge behind the "Agentic Internet" narrative.
- Gartner sole Visionary, SASE and SSE reports, cited August 5, 2026 (company blog) — a competitive datapoint against Zscaler, Palo Alto Networks and Netskope.
Upcoming, inside the June 17, 2027 expiration window
Keep this separate from the expiration date itself — June 17, 2027 is when the option dies, not a company event.
- Q3 2026 earnings, ≈October 29, 2026 — ESTIMATED, not company-confirmed (earnings calendar); guided to revenue $736.0–737.0M and non-GAAP EPS $0.34.
- Q4/FY2026 earnings, ≈February 2027 — the single most thesis-critical event inside the window. ESTIMATED, no company announcement exists yet. This is the one that delivers initial FY2027 guidance; consensus already models FY2027 revenue at $3.68B (+28.1%). For a 44x-sales stock, the initial guide is what re-rates or de-rates the multiple — not the beat itself.
- Q1 2027 earnings, ≈May 2027 — ESTIMATED, no company announcement yet; the final earnings gate before expiry, roughly six weeks out.
- A probable next innovation/launch week (in the pattern of Agents Week) is likely around late September 2026, but Cloudflare has not published a specific date — treat as directional context, not a scheduled catalyst.
Three quarterly reports land inside the ≈10-month window; a fourth (Q2 2027, ≈August 2027) falls outside, roughly seven weeks after expiry.
🎲 Price Targets & Level Map
| Level | Move from $310.91 | What it means |
|---|---|---|
| $346.70 (breakeven) | +11.5% | Modest ask — sits between consensus ($333.55) and the median target ($355) |
| $400 (Street's highest published target) | +28.7% | The ceiling of published analyst research — no one covering the stock currently models higher |
| $450 (max-profit strike) | +44.7% | ≈13% above the single highest Street target — no analyst currently forecasts this level |
| $496.94 (convert conversion price) | +59.8% | The company's own five-year hedging reference, not a near-term target |
The framing problem worth leading on: the spread's maximum payoff needs Cloudflare to trade where no covering analyst currently has it going. $450 is ≈13% above the highest published Street target of $400, and at 356.08M shares implies a ≈$160.2B market cap — ≈43.5× FY2027 consensus revenue ($3.68B) and ≈271× FY2027 consensus EPS ($1.66). That's the stock holding its already-extreme multiple while growing into it, not expanding it further. By contrast, the $346.70 breakeven is a genuinely modest ask — it sits between the two consensus figures ($333.55 and $320.19) and just below the median target ($355), and requires no multiple expansion beyond where the stock already trades. That doesn't make the $450 cap impossible — Cloudflare has returned +75.2% (2025), +93.5% (2023) and +346.2% (2020) in single years, so a +44.7% move over ten months is inside this stock's realized distribution — but it does mean the upper half of this spread is priced on hope for outperformance beyond the Street's own most bullish call, while the lower half (getting to breakeven) is a comparatively reasonable ask.
💡 Trading Ideas
🎲 The YOLO trader
Here's the honest disappointment: this structure is the opposite of a lottery ticket. Selling the $450 call caps the upside at a known, bounded ≈$10.33M — no matter how far Cloudflare runs past $450, this position stops paying. If you're looking for uncapped convexity on an AI-infrastructure name, a straight long call (no short leg) is the shape you actually want, not this. And remember the cap itself sits ≈13% above the highest published Street target — you'd be capping your winner at a level analysts don't even model, on a trade that already gave up unlimited upside to get there cheaper.
📈 The swing trader
This isn't really your setup — ten months to expiration is far beyond a swing horizon, so there's no near-term trigger to trade around. What you can use is the levels: the $346.70 breakeven (+11.5%) sits neatly between the two consensus targets ($333.55 and $320.19) and just under the median ($355) — a level the stock could plausibly reach on drift alone. But the five-week implied-move range only reaches the low $360s on the upside, meaning the options market itself isn't pricing a fast move to breakeven, let alone to $450, inside any window you'd actually swing-trade.
💰 The premium collector
Pay attention to the short $450 call, because that's your side of this trade. Someone collected $32.55 per contract (≈$3.26M total) for selling a call ≈45% out of the money, ten months out — funding ≈41% of the whole package's cost. That's a real premium-selling playbook: get paid well for giving up upside far above where the Street even forecasts. The risk to respect: Cloudflare is a ≈210× forward P/E name that has already re-rated hard on an AI narrative once this year (+55.7% YTD) — if that narrative re-rates the stock again toward $450+, a short call at this strike is exactly the position that gets run over. Selling rich premium on a name this volatile is a legitimate strategy, but only if you're genuinely prepared to be assigned or to buy back at a loss.
🌱 The beginner
Two lessons worth taking from this one trade. First: a "bullish-looking" options structure doesn't always mean someone is bullish. When a paired equity leg trades alongside the options — as it did here — the option legs alone can no longer tell you the trader's real view; the stock leg can offset, amplify, or completely change the net exposure, and you simply can't see it from the options tape. Second: context matters more than the shape of the trade. Cloudflare priced a $2.175 billion convertible bond just one day before this print — and once you know that, a structure that looks like "someone making a bold $450 call" starts to look a lot more like routine hedging flow tied to that bond deal. Before you copy any options trade, ask what else happened around it — the options chain rarely tells the whole story by itself.
⚠️ Risk Factors — Honest Limits
- The paired equity leg hides the true net exposure. Because this printed as a stock-and-options cross, the option-only P&L shown above is not the trader's actual position. We cannot see the size, direction, or hedge ratio of the stock leg from the options tape alone — meaning the package could be far less bullish (or bearish) than the calls alone suggest.
- The entire ≈$4.67M debit is at risk. If Cloudflare is anywhere at or below $346.70 at expiration in June 2027, this position loses money; below $300, it loses the full amount paid.
- A 210x forward P/E leaves no room for a stumble. Cloudflare's guidance carries no cushion (FY2026 consensus sits at the very top of company guidance), free-cash-flow margin fell from 13% to 8% quarter over quarter, gross margin has compressed ≈475bps since FY2024, and GAAP losses widened from −$22.9M to −$170.0M in a single quarter. This stock fell −64.2% in 2022 — multiple compression has real precedent here.
- Cloudflare has stopped disclosing net revenue retention and large-customer counts in its 2026 releases — a governance-quality flag that removes metrics that would otherwise let bears falsify the growth story early.
- The BUY/SELL labels are reported, not tape-proven. This was a negotiated cross that took no liquidity, so we cannot independently verify aggressor side the way we could on a lit sweep.
- Dates carry different confidence levels. The convertible pricing and settlement dates are company-confirmed; all three earnings dates inside the window (October 2026, February 2027, May 2027) are estimates based on historical cadence, not company announcements — Cloudflare typically confirms each date only ≈3 weeks in advance.
- Underlying research gaps, disclosed by the catalyst file: SEC filing endpoints (10-Q, 10-K, proxy) returned errors on direct fetch, so the following are unverified and must not be asserted as fact: the Class A/Class B voting ratio and founder voting-control percentage, and whether any legacy convertible notes mature inside the June 17, 2027 window (the new 0% convert matures well outside it, in August 2031, and net cash was ≈$633M as of June 2026, but the full debt-maturity ladder was not independently confirmed). The Investor Day 2026 deck's specific long-term targets were not extracted; S&P 500 index-membership status is unverified; May 12, 2026 and December 31, 2025 closing prices were not retrievable, so the exact 3-month return figure is not stated as a single number.
- None of the three in-window earnings dates are company-confirmed. October 2026 (Q3), February 2027 (Q4/FY2026), and May 2027 (Q1 2027) are all schedule-derived estimates, not company announcements — Cloudflare has historically confirmed each date only ≈3 weeks in advance.
Options trading involves substantial risk of loss and is not suitable for all investors. This is not personalized investment advice — size any position to what you can afford to lose entirely, and do your own research before trading.
🎯 The Bottom Line
Real talk: this is a $4.67M bull call spread with real, calculable levels — a modest $346.70 breakeven and an aggressive $450 cap that sits above every published Street target — but it arrived bundled with a stock leg that means the options alone don't tell you what the desk actually believes. Cloudflare's growth is genuinely accelerating (+36% in Q2, guidance raised twice this year) inside a valuation that leaves zero room for error, and the timing lines up almost exactly with a $2.175B convertible bond pricing one day earlier — the more parsimonious read is hedging flow around that financing, not a standalone bet that Cloudflare goes to $450.
✅ Resolved 2026-08-13: the open-interest confirmation is in and both predictions landed — $300 printed 1,135 (we said ≈1,175) and $450 printed 1,001 from literal zero (we said ≈1,000). Both legs opened. Mark ≈February 2027 as the date that matters most inside this option's life — the Q4/FY2026 report that sets initial FY2027 guidance, the single event most likely to determine whether $346.70, $450, or something in between is where this ends up.
Last updated: 2026-08-13 (pre-market) — the next-day OPRA open-interest snapshot confirmed both legs. Jun-2027 $450C 0 → 1,001 (+1,001 from literal zero) and $300C 175 → 1,135 (+960 against 1,000, 96% of size): OPEN on both. The ⏳ callout was replaced with the ✅ RESOLVED box; no thesis or title change was required.