🐻 OWL ≈$13M Bearish Put Roll — Big Desk Rolls Its Blue Owl Downside Bet Up & Out
📅 June 15, 2026 | 🔥 Unusual Activity Detected
✅ Updated 2026-06-16 — STRUCTURE CORRECTED: Next-day OPRA OI reveals this is a bearish put ROLL, not a fresh diagonal. The Jun-18 $11 put long was CLOSED (OI 91,701 → 944, Δ −90,757) and a Sep-18 $12 put long was OPENED (OI 56 → 90,178, Δ +90,122) — an existing holder rolling its downside bet UP in strike and OUT in time, not new money. Direction unchanged (bearish/hedge on private-credit stress). Note: the trade table's Jun-18 $11P prior OI of 20,000 was an understated screenshot value; the true prior OI was 91,701.
🎯 The Quick Take
At 12:43:01 today, a desk structured a ≈$13M-net bearish put diagonal on Blue Owl Capital (OWL) — buying ≈90,000 September $12 puts deep in-the-money (premium ≈$24M) while simultaneously selling ≈90,000 June $11 puts to collect ≈$11M back, for a net debit of ≈$13M. With OWL already down ≈63% from its January 2025 all-time high of $26, and the stock sitting at ≈$9.77, the $12 put is already in-the-money — this is either a fresh bearish directional bet or a sophisticated hedge against a long position in a stock that has been absolutely hammered. Either way, somebody just paid ≈$13M net to protect against more downside in a battered private-credit manager facing a very real liquidity-confidence crisis.
📊 Company Overview
Blue Owl Capital (OWL) is one of the largest alternative asset managers in the U.S., focused almost entirely on private credit and direct lending:
- Market Cap: ≈$14.8B
- Sector / Industry: Financials — Alternative Asset Management (Private Credit / Direct Lending / GP Stakes)
- What they do: Blue Owl manages ≈$315B in assets across three platforms: Credit (direct lending to private-equity-backed companies via vehicles like OBDC and OBDC II), GP Stakes ("Dyal" — buying minority stakes in private equity and hedge fund management companies), and Real Estate. Their pitch to investors: an overwhelming majority of their AUM sits in long-duration or permanent-capital vehicles, generating predictable recurring management fees rather than volatile deal-by-deal carry.
- The story in 2026: The stock collapsed ≈63% from its January 2025 all-time high of $26.18 to ≈$9.77 today — not because the headline financials fell apart (AUM is still growing at 15% YoY to $314.9B), but because the private-credit liquidity machine that drove their retail distribution strategy is under real stress. They halted redemptions in their flagship non-traded BDC, origination dropped 41% YoY, and a wave of analyst downgrades followed.
💰 The Option Flow Breakdown
The Tape — June 15, 2026 @ 12:43:01: 🤝 Block Cross
| Time | Buy/Sell | Call/Put | Strike | Expiration | Volume | OI | Size | Premium | Spot | Option Price | Option Symbol |
|---|---|---|---|---|---|---|---|---|---|---|---|
| 12:43:01 | BUY | PUT | $12 | 2026-09-18 | 90,000 | 56 | 90,083 | ≈$24M | $9.77 | $2.66 | OWL20260918P12 |
| 12:43:01 | SELL | PUT | $11 | 2026-06-18 | 90,000 | 20,000 | 90,083 | ≈$11M | $9.77 | $1.23 | OWL20260618P11 |
Net premium: ≈$13M debit (long − short legs)
Flow type: 🤝 Block Cross — both legs of this diagonal printed simultaneously as a pre-arranged negotiated block. A desk matched a buyer and seller off the open book; this is not a frantic lit-market sweep. No urgency, no panic — just two sides of a very large, very deliberate trade that agreed on a price before they ever hit the exchange. The sheer size (90,000 contracts on each leg, on a stock with OI of just 56 on the Sep $12 put) makes this stand out.
✅ RESOLVED — Next-Day OI Reveals a Bearish Put ROLL, Not a Fresh Diagonal (2026-06-16)
Verdict: this was a ROLL, not a fresh diagonal. The next-day OPRA OI snapshot resolved both legs — and inverted the structure read. The Jun-18 $11 put long was CLOSED and the Sep-18 $12 put long was OPENED: an existing holder rolling its downside bet up in strike and out in time, not new money entering.
Leg Baseline OI Resolving OI Δ Verdict Jun-18 $11 Put 91,701 944 −90,757 CLOSE (long unwound) Sep-18 $12 Put 56 90,178 +90,122 OPEN (fresh long) The Jun-18 $11 put leg was therefore a sell-to-close (STC) of a pre-existing long put, not a sell-to-open short — the trade table's reported prior OI of 20,000 was an understated screenshot value; the true prior OI was 91,701. The direction is unchanged (bearish / downside protection on private-credit stress), but the correct structural label is a bearish put roll: same view, more time, deeper strike — not new conviction money. The lesson is the standing one: a big block does not mean fresh positioning; only next-day OI resolves open vs. close, and here it inverted the structure.
🤓 What This Actually Means — Plain English
Let's decode a put diagonal step by step — because this is slightly more involved than a simple put buy.
Step 1: Why two puts? The desk didn't just buy puts. They bought the more expensive, longer-dated, higher-strike put (Sep $12) and simultaneously sold a cheaper, shorter-dated, lower-strike put (Jun $11). This is called a diagonal spread.
Step 2: What does each leg do?
- The BUY side (Sep $12 put): gives the right to sell OWL shares at $12 anytime until September 18, 2026. Since OWL is trading at ≈$9.77, this put is already in-the-money — the $12 strike is above the current price, which means the put already has ≈$2.23 of intrinsic value built in. This leg cost ≈$24M gross.
- The SELL side (Jun $11 put): the desk sold someone else the right to sell OWL at $11 by June 18, 2026 — collecting ≈$11M in premium upfront. This is the financing leg. By selling the near-term, lower-strike put, they partially offset the cost of the longer-dated bet.
Step 3: Why is this bearish? After netting the two legs, the desk is net long a put at a higher strike with more time. A long put profits when the stock falls. The $12 strike is already ITM, so this isn't speculating that OWL will fall — it's betting OWL will stay down or fall further between now and September.
The rough math:
- Paid ≈$24M for the Sep $12 put.
- Collected ≈$11M from selling the Jun $11 put.
- Net out-of-pocket: ≈$13M.
- Max profit on the long leg: OWL goes to zero → the $12P pays ≈$12 × 90,083 × 100 = ≈$108M in intrinsic value, minus the ≈$13M net cost.
- The short Jun $11P caps some downside exposure through June 18 (if OWL crashes below $11 by June expiry, there's assignment risk on the short leg) — but the long Sep $12 leg offsets that.
Why a diagonal and not just outright puts? Selling the near-term put reduces the net cost of the bear position significantly — from ≈$24M gross to ≈$13M net. The financing logic: "I want the September downside exposure, but I'll sell some near-term premium to pay for it." It's a disciplined, structured hedge, not a reckless slam.
The order type (per leg):
- Sep $12P: BTO (Buy to Open) — ✅ confirmed by next-day OI (56 → 90,178, Δ +90,122). Fresh opening long.
- Jun $11P: STC (Sell to Close) — ✅ resolved by next-day OI (91,701 → 944, Δ −90,757). This was closing a pre-existing long put, not opening a new short. The structure is a bearish put roll, not a fresh diagonal.
📈 Technical Setup / Chart Check-Up
YTD Performance
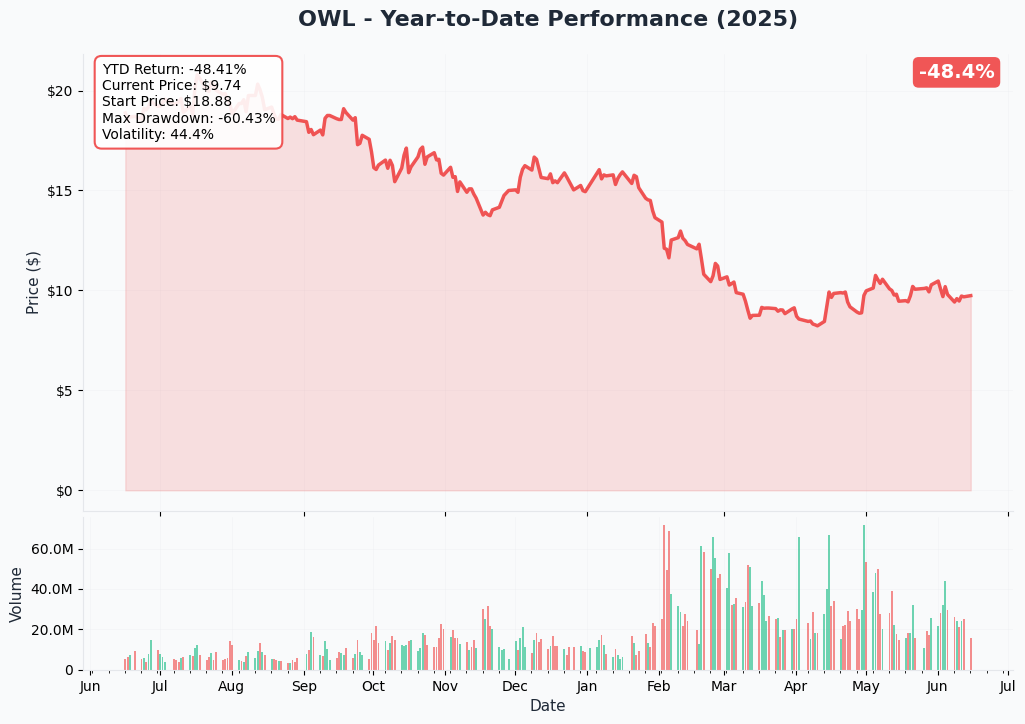
The chart says it all — OWL has been in freefall. The stock is down ≈37% year-to-date and has lost ≈63% from its all-time high of $26.18 reached in January 2025. Every rally attempt has been sold, and the stock has now compressed into the high-$9s, hovering just below the $10 handle that has become psychological resistance.
Key observations:
- 📉 OWL is trading ≈63% below its January 2025 all-time high of $26.18 — one of the worst drawdowns among major alternative asset managers
- 📊 The private-credit liquidity-confidence crisis drove most of the decline; analyst downgrades from Goldman, UBS, KBW, and BofA accelerated the repricing
- 🎯 Even the most bullish Street consensus target (≈$14.79 average) is still ≈51% above current price — a gap that reveals just how compressed sentiment has become
Gamma-Based Support & Resistance
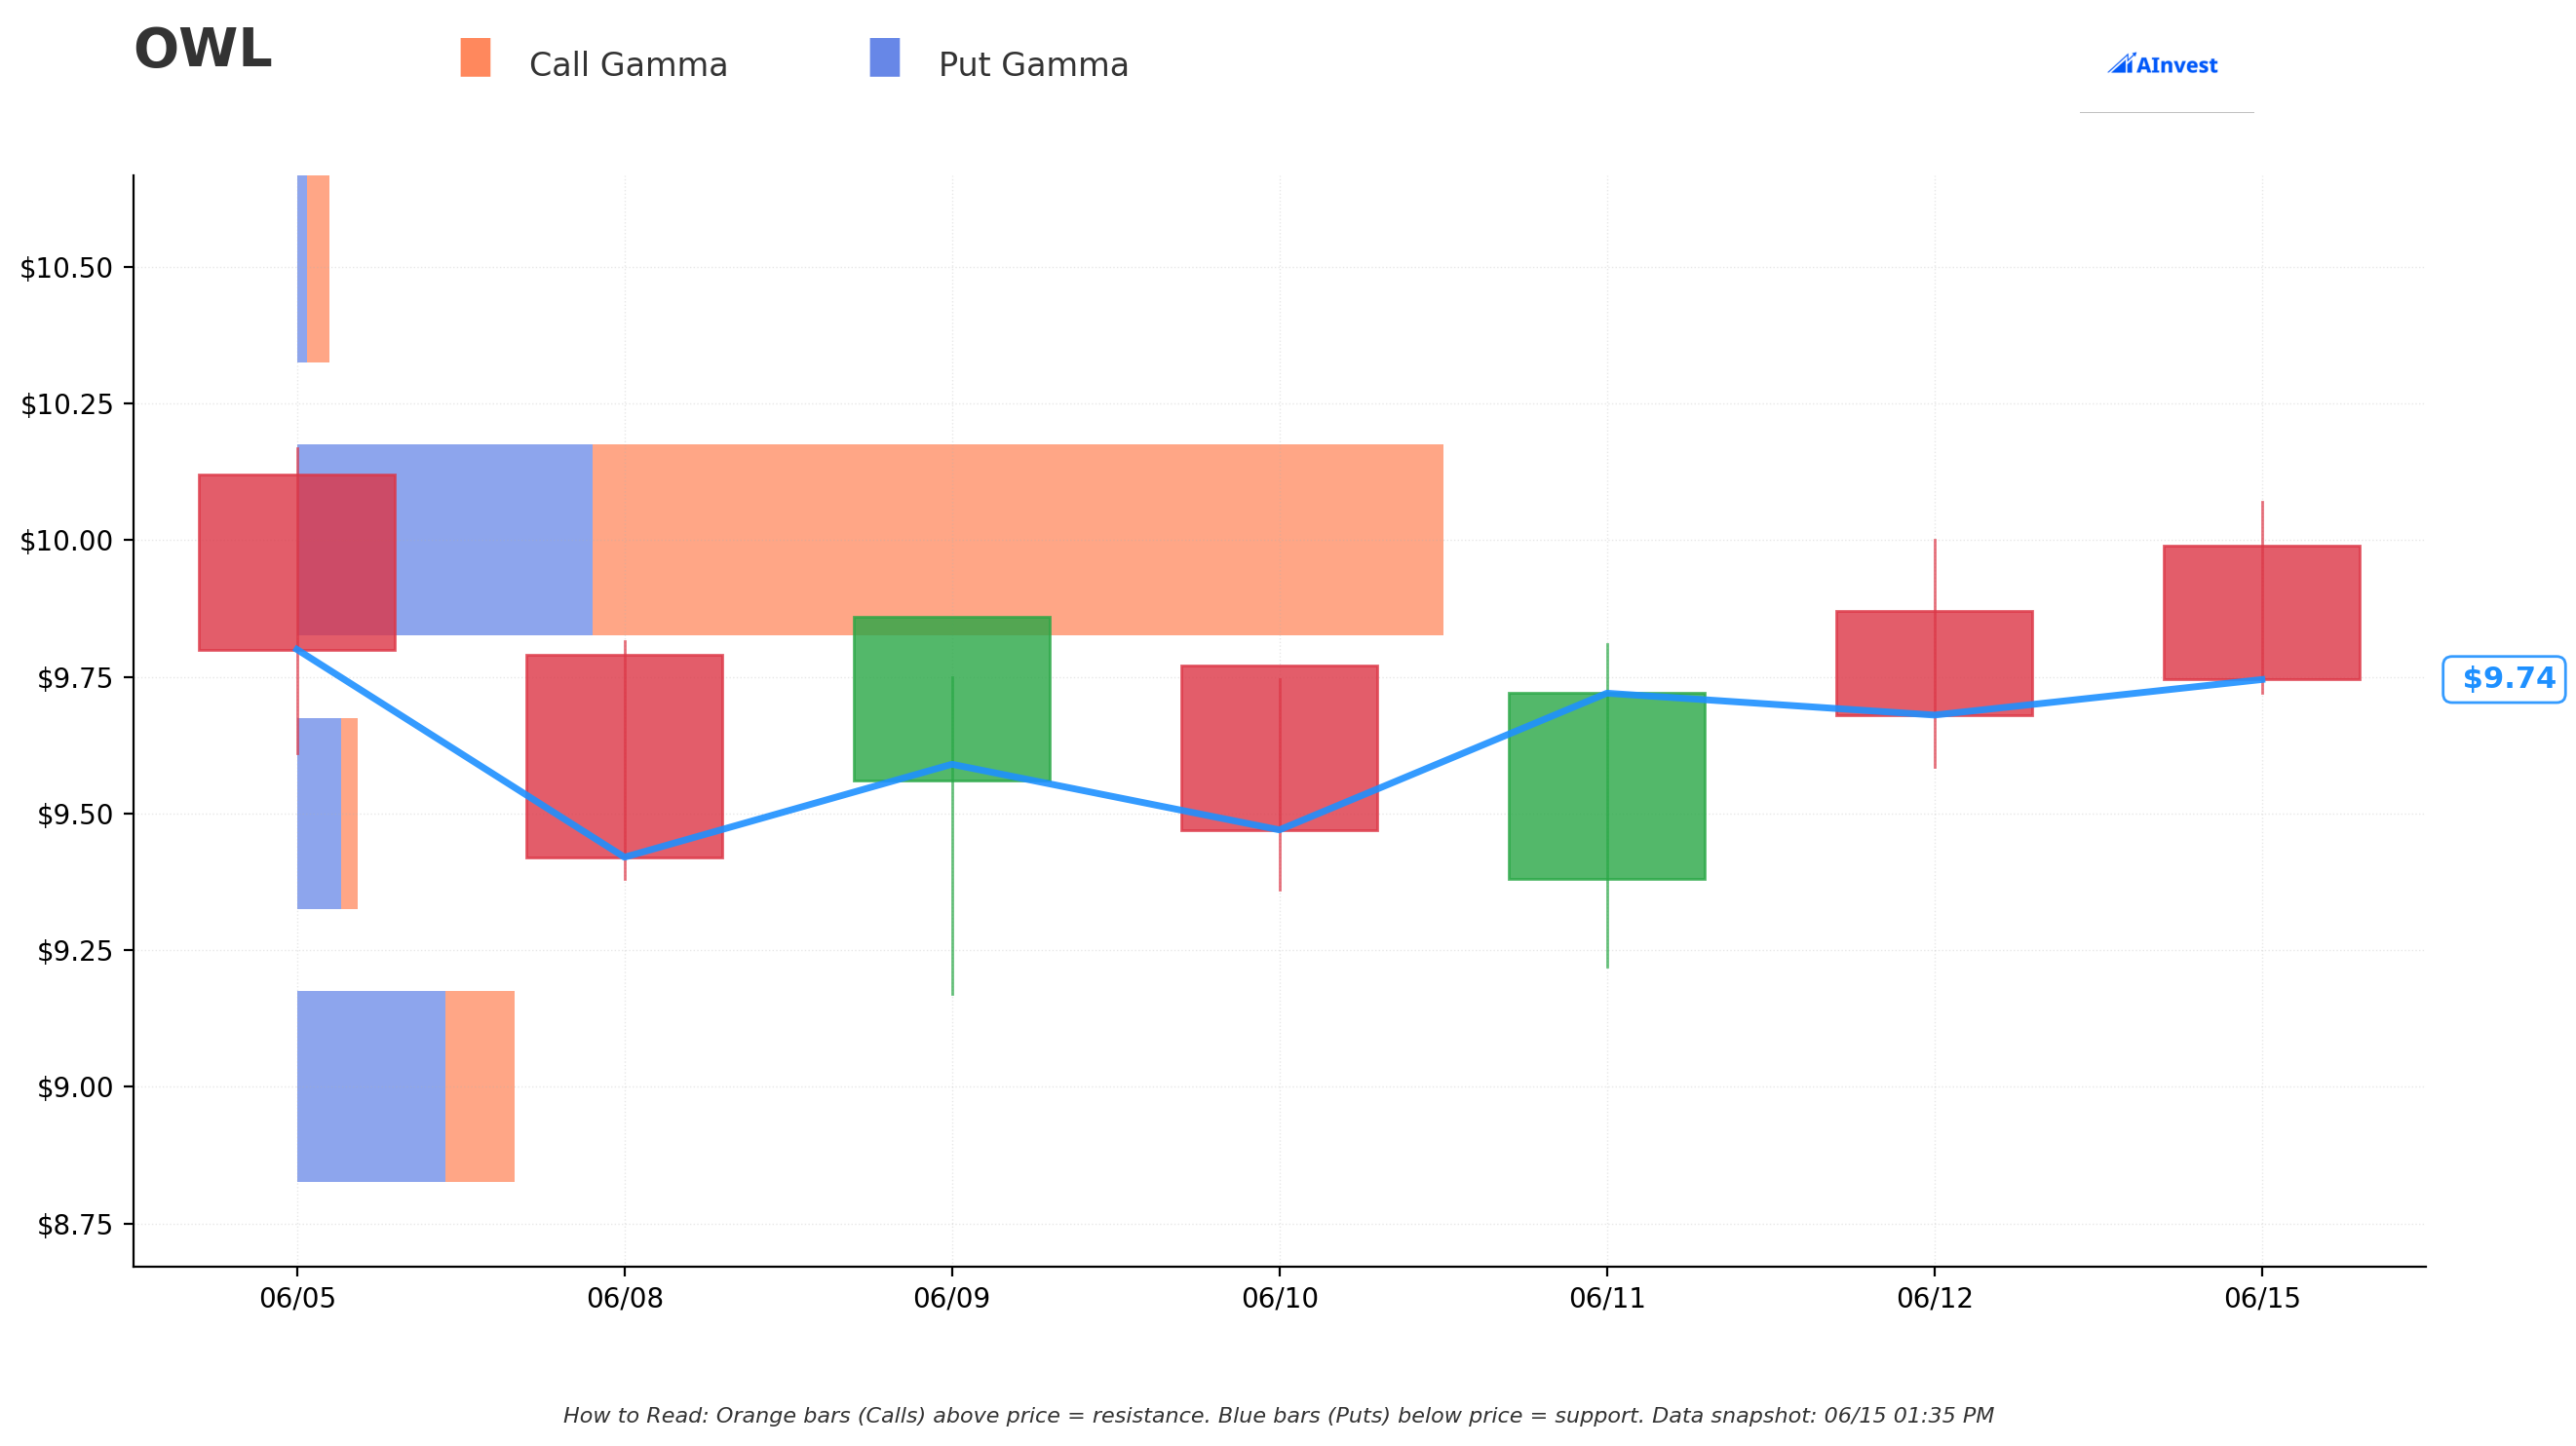
Current Spot: ≈$9.75
The gamma exposure map shows a lopsided put-heavy structure around current price — consistent with a stock in a bearish trend where options positioning skews defensive.
🔵 Support Levels (Put Gamma Below Price):
- $9.00 — Key Gamma Floor. This is the primary downside support from the gamma data. Market makers are long put gamma below $9, which creates mechanical buying pressure as OWL dips toward that level. A confirmed break below $9 would be significant — it removes the gamma cushion and the next meaningful floor is further down.
🟠 Resistance Levels (Call Gamma Above Price):
- $10.00 — Strong Resistance. The $10 handle is the most dominant resistance level above current price. Call gamma here creates selling pressure every time OWL tries to reclaim $10. The stock has been batting against this level and failing — and the put diagonal today suggests at least one large desk doesn't expect that to change before September.
Translation for traders: OWL is pinned in a $9–$10 channel right now. The put diagonal buyer needs the $10 call-gamma wall to hold (keeping the stock down) and ideally for OWL to break the $9 floor to maximize the Sep $12P value. If OWL somehow clears $10 cleanly, the bear thesis gets challenged.
Implied Move Analysis
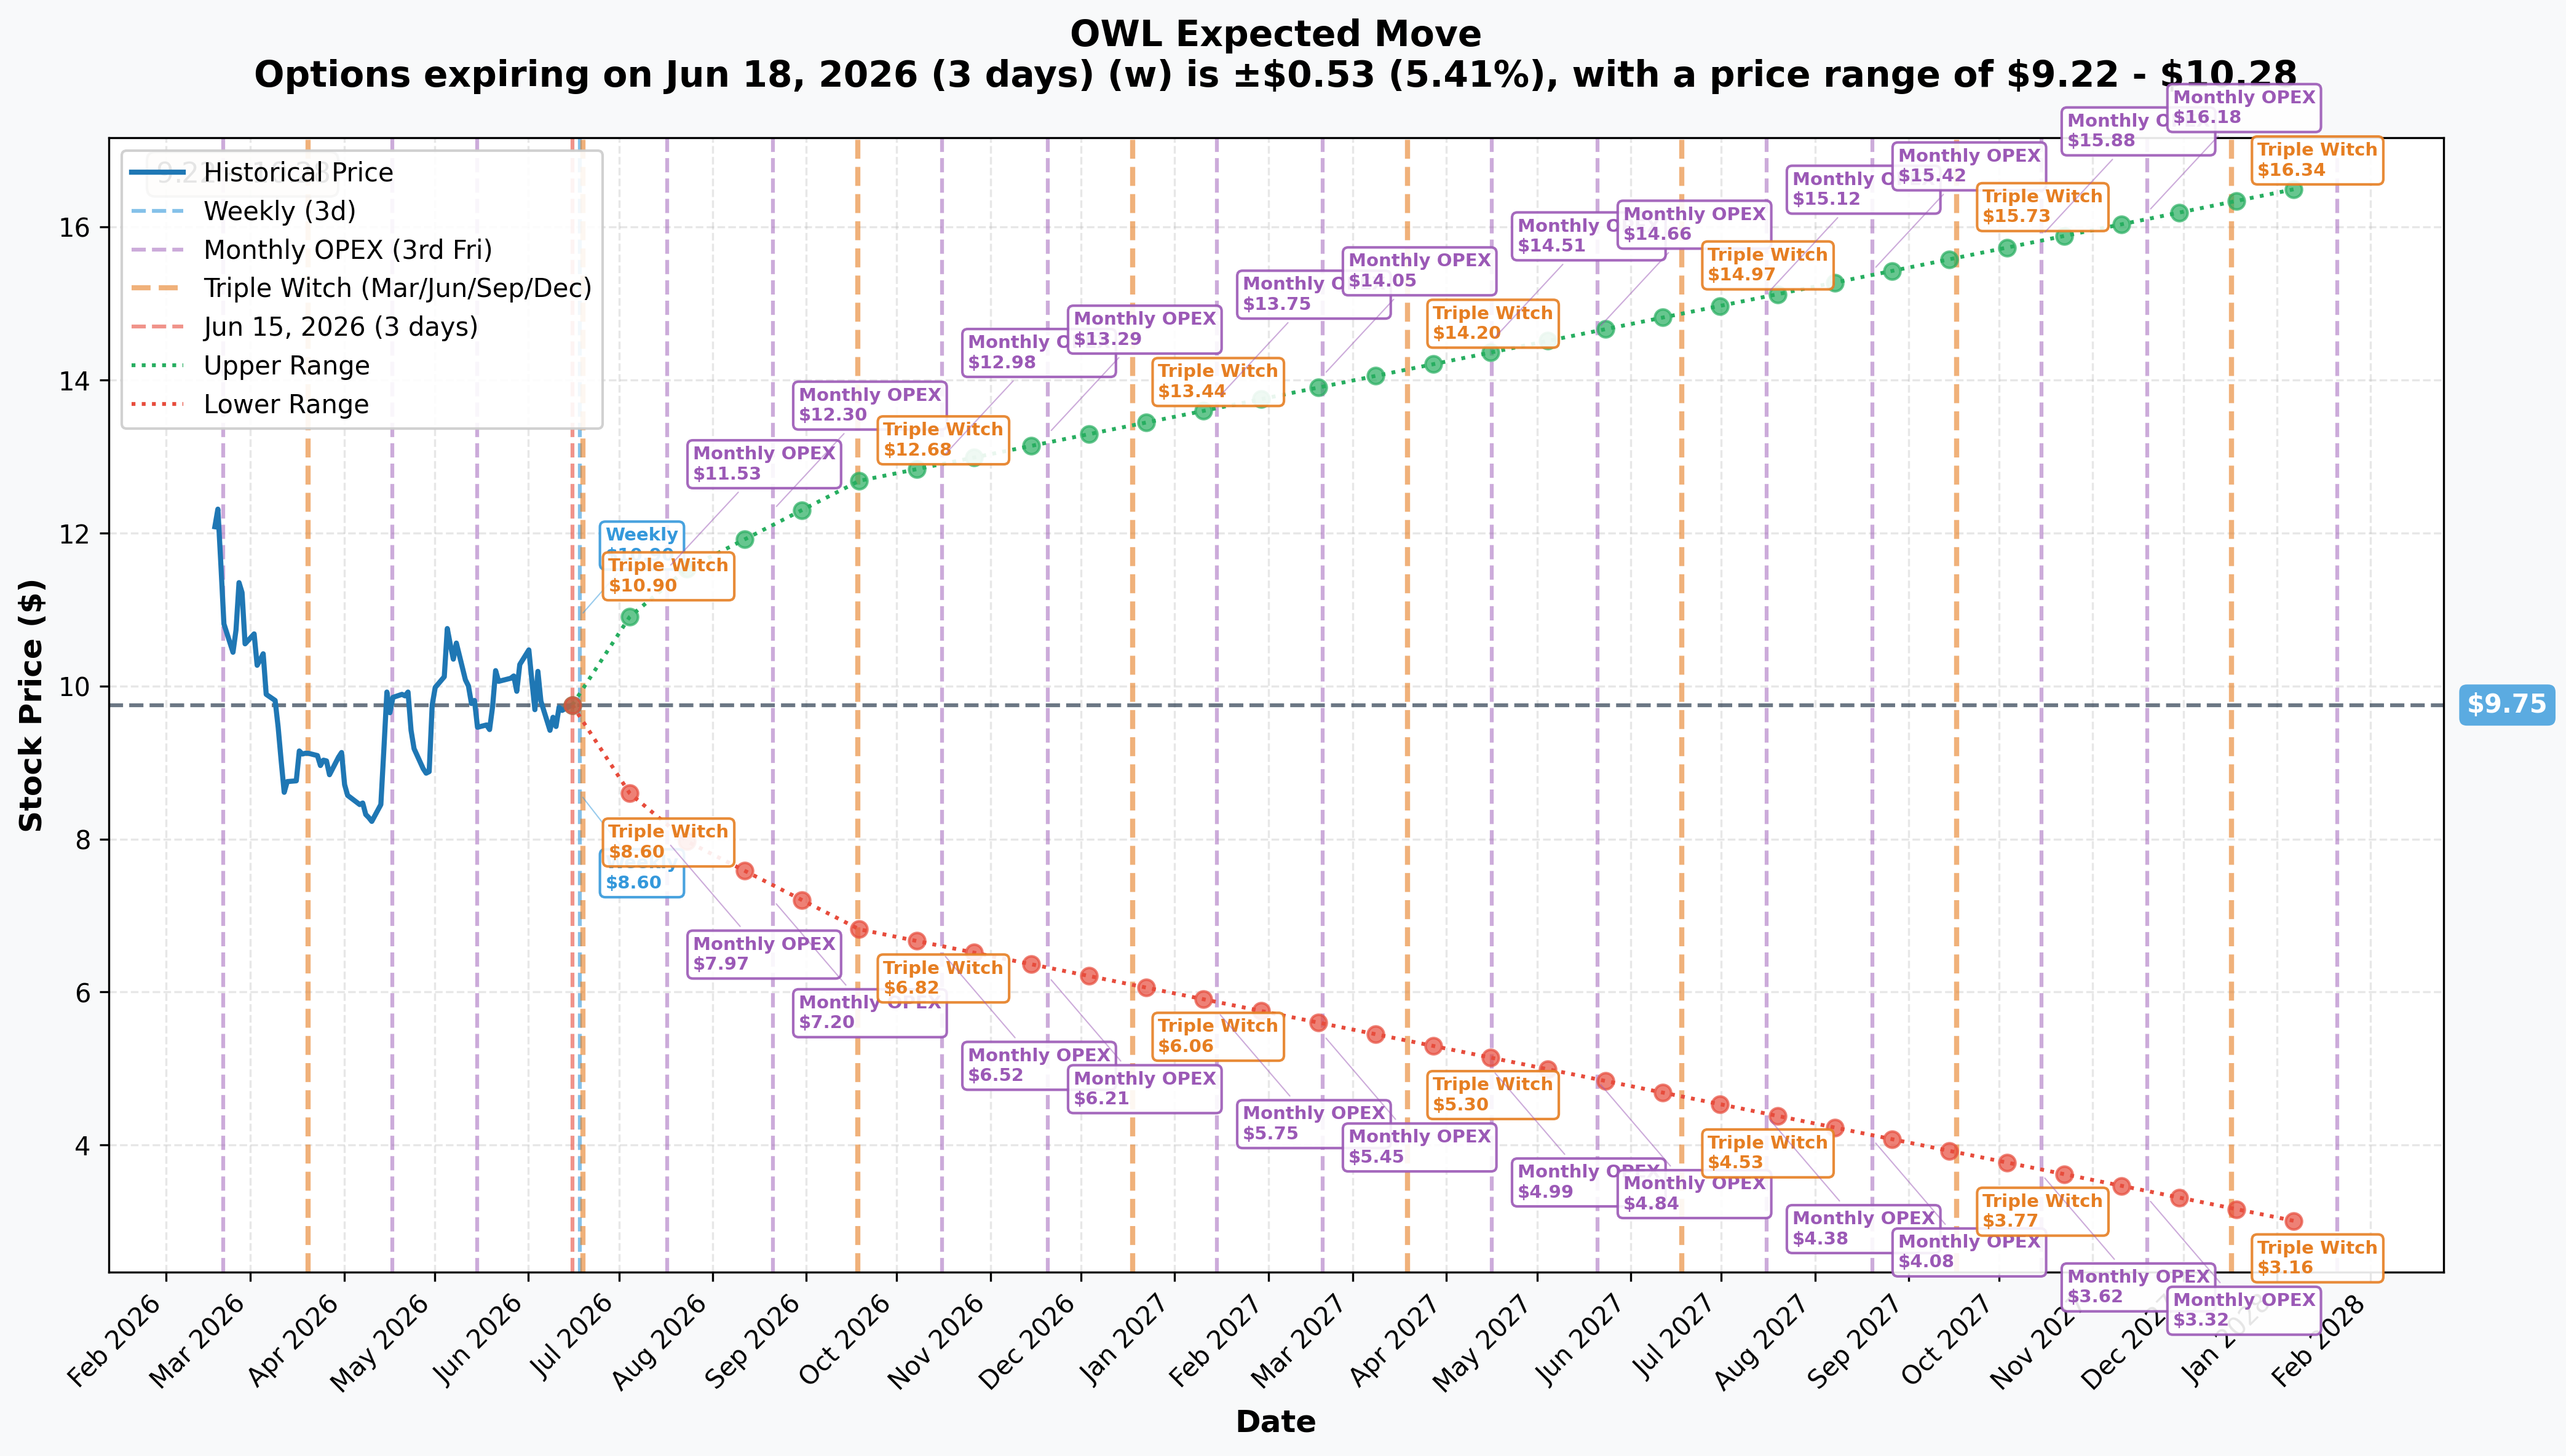
The options market is pricing in substantial uncertainty across every time horizon:
- 📅 Monthly (exp 2026-07-17): ±17.02% → Range $8.09 – $11.41
- 📅 Quarterly (exp 2026-09-18, the long-leg expiry): ±30.05% → Range $6.82 – $12.68
The quarterly range of $6.82–$12.68 is the most relevant figure here. By September 18 — when the long Sep $12P expires — the options market is pricing in a wide enough cone that OWL could be anywhere from ≈$6.82 on the low end to ≈$12.68 on the high end. The $12 strike sits right at the TOP of that quarterly range, meaning the long put is already in-the-money and the desk is protected across the entire lower half of the probability cone.
Key takeaway: The implied-move math tells us the market itself is uncertain about OWL's direction. The put diagonal buys the bear side of that uncertainty at a ≈$13M net cost, with the Sep $12P already ITM, protected all the way down to zero and collecting value with every dollar OWL falls below $12.
🎪 Catalysts
Already Happened — What Drove OWL Here
Q1 2026 Earnings — Mixed Headline, Ugly Internals (Reported May 6, 2026) GAAP revenue came in at $753.8M (+10% YoY), and fee-related earnings hit $393.6M (+14%) with AUM reaching $314.9B (+15%). The headline numbers looked fine. The internals told a different story: new-loan origination collapsed 41% YoY to just ≈$676M against ≈$1.5B in repayments — Blue Owl's BDCs are shrinking their loan books faster than they're growing them. The stock fell ≈6.2% after-hours on the print.
IMPORTANT DISTINCTION — OWL vs OBDC: The "dividend cut" and "NAV markdown" headlines you may have seen refer to OBDC (Blue Owl Capital Corp., the publicly-traded BDC), not the OWL parent management company. OBDC cut its base dividend from $0.37 to $0.31 and took NAV pressure from spread widening. OWL the manager still paid its own $0.23/share dividend and grew its management fees. But OBDC's stress is a direct read-through to OWL's fee base — that's why it matters.
The Redemption Gate — Private Credit's Worst Nightmare This is the central bear catalyst. Blue Owl permanently halted quarterly tender redemptions in its non-traded BDC OBDC II — replacing "quarterly liquidity" with periodic capital distributions funded by asset sales. Certain Blue Owl BDCs sold $1.4B of direct-lending investments at 99.7% of par to four North American pension and insurance buyers to fund this payout. The fact that they got 99.7% of par is a bull-case data point — no fire-sale markdowns yet. But closing a redemption gate is widely seen as a red flag, and the market has been pricing it as one ever since.
Retail Inflows Collapsed The entire private-credit retail distribution model — wealthy individuals and RIAs putting money into semi-liquid BDC vehicles — hit a wall. As CNBC reported, investors who poured billions into private credit now want their money back, and Blue Owl's retail inflows into semi-liquid vehicles slowed sharply. This isn't OWL-specific — BlackRock and Blue Owl both triggered redemption gates in 2026 in what analysts are calling private credit's "first real liquidity test."
The Analyst Downgrade Wave The institutional community has been systematically cutting exposure to OWL. Goldman Sachs downgraded to Neutral from Buy. UBS downgraded to Neutral from Buy. Keefe, Bruyette & Woods downgraded to Market Perform. BofA cut its price target to $12.25 from $13.50. Deutsche Bank, Barclays, BMO, TD Cowen, and Piper Sandler all cut targets through early 2026. The consensus average still sits at ≈$14.79, which is ≈51% above the current price — but the trend is unmistakably one of de-rating.
Governance/Legal Overhang Law firm Haeggquist & Eck announced an investigation into how the $1.4B asset liquidation and OBDC II redemptions were handled — adding a headline-risk layer on top of the fundamental concerns.
Upcoming Catalysts — What the Put Diagonal Is Watching For
Q2 2026 Earnings — Expected ≈August 5–6, 2026 📅 This is the single most important catalyst for this trade. Based on Blue Owl's reporting cadence (Q4'25 on Feb 18, Q1'26 on May 6), Q2 results are expected the first full week of August — and the Sep-18 $12 put covers this print entirely. Watch for: gross/net fundraising flows (did the retail exodus continue?), BDC redemption trends (any more gates needed?), any credit quality changes (non-accruals, below-par marks), and FRE margin trajectory. A miss on any of those metrics could push OWL below the $9 gamma floor — the zone where the long put starts generating serious profit.
Continued BDC Asset Sales & Return-of-Capital Distributions The pace and pricing of future $1.4B-style asset sales matter enormously. The first batch went at 99.7% of par — a healthy sign. Any future sale below par would signal genuine credit stress and would likely accelerate the sell-off.
Private-Credit Sector Contagion Watch As both BlackRock and Blue Owl have now triggered redemption gates, the question is whether this is contained or spreads. If a third major manager gates or if retail flows turn decisively negative across the sector, OWL catches additional contagion pressure regardless of its own fundamentals.
Rate/Spread Path The OBDC dividend cut was attributed in part to "an extended period of declining base rates and spread compression". Further rate cuts and/or continued spread tightening pressure the NII and management-fee economics that are already under scrutiny.
$29.9B of Undeployed Capital — The Bull-Case Wild Card Blue Owl has ≈$29.9B of not-yet-fee-paying capital on its books, worth ≈$349M of incremental annual management fees if deployed. If origination recovers and this capital gets put to work, it would be a meaningful positive catalyst that the put diagonal bet against.
🎲 4-Reader Interpretation
🚀 YOLO Trader
Real talk: buying a $12 put on a stock at ≈$9.77 might seem redundant — it's already ITM. The play here isn't catching the initial crash; it's betting the stock keeps falling or stays crushed through September. If you want to express a similar bear view with less capital, you could look at OTM puts (say Sep $9 or $8) for much cheaper per-contract cost, with the trade-off that OWL needs to actually break below those levels to profit. The desk's put diagonal is a sophisticated structure — it reduces net cost by selling the near-term put to finance the longer position. Just know this: OWL is already down 63%. Big further drops are possible but the stock has already done a lot of repricing. If you trade this, know your max loss is 100% of whatever premium you pay.
📊 Swing Trader
The $10 gamma wall is your line in the sand. OWL has been unable to reclaim $10 for weeks — that resistance level is where call-side option positioning is heaviest. If you're bearish and waiting for entry confirmation, watch for a failed bounce at $10 on volume, then the trade sets up for a re-test of the $9 gamma support floor. A break below $9 (which is the support floor from the gamma data) would be technically significant and would accelerate downside toward the $8 zone (inside the monthly implied-move lower bound of $8.09). Q2 earnings in early August is your binary event — the short-term Jun $11P expires June 18, giving the diagonal structure more flexibility heading into that print.
🛡️ Premium Collector
With OWL pinned in the $9–$10 gamma band and implied volatility elevated across the board, selling covered calls on any OWL stock you own (around the $10 gamma-resistance level, June or July expiry) is a way to generate income while you wait for resolution. The key caveat: elevated IV also makes put-selling dangerous here. Selling naked puts on OWL while the fundamental story is still uncertain is not a comfortable risk/reward. The stock has already fallen 63% — it could fall another 30-40%. Premium collecting works best on stable names; OWL is still in the "figuring out the bottom" phase.
🌱 Entry-Level / Beginner
Here is what just happened in plain English. A big trader bought the right to sell Blue Owl Capital stock at $12 per share anytime before September 18, 2026. The stock is only at ≈$9.77 right now — so the $12 "put" is already worth at least ≈$2.23 of real value (the difference between $12 and $9.77). To make that $24M long put cheaper, they also sold someone the right to sell OWL shares at $11 by June 18, 2026 — collecting ≈$11M in premium to offset the cost. The net bill: ≈$13M. This is called a "put diagonal" — it's a bearish bet structured to pay less upfront by combining a long put with a short put at a different strike and expiration. The trader profits if OWL stays below $12 through September. They lose if OWL somehow bounces back toward or above $12 — giving up the $13M they paid. The $12 long put is the insurance; the $11 short put is how they partially paid for it.
⚠️ Risk Factors
Options trading involves substantial risk of loss and is not suitable for all investors. Specific risks for this trade and thesis:
The Put Diagonal Could Lose Its Full ≈$13M Net Debit If OWL somehow recovers sharply toward or above the $12 strike by September expiry, the long $12P loses most of its value. A stock that has already fallen 63% can — and sometimes does — stage violent reversals. The consensus analyst target of ≈$14.79 is still ≈51% above current price; a sentiment turn could be fast.
The Bull Case Is Real and Could Play Out Quickly >90% of Blue Owl's AUM is in permanent or long-duration capital, generating recurring management fees that are not easily dislodged. AUM hit $314.9B (+15% YoY), FRE grew 14%, and the company still raised $11B in Q1 alone. As some contrarians argue, this looks like a liquidity-sentiment crisis, not a credit blow-up. If that framing wins and flows stabilize, the stock could re-rate fast — and the put diagonal would lose value rapidly.
The $1.4B Asset Sale Went at 99.7% of Par — No Fire Sale Yet The first tranche of OBDC II asset sales cleared at 99.7% of par — a constructive datapoint. If future sales also clear at or near par, the "credit blow-up" narrative weakens, removing the primary downside catalyst for the put position.
Short Jun $11P — Assignment Risk Through June 18 The SELL leg of the diagonal creates assignment risk if OWL falls sharply below $11 before June 18, 2026. If OWL crashes below $11 in the next few days and the short put gets assigned, the seller of that put is obligated to buy OWL stock at $11 (while the market trades lower). The long Sep $12P offsets this economically, but operationally assignment risk is real.
This Is a Block Cross — Known Counterparty Because this trade printed as a negotiated block cross (not an aggressive lit-market sweep), we know a desk found a willing counterparty at today's price. The counterparty on the other side may have a legitimate bull case or an existing position they wanted to exit — this is $13M in net premium changing hands between two parties who already agreed on terms, not a panicked directional slam. Weigh the structure and the catalysts over the raw premium size.
What the OPRA Tape CANNOT Tell Us: We know the mechanism (block cross), size (90,083 contracts each leg), prices ($2.66 long / $1.23 short), and direction (net long put = bearish). We do not know the buyer's identity, whether this is a standalone bearish bet or a hedge against a large existing long OWL equity position, or the buyer's conviction on the Jun $11P open vs close (next-day OI resolves). Even a $13M net position in this context could be hedging a much larger long stock holding worth 10x more — in which case the "bearish" framing misses the full picture.
🎯 The Bottom Line
Here's the deal: a large desk just structured a ≈$13M net bearish put diagonal on Blue Owl Capital — not because they stumbled into the trade, but as a carefully constructed hedge or directional bet that someone worked deliberately as a negotiated block.
The setup: OWL has already lost ≈63% from its peak. The stock is in the high-$9s, pinned below $10 gamma resistance, facing a Q2 earnings print in early August that will tell us whether the private-credit liquidity crisis was a momentary blip or a structural fee-base problem. The September $12 put is already in-the-money, and the structure was financed by selling the near-term June $11 put for ≈$11M.
The honest counterpart: Blue Owl's fundamentals are still growing. AUM is $314.9B (+15%), fee-related earnings are up 14%, and the company has $29.9B of undeployed capital that could generate ≈$349M more in annual fees when deployed. The $1.4B forced sale went at 99.7% of par — no fire-sale pricing yet. Some serious analysts still have Buy ratings and targets well above $12. This could be a name that has overshot to the downside.
What to watch:
- 📅 ✅ RESOLVED (2026-06-16): OPRA OI update confirmed the Sep $12P as a fresh opening long (56 → 90,178, Δ +90,122) and resolved the Jun $11P as a close (91,701 → 944, Δ −90,757) — a bearish put roll, not a fresh diagonal.
- 📅 June 18, 2026: Near-term Jun $11P expiry — the short leg of the diagonal expires; watch whether OWL is above or below $11 at close
- 📅 Early August 2026 (≈Aug 5–6): Q2 earnings — the single most important catalyst for this structure; fundraising flows, BDC redemption trends, and any credit-quality deterioration are the key metrics
- 📅 September 18, 2026: Sep $12P expiry — the long leg of the diagonal expires
If you're bearish on OWL: The put diagonal structure today gives you a framework to reference. The $9 gamma support level is the near-term floor to watch — a confirmed break below $9 opens meaningful downside toward the $6.82–$8 zone suggested by the quarterly implied-move lower bound.
If you own OWL stock: The $10 gamma wall is your ceiling until there's a fundamental catalyst. The Q2 August print is the pivot moment — solid fundraising and improving origination could break the downtrend; another miss on flows or any credit-quality surprise to the downside validates the put diagonal thesis.
If you're on the sidelines: This is a high-stakes, high-uncertainty situation in a sector (private credit) that is genuinely being stress-tested for the first time. The $13M net put diagonal is someone's bet that the stress test isn't over. Don't fight that bet without a clear thesis for why OWL's flows stabilize before August.
A ≈$13M net bearish put diagonal on a beaten-down private-credit manager — patient, structured, with a September runway that captures Q2 earnings and any sector contagion that follows. The structure is in-the-money from day one. The risk is that 63% already fallen turns out to be enough.
Disclaimer: Options trading involves substantial risk of loss and is not suitable for all investors. This analysis is for educational and informational purposes only and does not constitute financial advice. Past unusual options activity does not guarantee future returns. The OWL September 2026 $12 put diagonal involves defined-risk on the net debit (≈$13M) but also assignment risk on the short June $11 put leg. Options can expire worthless, resulting in total loss of premium paid. The open/close classification for the June $11P leg has been resolved by next-day OPRA open interest as a CLOSE (a bearish put roll). Always conduct your own due diligence and consider consulting a licensed financial advisor before making any trading decisions.
Last updated: 2026-06-16 — next-day OPRA OI INVERTED the structure read: Jun-18 $11P resolved as a CLOSE (OI 91,701 → 944, Δ −90,757) and Sep-18 $12P as an OPEN (OI 56 → 90,178, Δ +90,122). Corrected from "fresh bearish put diagonal" to a bearish put ROLL (same view, rolled up and out). Direction unchanged. (Originally published June 15, 2026.) Body cleaned up 2026-06-22.