🦉 OWL's ≈$97M Call Blowout Is the Biggest Trade on the Board — and It's Not a Bet on the Stock
📅 2026-08-12 | 🔥 Largest Print of the Day
✅ Updated 2026-08-13 pre-market — the next-day OPRA open interest confirmed the dividend-play thesis, emphatically. Open interest on the August-21 $10 call collapsed 142,881 → 5,973 (−136,908, −95.8%). We predicted it should come in "flat to sharply below" the 142,881 baseline and should not rise by anything close to +428,280. It fell by 96%. The contracts were exercised and extinguished, exactly as a dividend capture requires — the financing/share-substitute fallback is ruled out. The provisional BTO label is retired: this resolves as exercise, not an opening position. See the ✅ RESOLVED box.
Somebody — really, a whole crowd of professional desks — traded 428,280 contracts of Blue Owl Capital's (OWL) August-21 $10 call in just under 2.5 minutes this afternoon, for roughly $97.0 million in notional. That is the single largest trade on today's entire options board, options or otherwise. Before you picture a hedge fund YOLO-ing on Blue Owl, know this up front: the tape says this is a dividend play, not a directional bet, and we can prove the arithmetic. Blue Owl goes ex-dividend tomorrow, and today was the last day a call holder could exercise and still collect it.
🏢 Who Is Blue Owl Capital
Blue Owl Capital is a US alternative asset manager that provides "permanent capital solutions to middle-market companies, alternative asset managers, and corporate real estate stakeholders," spanning direct lending and alternative credit, GP strategic capital (financing to other private-equity managers), and real estate — including triple-net-lease property — per the company profile on StockAnalysis. It sits in the Financials sector, Asset Management industry, trades on the NYSE, and is co-led by co-founder/chairman/co-CEO Douglas Ostrover and co-CEO Marc Lipschultz.
The headline numbers: $319 billion in assets under management as of June 30, 2026 — "a five-fold increase since Blue Owl's public listing five years ago," per the Q2 2026 results release — against a market capitalization of ≈$19.1 billion on ≈1.56 billion Class A shares outstanding. That gap between $319B managed and $19.1B of equity value is the entire business model: OWL collects fees on other people's capital rather than carrying it on its own balance sheet.
And crucially for today's trade: OWL pays a real, growing dividend — $0.92 annualized, a 7.50% yield at the current $12.27 share price, per StockAnalysis's dividend page. That yield is the entire reason 428,280 call contracts changed hands today.
💰 The Trade, in Plain English
At 15:08:17 to 15:10:53 ET — a 2.5-minute window, less than an hour before the close — a series of desks traded the August-21 2026 $10 call in 40 separate floor prints, in three distinct clip sizes: 18 prints of 1,260 contracts, 18 prints of 18,240 contracts, and 4 prints of 19,320 contracts. Add it up and you get 428,280 contracts, ≈$97.0 million of premium, against spot of $12.27.
For scale: prior open interest on this contract was 142,881 contracts. Today's volume alone was ≈3.0× the entire existing open interest in this strike.
One honest note on how we built this table. The flow feed that first caught this trade only captured 20 of the 40 floor prints. The table below — and every number in this article — was rebuilt directly from the options tape, which is why it shows the complete picture the capture missed. This is exactly the kind of gap that verifying against the tape is designed to catch.
| Time | Buy/Sell | Call/Put | Expiration | Premium | Strike | Volume | OI | Size | Spot | Option Price | Option Symbol |
|---|---|---|---|---|---|---|---|---|---|---|---|
| 15:08:17 | BUY | CALL | 2026-08-21 | $5,216,400 | $10 | 428,280 | 142,881 | 22,680 (18 × 1,260) | $12.27 | $2.30 | OWL20260821C10 |
| 15:08:43 | BUY | CALL | 2026-08-21 | $74,691,600 | $10 | 428,280 | 142,881 | 328,320 (18 × 18,240) | $12.27 | $2.2748 | OWL20260821C10 |
| 15:09:49 | BUY | CALL | 2026-08-21 | $17,388,000 | $10 | 428,280 | 142,881 | 77,280 (4 × 19,320) | $12.27 | $2.25 | OWL20260821C10 |
🤝 Tagged floor block — every one of these 40 prints executed on the exchange floor, not as a lit sweep hitting a displayed book. Summed across the three tiers, the computed premium is ≈$97.3M; the volume-weighted average price across all 428,280 contracts comes out to $2.2654, which is the ≈$97.0M figure used throughout this piece — the small gap is just rounding across the three tier-average prices. Also worth saying plainly: the BUY label on a floor print like this is a reported convention, not proof of one-sided directional conviction. Every one of these 40 trades matched a buyer against a seller, both professionals, and — as the arithmetic below shows — the entire point of the exercise is that both sides come out ahead.
✅ RESOLVED — Open Interest Collapsed 96%: The Dividend Capture Is Confirmed
Updated 2026-08-13 pre-market. Resolving OPRA snapshot timestamped August 13 (reflects the August 12 close, after this print); baseline is the August 12 snapshot (reflects the August 11 close, before this print).
| Leg | Baseline (Aug-12) | Resolving (Aug-13) | Δ | Print size | What we published | Verdict |
|---|---|---|---|---|---|---|
| Aug-21 $10 call (deep ITM, 428,280 traded) | 142,881 | 5,973 | −136,908 (−95.8%) | 428,280 | "flat to sharply below the 142,881 baseline … should NOT rise by anything close to +428,280" | ✅ EXERCISED / EXTINGUISHED — dividend play confirmed; BTO label retired |
This is the answer key working exactly as designed. We published a falsifiable test with two branches. The dividend branch required open interest to fall; the financing branch required it to jump by hundreds of thousands and stay elevated. Open interest fell 136,908 contracts, leaving 5,973 of an original 142,881 — a 96% extinction. There is no ambiguity left.
What actually happened: deep-in-the-money calls at a $10 strike against a $12.27 stock were bought and immediately exercised to capture the dividend, retiring both the newly-created contracts and nearly all of the pre-existing line. That is why the biggest print on the board is not a bet on Blue Owl — it is a cash-and-carry mechanic that ends with the options gone.
The order-type label is retired, not corrected. "BTO" implies a position someone still holds this morning. Almost nobody does. The honest description is exercise-and-extinguish.
Control check. The collapse is concentrated at the deepest in-the-money line, which is where dividend exercise is most economic: $12.50C 1,324 → 1,422 (+98), $15C 5,789 → 5,789 (0), $7.50C 0 → 0. The neighbouring strikes are untouched.
🤓 What This Actually Means — Plain English
Here's the mechanic, from first principles, and why none of it is a signal to trade Blue Owl stock.
Step 1 — the math on this specific call makes exercising it free money. The $10 call's intrinsic value against a $12.27 spot is $2.27. The volume-weighted price these 428,280 contracts actually traded at was $2.2654 — a hair below intrinsic. That means the time value embedded in the option was negative $0.0046 a share. In plain terms: whoever bought this call for $2.2654 got something worth $2.27 for less than its floor value. There is no reason to hold that position — you exercise it immediately and lock in the gap.
Step 2 — the dividend tips the scale even further. Blue Owl pays $0.23 per Class A share tomorrow's holders of record. If you're holding a deep-in-the-money call with essentially zero time value left in it, and the stock is about to pay out $0.23 a share to anyone who owns it by tomorrow, the math is simple: exercise now, own the shares, collect the dividend. Leaving the call unexercised means forfeiting $0.23 a share for nothing in return, since there's no time value left to lose by exercising early. That's the textbook trigger for early exercise, and today — the day before the ex-dividend date — was the last day to pull it off.
Step 3 — this is why the volume exploded to 3× open interest. Here's the part that explains the size. When option holders exercise, the assignment doesn't go to a specific short seller — the clearing house randomly (or via a set algorithm) allocates the exercise notices across all open short positions in that contract, including accounts that have no idea a dividend is even happening: index funds, sleepy retail shorts, forgotten hedges. Professional trading desks know this. So in the final hours before the ex-date, they trade enormous volumes of these deep-ITM calls back and forth among themselves — buying and immediately exercising — specifically to maximize their odds of being randomly assigned against those non-exercising shorts and capturing dividends that would otherwise go unclaimed. The bigger the volume they create relative to the existing open interest, the bigger their share of the unclaimed dividend pool. 428,280 contracts against 142,881 existing contracts is exactly that signature. Multiply it out: 42,828,000 shares × $0.23 = ≈$9.85 million of dividend dollars being contested by this single session's activity.
Step 4 — and this is the single most important thing to take away: none of it says anything about where Blue Owl stock is headed. This is a delta-neutral arbitrage between professional trading desks, not a wager. Every one of the 40 floor prints has a buyer and a seller who both know exactly what they're doing and both expect to come out ahead — that's structurally different from a directional trader "betting big" on a stock. If you see "$97M of calls bought" on a headline and think "someone's bullish on Blue Owl," you'd be badly misled. This trade will almost certainly be gone from open interest within a day or two, exercised and extinguished, having never expressed a view on where OWL trades on August 21 or any other date.
📈 Chart Check-Up
1-Year Performance
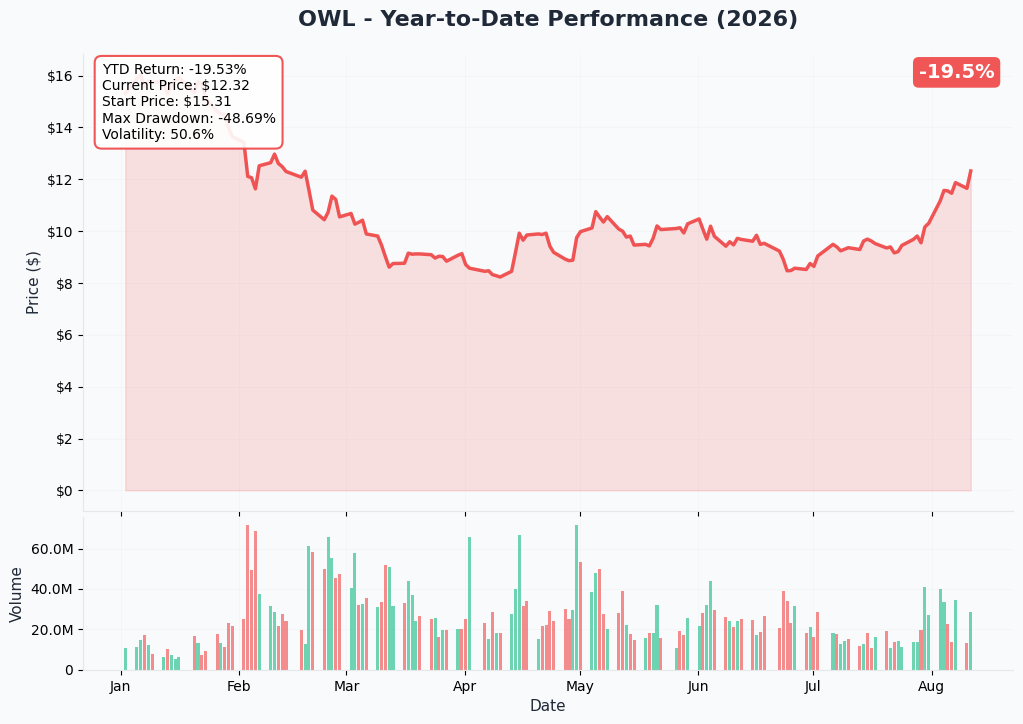
OWL has been a violent round trip this year: down from a 52-week high near $20.58 to a trough of $8.64 on July 1, 2026, then rallying ≈40% back to today's $12.27 — while still sitting ≈−18.9% year to date and ≈−38% over the trailing 12 months, per MarketBeat and StockAnalysis.
Gamma-Based Support & Resistance
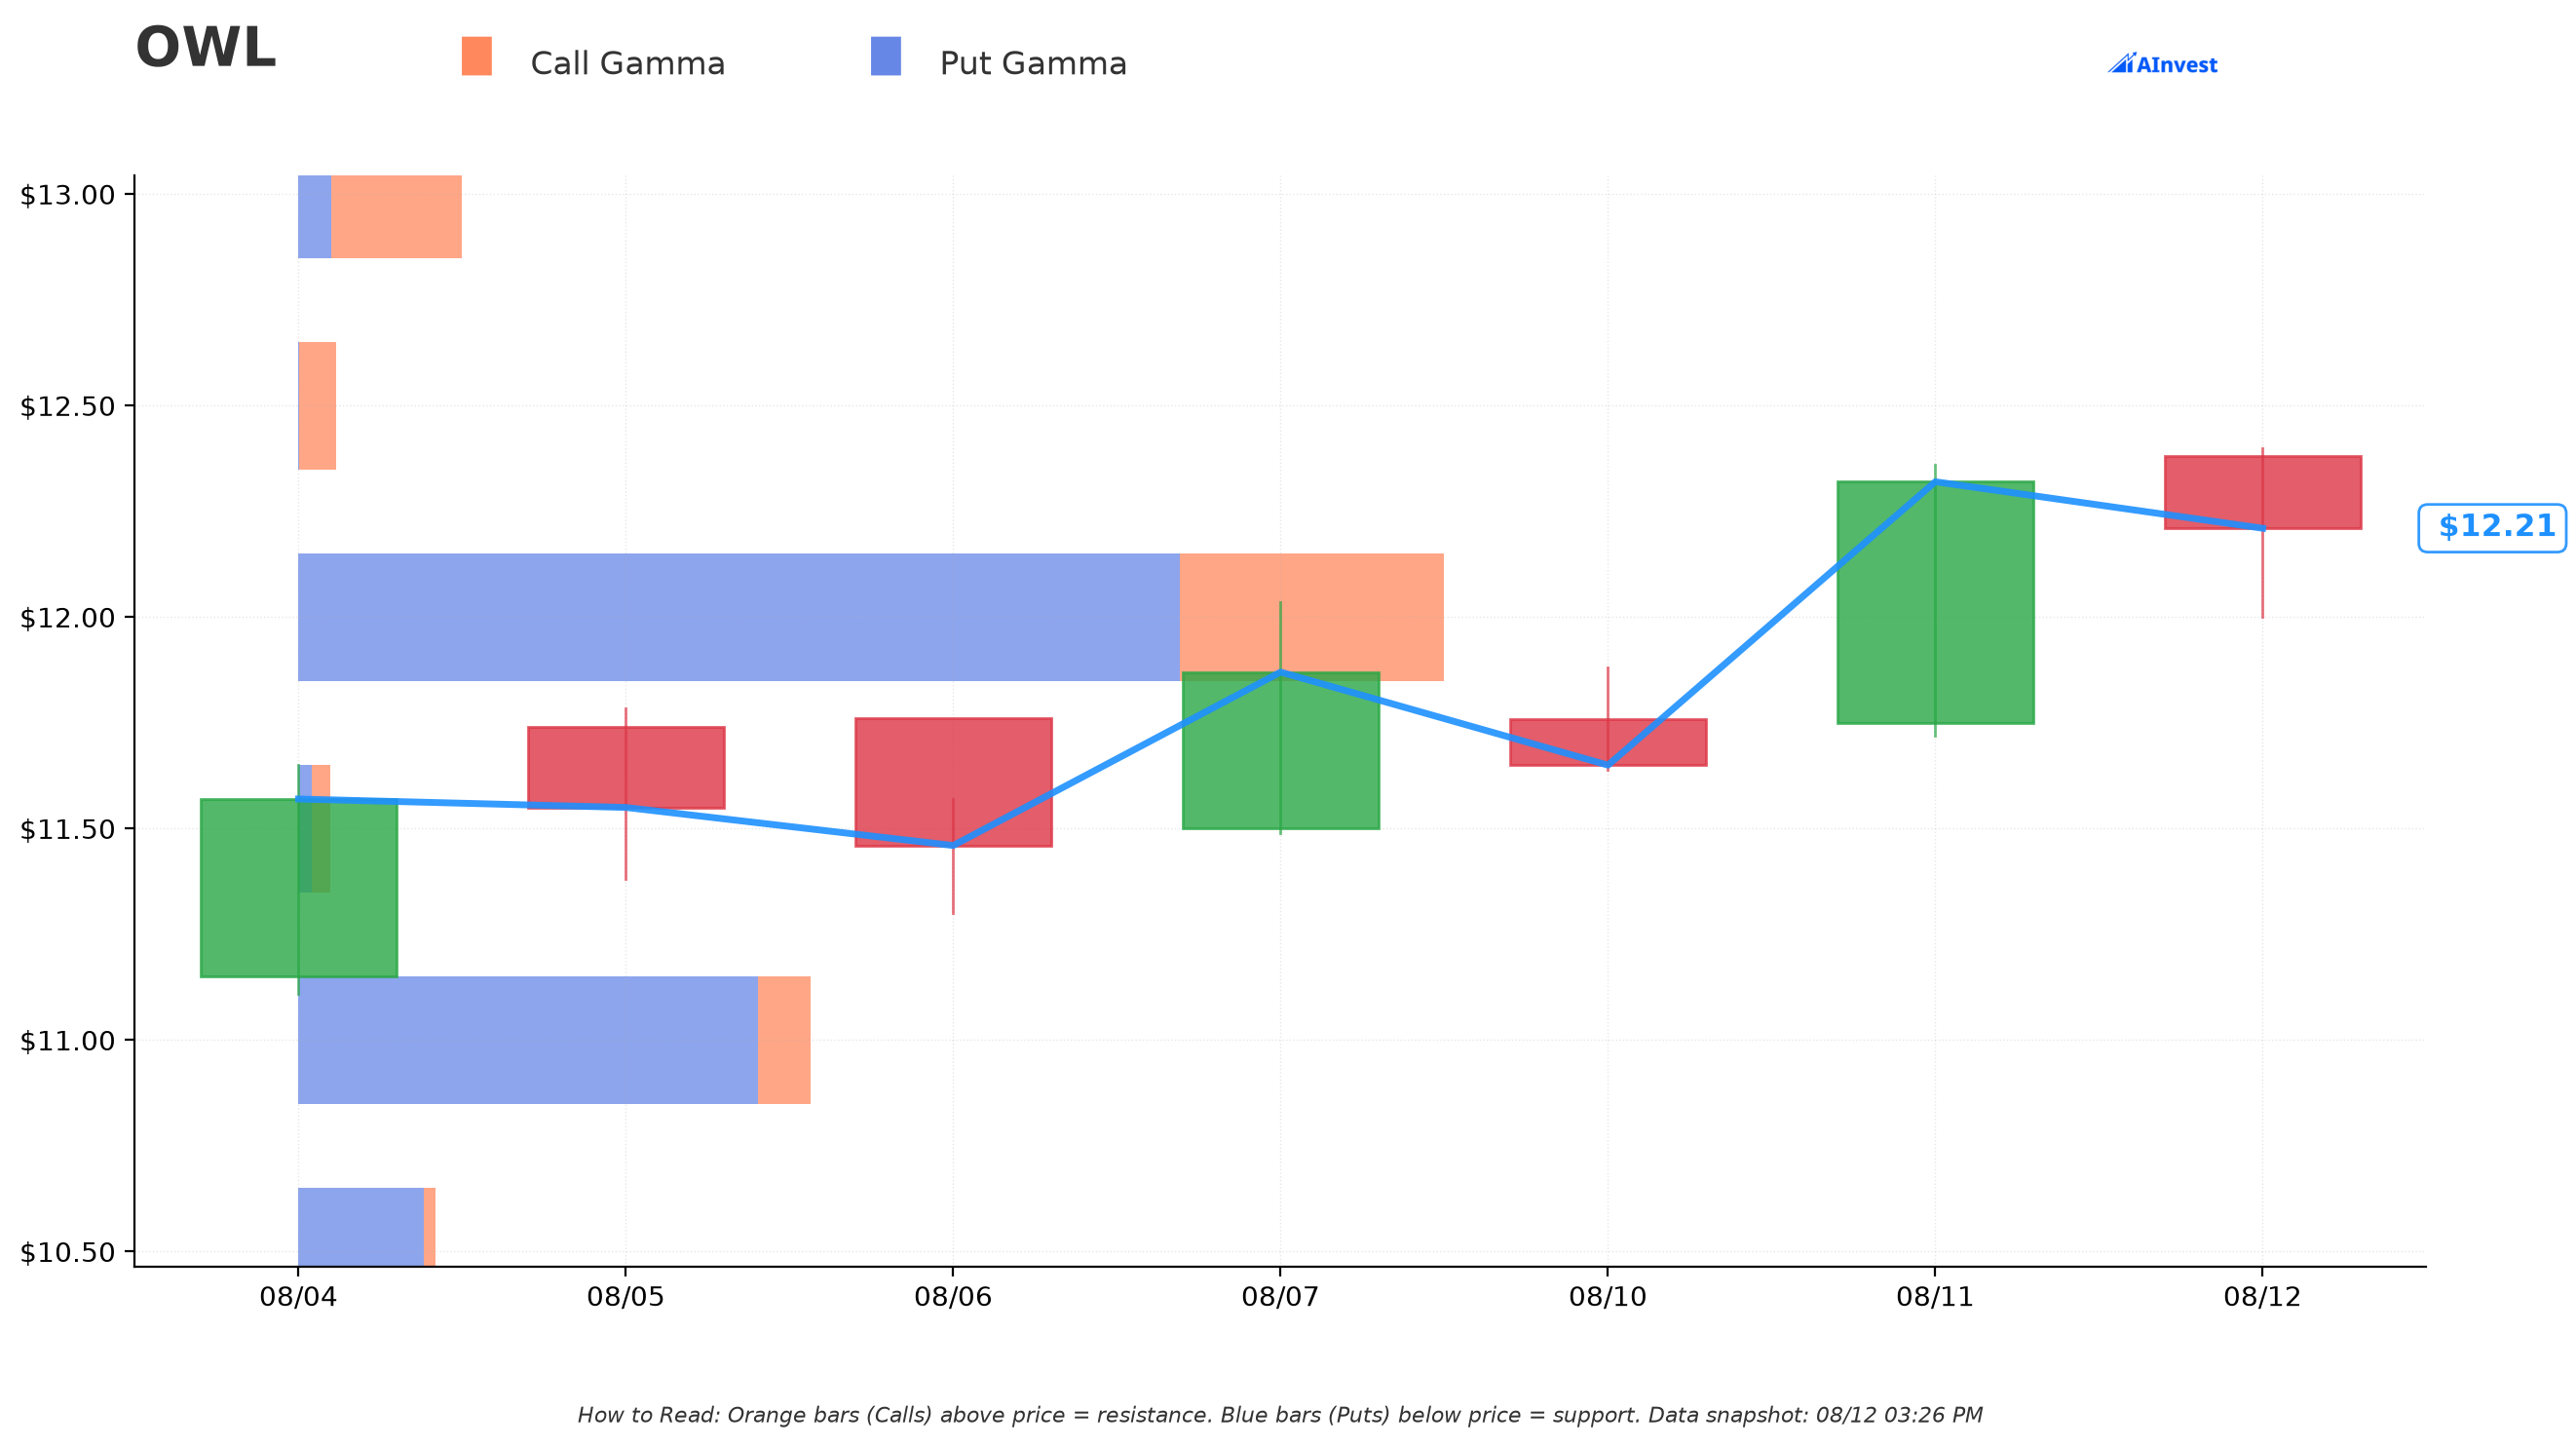
Reading today's open-interest-derived gamma map (gex.json) against a $12.215 reference spot: the nearest support sits right at $12.00, rated "Very Strong" and only ≈1.8% below spot — essentially where the stock is trading now. Below that, support stacks up at $11.00 (≈9.9% down) and $10.00 (≈18.1% down) — notably, $10.00 is the exact strike of today's dividend trade, though the gamma reading there comes from the broader open-interest picture, not from today's print specifically. On the upside, the nearest wall is $13.00, rated "Strong," ≈6.4% above spot. These are inferred dealer-hedging zones built from open interest, not a guarantee — they shift as positioning changes — but they're a useful map of where option flow has concentrated.
Implied Move
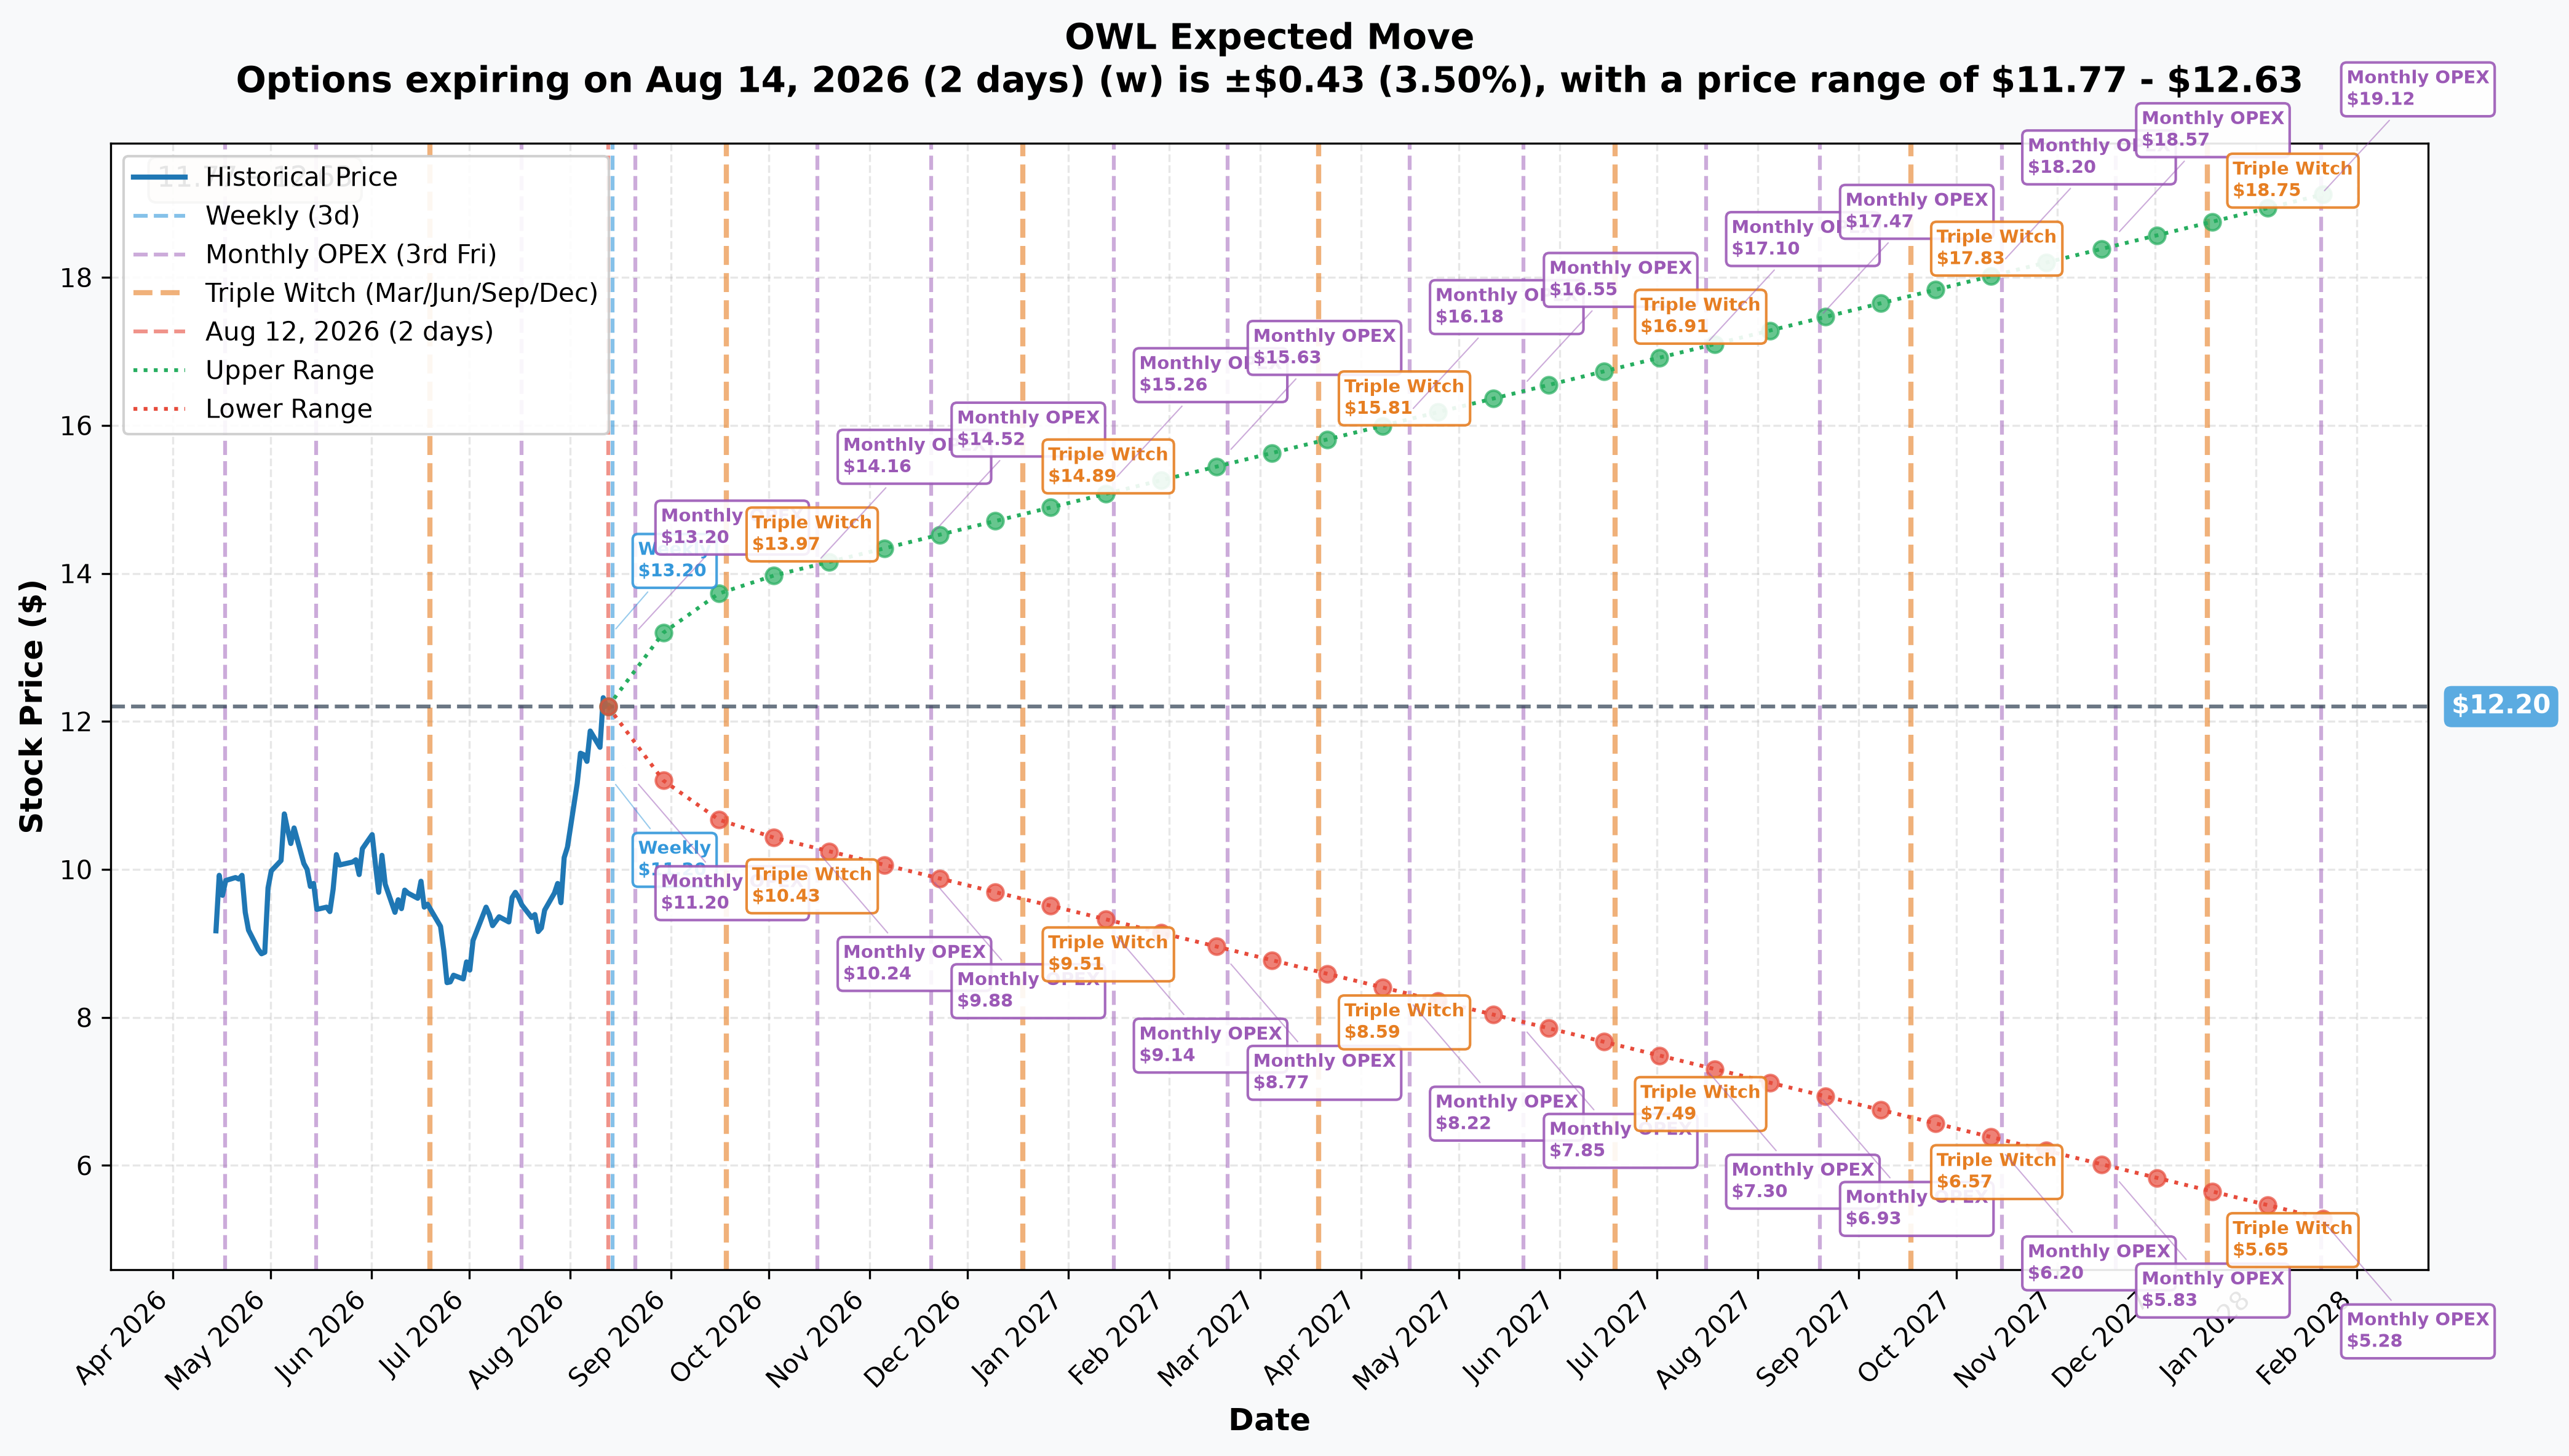
For the same August-21 expiration as today's trade (9 days out), the market is pricing an implied move of ≈6.15%, or ≈$0.75, putting the expected range at $11.45 to $12.95. The nearer weekly expiration (August 14, 2 days out) implies a tighter ≈3.5% (≈$0.43, range $11.77–$12.63). Stretching out, the September 18 triple-witch expiration implies ≈13.24% (range $10.58–$13.82), and the January 2028 LEAPS implies ≈56.7% (range $5.28–$19.12) — all levels sourced from OWL's own options-implied volatility, not from the dividend trade itself.
🎪 Catalysts
⭐ The catalyst that actually explains today's trade
Blue Owl goes ex-dividend TOMORROW — Thursday, August 13, 2026 — with a record date of August 13 and a payable date of August 27, both company-confirmed in the Q2 2026 results release. The dividend is $0.23 per Class A share, declared July 30, 2026 alongside Q2 earnings. The ex-dividend date itself is set by exchange convention, not stated in any company document — but it's independently corroborated by three separate trackers: StockAnalysis, MarketBeat, and DividendHistory.org, all showing August 13.
Keep this distinct from the option's own timeline: the ex-dividend date (August 13) sits eight days before the August-21 option expiration — it is not the same event, and today's trade is timed around the dividend deadline, not around expiration.
Already happened (last ≈3 months)
- July 30, 2026 — Q2 2026 earnings. Adjusted EPS of $0.22 beat the $0.2165 consensus; revenue of $693.56M edged past $693.15M expected, per MarketBeat's earnings history. This release also confirmed AUM at $319 billion and declared the $0.23 dividend now driving today's trade.
- August 5, 2026 — credit-quality update. Blue Owl Capital Corporation's (OBDC) June 30, 2026 results showed non-accruals rising to 2.8% of the portfolio at cost (from 2.0%) even as fair-value non-accruals fell to 0.8%, with NAV per share slipping to $14.26 from $14.41 — described as "markdowns on a small number of names." This is the credit wrinkle worth watching, not a five-alarm fire.
- July 9 and July 17, 2026 — analyst target cuts. Citizens JMP cut its target from $21 to $17 (still Market Outperform), and Oppenheimer cut from $16 to $15 (still Outperform). Both firms stayed bullish on rating even while trimming the number.
- August 11, 2026 — $750M of 6.750% senior notes priced, proceeds earmarked to repay revolver borrowings, per the pricing release — a real-time read on Blue Owl's cost of debt.
Upcoming (estimated, not company-confirmed)
- ≈October 29, 2026 — Q3 2026 earnings, per MarketBeat's estimate, which explicitly flags the date as unconfirmed.
- ≈November 10, 2026 — next ex-dividend date, an estimate from historical spacing, not a company statement.
🎲 Four Ways to Read This — By Trader Type
🎲 The YOLO trader
There is nothing here for you, and that's the whole point of this article. A $97M call print sounds like the kind of thing you'd chase — but this is a delta-neutral dividend-capture trade between market makers who will exercise and extinguish these contracts within a day or two. Chasing this specific strike thinking "smart money is loading up" would mean buying an option that's about to functionally disappear from the board. If you want directional OWL exposure, this trade tells you nothing about which way to lean.
📈 The swing trader
The trade itself isn't your setup, but the gamma map might be. Spot is sitting almost exactly on a "Very Strong" support level at $12.00, with the next resistance up at $13.00 (≈6.4% away) and the August-21 implied move (≈6.15%, range $11.45–$12.95) roughly bracketing that same zone. If you're playing the range, that's your box — just don't mistake today's dividend flow for a signal about which side it breaks.
💰 The premium collector
Worth knowing OWL carries a real 7.50% yield ($0.92 annualized) with four consecutive years of dividend increases, per MarketBeat's dividend history — that's the underlying reason today's options activity exists at all. If you already hold or are considering covered calls on OWL, remember the payout is funded from distributable earnings rather than GAAP profit (GAAP payout ratio is over 700%, cash-flow-basis closer to 80%), which is normal for this sector but worth internalizing before assuming the yield is bulletproof.
🌱 The beginner
Here's a habit worth building: whenever you see a huge, deep-in-the-money call trade near a dividend date, check whether it's a dividend play before assuming it's a bet. The tell is simple — if the option is trading at or below its intrinsic value (strike + option price roughly equal to or less than the stock price) and there's an ex-dividend date coming up before expiration, professionals are very likely capturing the dividend, not expressing an opinion on the stock. That single check would have told you everything about today's OWL trade in under a minute, and it will save you from reading a real signal into what's actually plumbing.
⚠️ Honest Limits — What We Don't Know
Most important: this trade carries no directional signal, full stop. It is a mechanical, essentially delta-neutral dividend-capture arbitrage between professional desks. Treat any interpretation of it as "bullish conviction on Blue Owl" as wrong.
Beyond that, some real gaps in the underlying research:
- We could not read Blue Owl's primary SEC filings. The EDGAR filing browser returned access errors, so the dividend terms above come from the company's press release and third-party trackers, not a primary 8-K or 10-Q.
- Blue Owl's investor relations site returned empty, JavaScript-rendered pages. As a result, fee-related earnings, distributable earnings per share, fee-paying AUM, and gross capital raised for Q2 2026 are not included above — they simply aren't in the headline release, and we won't invent numbers we can't source.
- No precise three-month share-price return is available. Price history we could retrieve began in early June 2026, so the June-trough-to-today comparison substitutes for an exact 3-month figure.
- Two data conflicts we're flagging rather than resolving: short interest is reported as 20.53% of float by StockAnalysis but 9.95% of float by MarketBeat — likely different float definitions, but materially different numbers either way. And the dividend declaration date is July 30 per the company's own press release, but listed as July 28 by MarketBeat — we defer to the primary release (July 30) but note the discrepancy.
This article is for informational purposes only and is not investment advice. Options trading involves substantial risk, including the potential loss of the entire premium paid, and is not suitable for all investors.
Last updated: 2026-08-13 (pre-market) — the next-day OPRA open-interest snapshot confirmed the dividend-capture thesis on the falling branch. Aug-21 $10C 142,881 → 5,973 (−136,908, −95.8%): EXERCISED / EXTINGUISHED. The provisional BTO label is retired — these contracts were exercised, not held open — and the financing/share-substitute fallback is ruled out. The ⏳ callout was replaced with the ✅ RESOLVED box; the article's thesis and title were already correct and are unchanged.