🛡️ PDD $4.46M Credit Collar: A Desk Gets Paid to Cap Upside at $125 Through June 2027
📅 2026-08-03 | 🔥 Unusual Activity Detected — Multi-Leg Options Block Cross
✅ UPDATE — August 4, 2026 pre-market: the collar is confirmed newly opened. The Jun-2027 $125 call rose 943 → 14,352 (+13,409) and the $55 put rose 1,322 → 14,701 (+13,379) — both ≈99% of their 13,500-lot prints. See the ✅ RESOLVED box.
🎯 The Quick Take
Someone crossed a 13,500-contract collar on PDD Holdings on 2026-08-03 at 2:26:47 PM ET — selling the June 2027 $125 calls and buying the June 2027 $55 puts, both legs printing in the same package on the same millisecond. Net result: they got paid $4.46M to put this on, not the other way around. This isn't a bullish bet or a bearish bet in the traditional sense — it's someone (most likely already long a big chunk of PDD stock) agreeing to walk away from everything above $125 in exchange for a floor at $55, and pocketing cash on top of the deal.
🏢 Company Overview
PDD Holdings Inc. is the Cayman-domiciled parent of Pinduoduo (China's discount-focused domestic e-commerce marketplace) and Temu (the international cross-border discount marketplace that expanded aggressively into the US and Europe). PDD trades as an ADR on Nasdaq (MarketBeat).
| Metric | Value |
|---|---|
| Sector | Consumer Discretionary — E-commerce / Internet Retail |
| Market cap | $128.45B |
| Trailing P/E | 9.47x |
| Forward P/E | 7.96x |
| Cash & equivalents | $63.22B vs. $65.70B enterprise value |
| TTM revenue | $64.14B, +9.9% YoY |
| Gross margin / net margin | 56.0% / 21.9% |
| Beta | −0.01 (essentially no correlation to the US market) |
(Company data via stockanalysis.com and stockanalysis.com statistics.)
PDD is down ≈22.0% year-to-date in 2026 (started the year at $115.75, now $90.23) — more on that in the chart section below.
💰 The Option Flow Breakdown
📊 What Just Happened — the Trade Table
🤝 BLOCK CROSS — this printed as a multi-leg block cross: a broker negotiated both legs off the open book and crossed them at the same instant. There's a known buyer and a known seller on the other side of this — it did not sweep the lit market.
| Leg | Time (ET) | Buy/Sell | Call/Put | Expiration | Premium | Strike | Volume | Prior OI | Size | Spot | Option Price | Option Symbol |
|---|---|---|---|---|---|---|---|---|---|---|---|---|
| 1 | 14:26:47 | SELL | CALL | 2027-06-17 | $6.83M collected | $125 | 13,503 | 943 | 13,500 | $90.18 | $5.06 | PDD20270617C125 |
| 2 | 14:26:47 | BUY | PUT | 2027-06-17 | $2.38M paid | $55 | 13,500 | 1,322 | 13,500 | $90.18 | $1.76 | PDD20270617P55 |
NET: a $4.455M CREDIT. They were paid $4.46M to put this position on — never read this as "spent $9.2M," that double-counts the two legs. The real capital-at-risk number is the net.
⚠️ Note: Leg 1's daily volume prints as 13,503 versus a 13,500-contract package size — a trivial 3-lot gap, likely a small separate print elsewhere in the session. It does not change the read.
🤓 What This Actually Means — Plain English
Let's decode both legs and the shape they make together:
- Leg 1 (SELL CALL $125, Jun 2027) = STO — Sell to Open. They collected $6.83M in premium to open a short call position. That obligates them to sell PDD at $125 if the stock is above that level next June — and it caps their upside there, hard.
- Leg 2 (BUY PUT $55, Jun 2027) = BTO — Buy to Open. They paid $2.38M to open a long put, which gives them the right to sell PDD at $55 no matter how far it falls. That's a crash floor roughly 39% below today's $90.18.
- Together, this is a wide collar (a "fence") — short a call well above the market, long a put well below it, same expiration, same size. The call strike ($125) sits ≈38.6% above spot; the put strike ($55) sits ≈39.0% below spot. That's about as symmetric a fence as you'll see.
The motive, most likely (INFERRED, MEDIUM-HIGH confidence): this reads as protection on an existing PDD stock position. 13,500 contracts covers 1,350,000 shares — ≈$121.7M worth of stock at today's $90.18. The classic collar move is: buy a floor with the put, and pay for that floor by selling away the upside with the call. Here, the call premium ($6.83M) more than covers the put ($2.38M) — the holder pockets $4.46M on top of getting protection. Below $55, they're covered no matter what. Above $125, their shares get called away — still a 38.6% gain from today, just not open-ended.
The alternative, and we have to be honest about it: if there is no stock behind this, it's a standalone bet — short 13,500 uncapped calls plus long puts, netting −500,850 shares of delta (math below). A naked short call position of that size is theoretically unlimited-risk and would require enormous margin (almost certainly portfolio margin, not standard Reg-T) to carry. That's a real possibility we cannot rule out from the tape, but it's the less likely read for a negotiated block this size — desks don't typically structure eye-watering uncapped risk through a quiet cross when a defined-risk equivalent is available. We genuinely cannot prove which one this is.
Package delta, shown:
- Short call: 13,500 × 100 × −0.2949 = −398,115 shares equivalent
- Long put: 13,500 × 100 × −0.0761 = −102,735 shares equivalent
- Total package delta: −500,850 shares — a modest net-short lean on the option package alone, which is exactly what you'd expect from a collar hedging a much bigger long-stock position (the stock's own +1,350,000 delta would swamp this and leave the combined position solidly net long, just capped).
Either way, here's the real takeaway: whoever put this on is willing to give up everything above $125 through June 2027 — and got paid to do it. That's a statement that they don't expect PDD to blow past $125 by mid-2027, or that they're perfectly happy exiting there. This is a ceiling being set, not a bullish bet.
✅ RESOLVED — Next-Day OI Is In (August 4, 2026 pre-market)
The OPRA open-interest snapshot timestamped August 4, 2026 ≈06:30 ET reflects the close of business August 3 — the definitive open-vs-close test we flagged when this published. Here is what it says.
| Leg | Baseline OI (Aug-3 snap) | Resolving OI (Aug-4 snap) | Δ | Print size | Δ as % of print | Verdict |
|---|---|---|---|---|---|---|
| Jun-17-2027 $125 call (sold) | 943 | 14,352 | +13,409 | 13,500 | ≈99.3% | ✅ OPEN (STO) |
| Jun-17-2027 $55 put (bought) | 1,322 | 14,701 | +13,379 | 13,500 | ≈99.1% | ✅ OPEN (BTO) |
Verdict: a genuinely new credit collar, opened in full. Both strikes were near-empty before this trade (943 and 1,322 contracts) and both now carry roughly 14,000–15,000 — an increase of ≈99% of what printed. STO on the call, BTO on the put, both confirmed. Nothing was rolled or closed. The desk now carries a live obligation to deliver PDD at $125 through June 2027, financed by the put it bought, and it was paid $4.46M up front to take that on — exactly the structure published August 3.
📈 Technical Setup / Chart Check-Up
YTD Chart
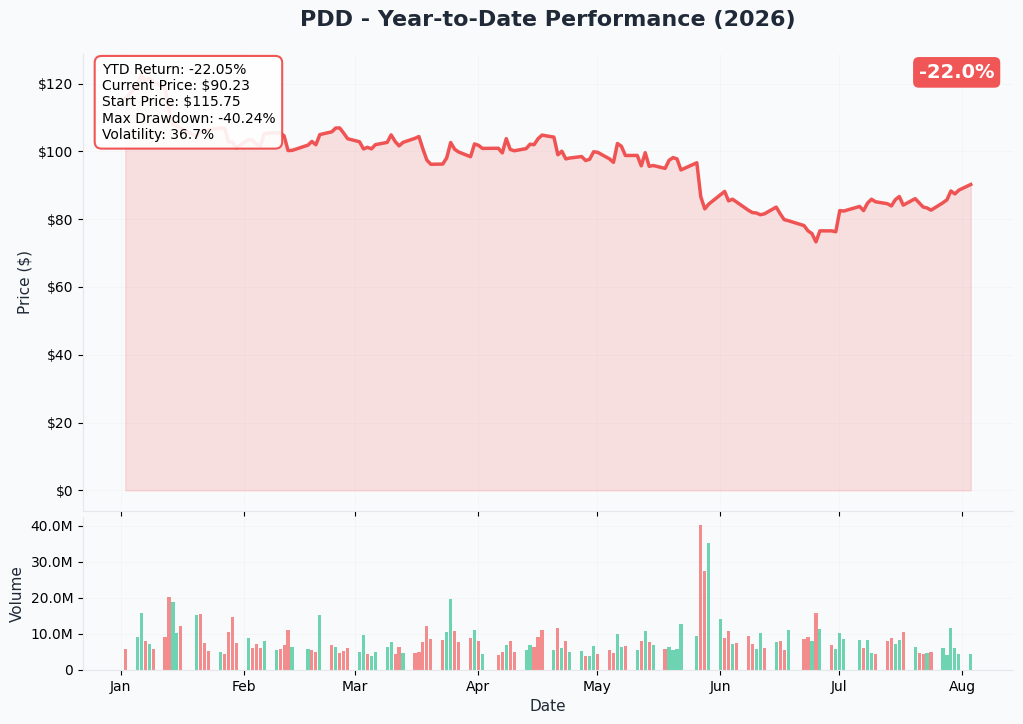
PDD is down −22.05% year-to-date in 2026 — from a $115.75 start to today's $90.23 — with a −40.24% max drawdown at the June low near $73–76, and realized volatility running 36.7%. The stock has clawed back from that low but is still well below where it started the year. This is the depressed price level the collar is anchored against.
Gamma-Based Support & Resistance
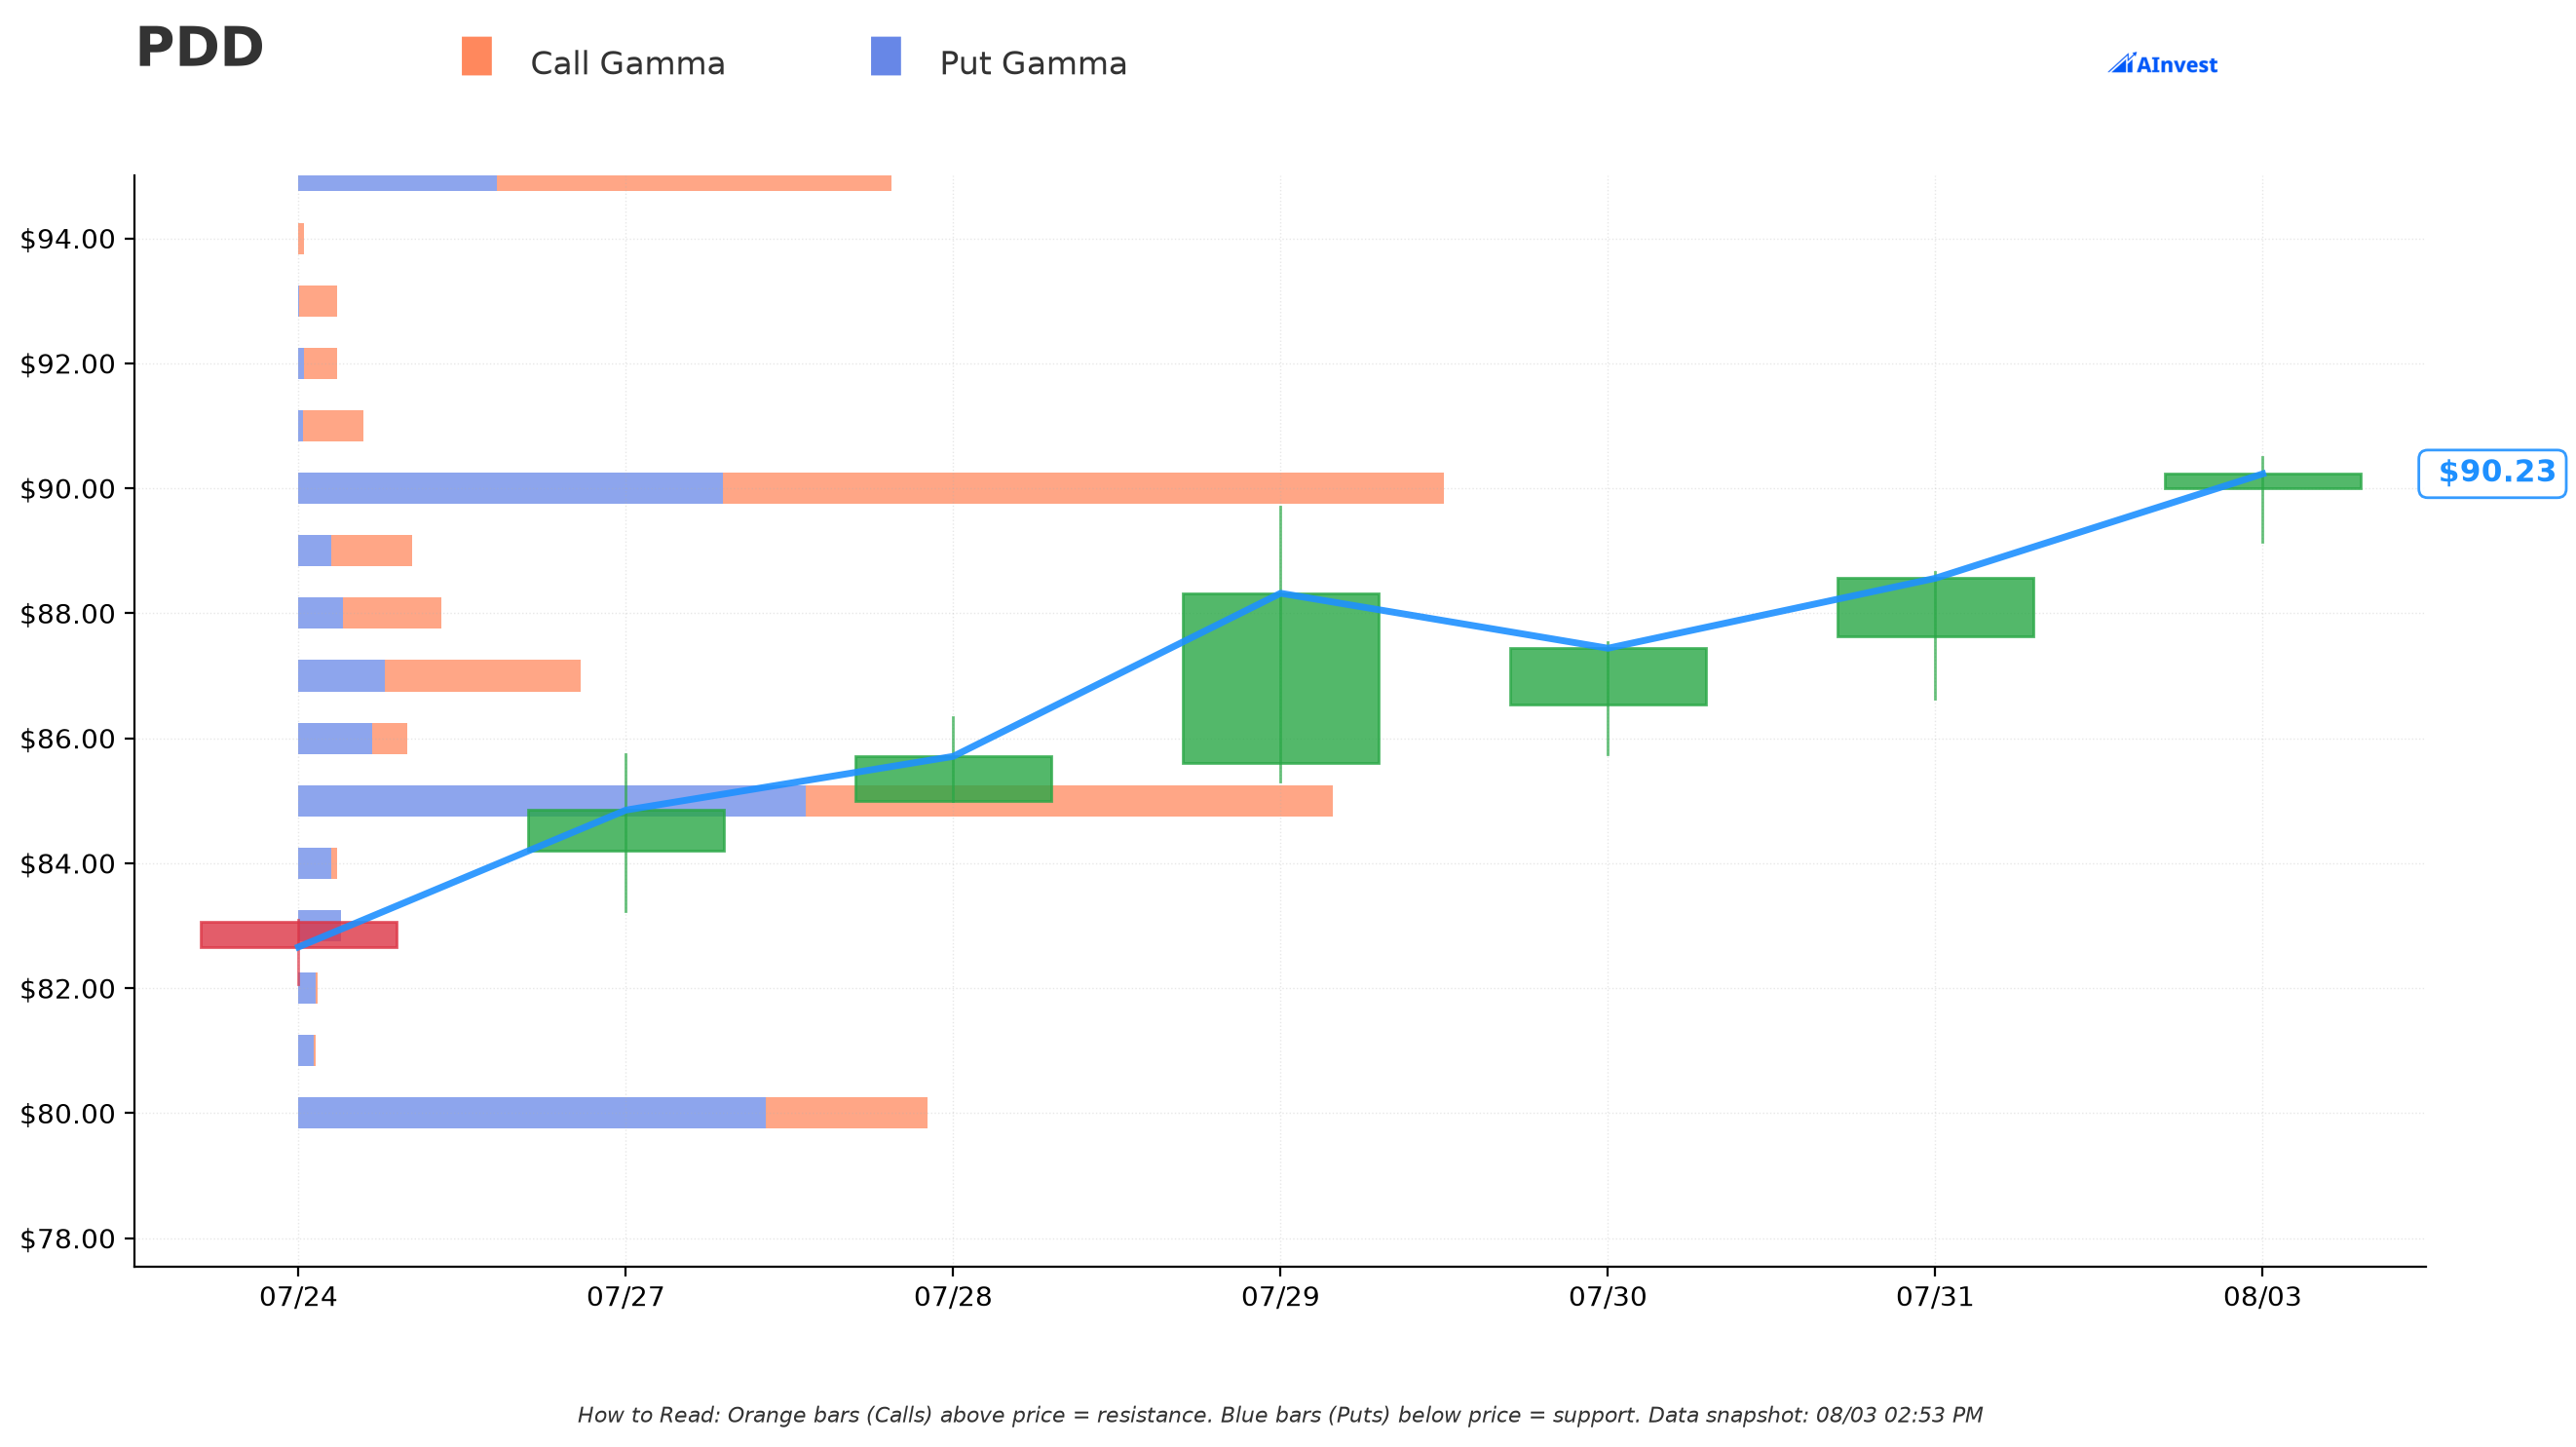
Blue bars (put gamma) below price = support. Orange bars (call gamma) above price = resistance. Reading the actual gex.json levels for 2026-08-03:
- 🔵 Support: $90 strike — "Very Strong," essentially right where spot sits (0.3% below).
- 🔵 Support: $85 strike — "Very Strong," 5.8% below spot.
- 🔵 Support: $80 strike — 11.3% below spot.
- 🟠 Resistance: $95 strike — "Very Strong," 5.3% above spot.
- 🟠 Resistance: $100 strike — 10.8% above spot.
- 🟠 Resistance: $105 strike — 16.4% above spot.
Translation: PDD is currently pinned right at a heavy gamma zone ($90), with dealer hedging flows likely to lean supportive down to $85 and cap rallies in the $95–$100 area near-term. These are short-dated dealer-positioning levels, not the same time horizon as the June 2027 collar — they'll shift daily as options expire and roll — but they're useful for gauging where the stock wants to sit into the next couple of weeks.
Implied Move
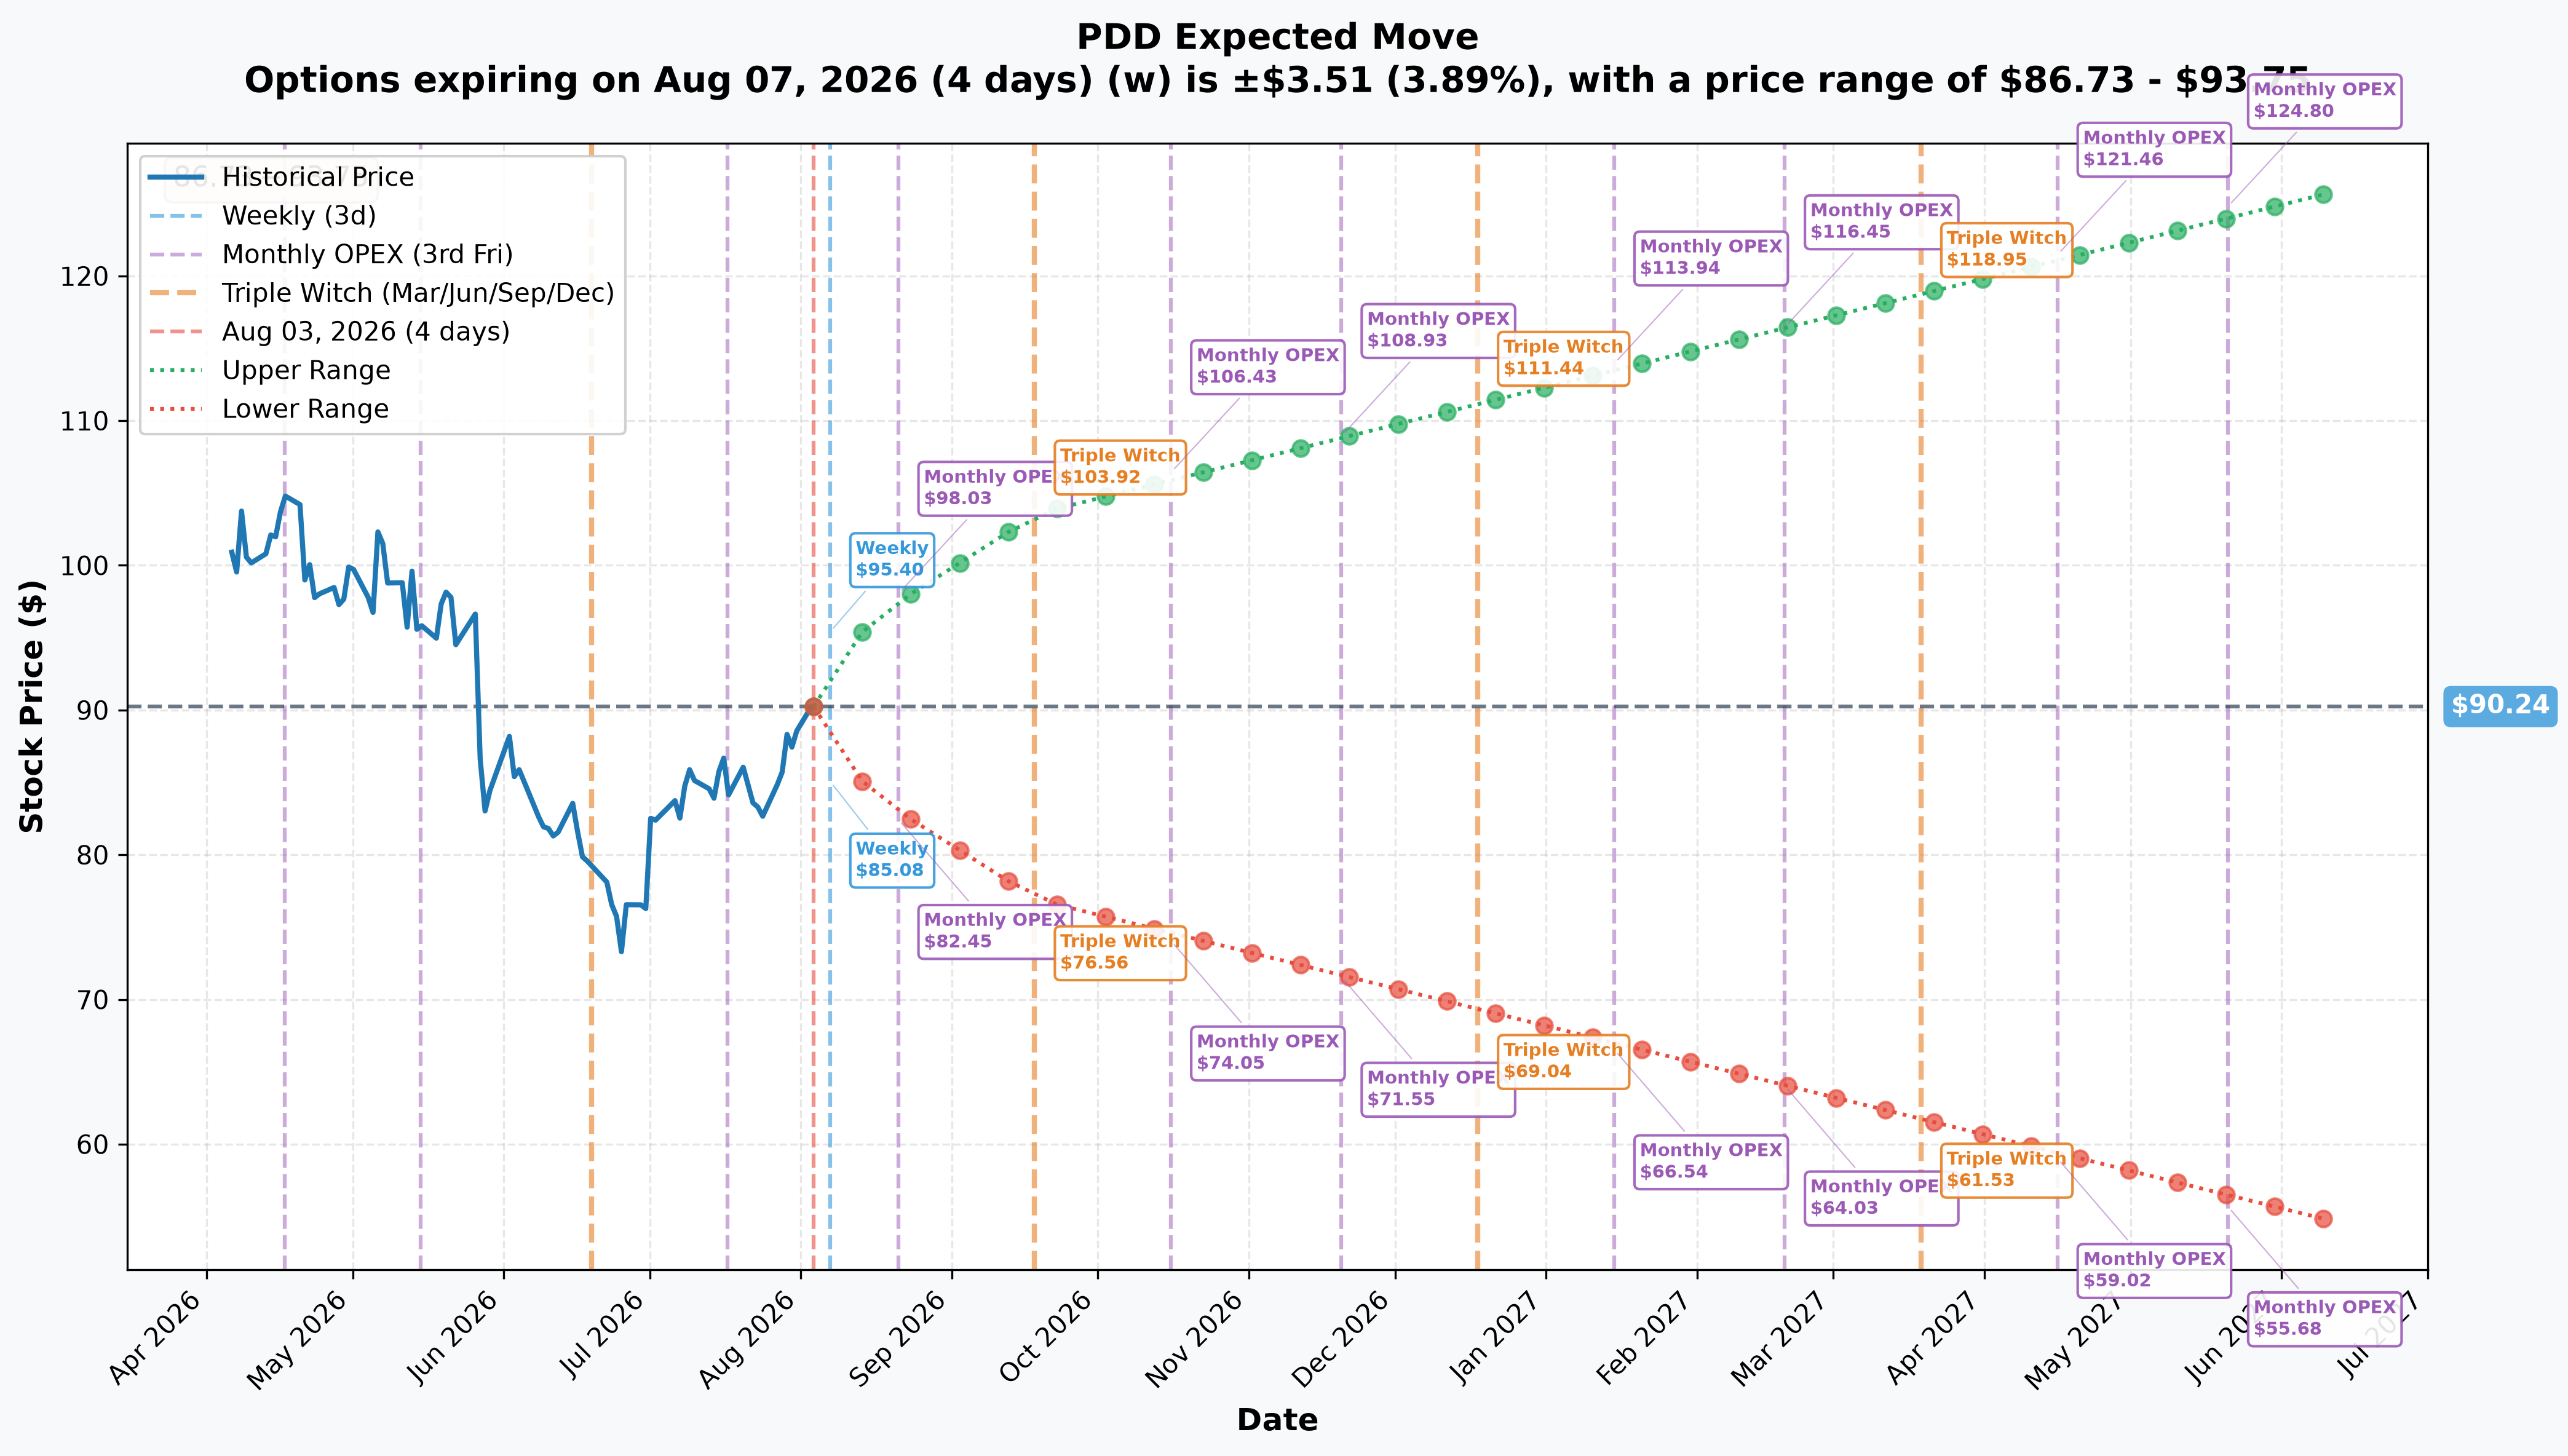
Straight from the option chain's own pricing (PDD_implied_move.json, 2026-08-03 snapshot, spot $90.24):
| Expiry | DTE | Implied Move | Range |
|---|---|---|---|
| Weekly (2026-08-07) | 4 | ±3.89% (±$3.51) | $86.73 – $93.75 |
| Monthly OPEX (2026-08-21) | 18 | ±8.16% (±$7.36) | $82.88 – $97.60 |
| Triple Witch (2026-09-18) | 46 | ±14.8% (±$13.35) | $76.89 – $103.59 |
| Yearly LEAPS (2027-06-17) | 318 | ±39.96% (±$36.06) | $54.18 – $126.30 |
🧠 The number that jumps out: the collar's own strikes — $55 put / $125 call — sit almost exactly on the boundaries of the option market's own priced-in one-year range of $54.18 to $126.30. Whoever built this collar effectively fenced in the stock at close to what the options market itself is already pricing as the plausible one-year extremes. That's a data point suggesting the strikes weren't picked arbitrarily — they line up with where the market's own volatility pricing says PDD could realistically land.
🎪 Catalysts
📆 Upcoming (next 6 months)
- 🥇 Q2 2026 earnings — estimated Monday, 2026-08-24, before market open. ⚠️ Not company-confirmed — stockanalysis.com's statistics page lists this as the estimated date; the IR press-release confirmation could not be retrieved. This is ≈3 weeks out and is the dominant near-term catalyst. Watch whether Q1's operating-profit growth (+22%) holds and whether net income (−15% in Q1) stabilizes.
- EU enforcement outcome on the Dublin non-cooperation charge — timing unknown, follows the 2026-07-31 charge against Temu.
- EU low-value-import fees continuing to bite Temu's cost structure — confirmed in force, magnitude not yet quantified.
- China's proposed broader e-commerce law progressing toward enactment — proposed 2026-07-04.
- Shein's up-to-$3B Hong Kong IPO, targeted "by August" 2026 — Investing.com — creates a fresh public comparable for cross-border China e-commerce.
- Q3 2026 earnings, expected ≈November 2026 (inferred from the 2025-11-18 prior-year print, not yet published).
- Singles' Day (11.11) and Q4 domestic season, ≈November 2026 — matters because June's 618 shopping festival already disappointed.
The June 2027 collar spans roughly four more earnings reports (Aug 2026, ≈Nov 2026, ≈Mar 2027, ≈May 2027) between now and expiration.
📜 Already Happened (last 3 months)
- 2026-05-27 — Q1 2026 earnings: revenue RMB 106.2B (+11%), operating profit +22%, but net income −15% — stock fell −10.38% the same day (StockTitan).
- 2026-05-27/28 — Downgrade cascade: Barclays cut its target $165 → $89 (a 46% reduction) and downgraded to Equal Weight; Nomura went Strong Buy → Hold; Benchmark cut $160 → $127; Citigroup cut $142 → $123 (MarketBeat).
- 2026-06-15 — BNP Paribas Exane initiated Underperform, $89 target — a fresh, unanchored look landing below the current price (MarketBeat).
- 2026-06-18 — China's 618 mid-year shopping festival showed weak demand (Investing.com).
- 2026-06-23 — Daiwa downgraded to Hold, $80 target, explicitly citing the 618 festival as a "negative surprise" (stockanalysis.com).
- 2026-07-04 — China proposed a broader e-commerce law covering platforms and digital businesses (Investing.com).
- 2026-07-13/16 — Shein's HK IPO valuation reportedly cut as the e-commerce crackdown "starts to bite" (Investing.com).
- 2026-07-27 — Zacks downgraded PDD to Strong Sell (MarketBeat).
- 2026-07-31 — the EU charged Temu over lack of cooperation in a Dublin regulatory raid, days before this trade printed (Investing.com).
📊 The base rate that matters most for August 24: PDD has fallen on 3 of its last 4 earnings reactions — −10.38%, −7.33%, and −13.64% — with only the Q4 2025 print producing a gain (+4.61%) (StockTitan).
🎯 Analyst Targets — a Notably Wide Split
MarketBeat's 16-analyst panel: Hold consensus, average target $124.64 (7 Buy / 7 Hold / 2 Sell), range $80–$170. stockanalysis.com's 37-analyst panel: Buy consensus, average $116.10. The three most recently updated individual targets — Daiwa $80, BNP Paribas $89, Barclays $89 — all sit at or below today's $90.24 spot. Worth noting: the $124.64 MarketBeat consensus average lands almost exactly at the collar's $125 call strike — the seller isn't demanding a premium above where the Street's stale bullish models already sit; they're capping out roughly where consensus already expects PDD to be.
🎲 Price Targets & Probabilities
Putting the gamma levels, implied move, and catalyst calendar together:
- Base case (through the Aug 21 monthly OPEX, which straddles the estimated Aug 24 earnings): the option chain prices an $82.88–$97.60 range. Gamma dealer flows currently favor pinning near $90, with a supportive shelf at $85.
- Bull case: a clean beat that resolves the "growth bought vs. earned" concern (operating profit staying positive, net income stabilizing) could push PDD toward the $95–$100 gamma resistance zone, and the 46-day triple-witch implied range extends to $103.59.
- Bear case: given the hostile 3-of-4 earnings base rate, a repeat of a −10%-plus reaction would take PDD toward or through the $80 gamma support shelf, well inside the 46-day implied-move floor of $76.89.
- Far case (through the collar's June 2027 expiry): the option market's own one-year pricing brackets PDD between $54.18 and $126.30 — which, again, is almost exactly where this trade's put and call strikes sit.
These are ranges implied by option pricing and dealer positioning, not guarantees — treat them as a map of where the market currently thinks probability mass sits, not a forecast.
💡 Trading Ideas
None of these attempt to replicate the actual collar — doing so would require owning roughly 1.35 million PDD shares and carrying significant margin. These are ways a retail-sized account could react to the same information using defined risk.
🛡️ Conservative — "Sleep Well Into Earnings"
If you already own PDD stock and the −10%-on-3-of-4-earnings base rate worries you, consider a shorter-dated protective put (e.g., an Aug 21 or Sep 18 expiry, strike near the $80 gamma support) rather than committing to a June 2027 horizon. It costs real premium and caps nothing on the upside — it's insurance, not income.
⚖️ Balanced — "Defined-Risk Range Play"
A call credit spread in the $100/$105 area (short the $100, long the $105, both defined-risk, capturing the resistance zone) or a put credit spread in the $80/$75 area expresses a view that PDD stays inside its gamma-defined range into the Aug 24 print — without the unlimited risk of a naked short option. Size small; earnings volatility can blow through gamma levels.
🚀 Aggressive — "Playing the Binary"
Given the historical −10%+ earnings-day base rate, a long straddle or strangle around the Aug 21 monthly expiry (which captures the estimated Aug 24 report) is the most direct way to express "this is a volatility event, not a valuation call." Expensive — you're paying up for known event risk — and it needs a move bigger than what's already priced (±8.16% / ±$7.36) to profit. Confirm the earnings date with PDD investor relations before committing capital to an expiry chosen around it.
👥 How Four Different Readers Should Think About This
🎰 YOLO Trader: This isn't your trade to copy — a 13,500-lot short call is not something a retail account can replicate (the margin alone would wipe out most accounts, and if it's genuinely naked, the risk is uncapped). What you can take from it: someone with real size doesn't think PDD is racing past $125 by mid-2027. If you want convex upside, look at defined-risk call spreads around the Aug 24 earnings date instead of chasing this print.
📈 Swing Trader: The actionable part is the gamma map, not the collar. $90 is a magnet right now, $85 is the next shelf down, $95–$100 caps rallies near-term. Watch how price behaves into the Aug 7 weekly and Aug 21 monthly OPEX (which straddles the estimated earnings date) for tactical entries.
💰 Premium Collector: This trade is a premium-collection structure at institutional scale — they got paid $4.46M to define their own risk. The retail-sized lesson: defined-risk credit spreads around the gamma resistance/support levels above can express a similar "get paid for capping upside/downside" idea without the unlimited-risk version of it.
🌱 Beginner: A "collar" is simple once you see it: sell a call above the market to collect cash, use some of that cash to buy a put below the market as insurance. Here, the call brought in more than the put cost, so the trader got paid to have this stock protected on the downside — but also gave up any gain past $125. It's a trade for someone who already owns a lot of stock and wants to lock in a range, not someone betting the stock goes up or down from here. The next-day open-interest check (see the ⏳ box above) is how we confirm these were genuinely brand-new positions.
⚠️ Honest Risk Factors & What the Tape Cannot Prove
Being straight about the limits of what OPRA data can tell us:
- We cannot see any stock behind this. A multi-leg options cross carries no equity leg on the option tape — unlike a stock+options combo trade, there's nothing here that would show us a paired stock block. If this trader owns 1.35 million PDD shares, that ownership is completely invisible to us.
- We cannot confirm hedge vs. standalone bet. The covered-collar read is the more likely one for a negotiated block this size, but it is inferred, not proven. The standalone alternative — a large naked short call position — is real, carries theoretically unlimited risk above $125, and would require substantial margin to hold. We genuinely don't know which one this is.
- We cannot identify the trader. No broker, MMID, customer identity, or order ID is visible from the tape. We don't know if this is one account or a facilitated combination of several.
- We cannot see pre-existing positions. If this trader already had short calls or long puts at these strikes from before, our open/close read (based on size vastly exceeding prior OI) would still call it an open — the size comfortably supports that — but it doesn't tell us anything about other positions they may be running elsewhere in the chain.
- Open interest confirmation is still pending. As of this writing, tomorrow's OI snapshot hasn't landed yet. The size-vs-prior-OI math strongly supports a fresh open on both legs, but treat it as confirmed only once the next-day numbers are in (see the ⏳ box above).
- The Aug 24, 2026 earnings date is estimated, not company-confirmed. Don't build a position around that specific date without verifying it against PDD investor relations.
🎯 The Bottom Line
Real talk: somebody put on a $121.7M-notional collar on PDD stock, agreeing to give up everything above $125 through June 2027 in exchange for a floor at $55 — and got paid $4.46M to do it. That is a ceiling being set, not a bullish bet, and it lines up almost exactly with where the option market's own one-year pricing ($54.18–$126.30) and the Street's stale bullish consensus target ($124.64) already sit.
If you own PDD: this is a reasonable template for how a large holder is thinking about risk into a stock that's down 22% YTD, facing a hostile earnings base rate (3 of the last 4 reports down double digits) and live EU regulatory pressure on Temu. Consider whether your own position needs similar protection into the estimated August 24 print.
If you're watching from the sidelines: the near-term story is the Aug 24 earnings date — mark your calendar, but confirm it with PDD IR first. The gamma map ($85 support, $90 pin, $95–$100 resistance) is your guide for the next three weeks; the collar's $55/$125 strikes are the map for the next ten and a half months.
Come back tomorrow for the OI confirmation — we predict both legs land close to fully open (≈14,400 on the call, ≈14,800 on the put), and we'll update this article the moment that data lands.
This analysis is for informational purposes only and is not investment advice. Options trading involves substantial risk, including the potential for rapid and total loss of premium paid, and — for short/naked option positions — theoretically unlimited loss. Margin requirements for short options can be substantial and vary by broker. Past earnings reactions do not guarantee future results. Verify all catalyst dates independently before trading around them. Consult a licensed financial advisor before making any trading decisions.
Last updated: August 4, 2026 — next-day OPRA open-interest resolution added (✅ RESOLVED box above). Original analysis published August 3, 2026.