🚫 QGEN: Those $2M of Calls Sold Near the Bid Closed an Existing Long — Open Interest Fell 18,250, and No New Short Was Opened
📅 August 11, 2026 | Correction notice: the trade we first flagged on QIAGEN was cancelled
🔄 Updated 2026-08-12 pre-market — the next-day OPRA open interest resolved both prints, and they inverted. Open interest on the August $45 call fell 45,759 → 27,509 (−18,250) — 91% of the 20,000 contracts sold. We published three branches and said a fall would mean "an existing long call position was closed — profit-taking or a stop-out on calls bought earlier, not a new bearish bet." That is what happened. The provisional STO labels are retired: no new short-call position was opened, and the ≈$2.0M was realised on the way out of a long, not collected for taking on new risk. See the ✅ RESOLVED box.
This is not a bullish call-buying story. The print that first caught our screen — a 10,000-lot QIAGEN $45 call trading at $1.30 — never stood. The tape shows it was cancelled less than an hour later. What survives instead is two 10,000-lot blocks that both crossed at $1.00, near the bid, not the ask — a $2.0 million print that reads like selling, not buying. We're walking through exactly what happened, because it's a useful lesson in why a flow screen can show you a trade that isn't real.
1. Company overview
QIAGEN N.V. (NYSE: QGEN, also listed as XETRA: QIA) is a "sample to insight" molecular-diagnostics company: it sells the consumables, instruments and software that turn a biological sample into a molecular answer. The company serves more than 500,000 customers worldwide across academic, pharmaceutical and industrial (forensics) life sciences. Its platforms include QIAstat-Dx (syndromic PCR panels, 5,200+ instruments installed), QIAcuity (digital PCR, 3,200+ placements), NeuMoDx (automated clinical PCR) and QuantiFERON (latent-TB blood testing).
QIAGEN is classified under Healthcare / Diagnostics & Research, is domiciled in the Netherlands and headquartered in Venlo, employs ≈5,700 people, and has traded on the NYSE since its 1996 IPO. Market cap is ≈$8.8 billion on ≈206.8 million shares outstanding, with a beta of 0.62 — a structurally low-volatility name. The stock closed $42.90 on August 11, 2026, down 2.17% on the day, after touching a three-month high of $43.85 the session before.
2. The trade — and why the headline number is wrong
The tape for QIAGEN's August 21 $45 call shows four 10,000-lot prints today, all crossed off the lit book (a broker matching a known buyer against a known seller — not a sweep lifting the offer):
| Time (ET) | Size | Price | Outcome |
|---|---|---|---|
| 10:23:30 | 10,000 | $1.00 | Block cross — stands, printed 13% across the quote (near the bid) |
| 10:33:24 | 10,000 | $1.30 | Block cross — this is the print we originally captured |
| 10:36:40 | 10,000 | $1.00 | Block cross — stands, printed 0% across the quote (right at the bid) |
| 11:14:34 | 10,000 | $1.30 | Cancellation — matches the 10:33:24 print on both size and price |
The 11:14:34 cancellation is a same-size, same-price match against the 10:33:24 trade. On the tape, that voids it — the $1.30 print, the one that looked like a bullish call purchase and the one worth $1.3 million on its own, never happened as a completed trade. Anyone who captured the flow before 11:14 ET would have recorded a print that no longer exists on the record.
What actually survives is the two $1.00 prints — 20,000 contracts, ≈$2.0 million total — both landing at or near the bid, not the ask. These are negotiated crosses, so the where-it-printed signal is a weak one (there's no lit order book being lifted or hit), but printing at the bid rather than the ask is more consistent with a seller getting done than a buyer paying up. We're not asserting this as proof — just noting that the honest reading of the surviving flow tilts toward calls being sold, not bought.
Full trade details — the two prints that stand
| Time | Buy/Sell | Call/Put | Expiration | Premium | Strike | Volume | OI | Size | Spot | Option Price | Option Symbol | Order Type | Strategy |
|---|---|---|---|---|---|---|---|---|---|---|---|---|---|
| 10:23:30 | SELL | CALL | 2026-08-21 | $1,000,000 | $45 | 20,000 | 45,759 | 10,000 | $43.00 | $1.00 | QGEN20260821C45 | 🔄 STC — resolved 2026-08-12 (OI fell 45,759 → 27,509); was STO ⏳ | Long call exit (2 crosses) — no new short opened |
| 10:36:40 | SELL | CALL | 2026-08-21 | $1,000,000 | $45 | 20,000 | 45,759 | 10,000 | $43.29 | $1.00 | QGEN20260821C45 | 🔄 STC — resolved 2026-08-12 (OI fell 45,759 → 27,509); was STO ⏳ | Long call exit (2 crosses) — no new short opened |
Tagged 🤝 BLOCK CROSS — a broker matched a known buyer and seller off the open order book. This is negotiated position management, not aggressive sweeping, and it comes with a known counterparty on the other side.
✅ RESOLVED — A Long Was Closed, Not a Short Opened
Updated 2026-08-12 pre-market. Resolving OPRA snapshot timestamped August 12 (reflects the August 11 close, after this print); baseline is the August 11 snapshot (reflects the August 10 close, before this print).
| Leg | Baseline (Aug-11) | Resolving (Aug-12) | Δ | Print size | What we published | Verdict |
|---|---|---|---|---|---|---|
| Aug-21 $45 call (both crosses, sold) | 45,759 | 27,509 | −18,250 | 20,000 | "if OI falls: an existing long call position was closed … not a new bearish bet" | 🔄 CLOSE (STC) — was STO ⏳ |
This is the cleanest inversion on the August 11 board. Open interest retired 18,250 contracts against 20,000 sold — 91% of the print extinguished, with only ≈1,750 transferring. There is no ambiguity left: both crosses closed an existing long call position.
Control check. The neighbouring August strikes were flat across the same window — $40 call 45,759-adjacent line 22,566 → 22,563 (−3), $50 call 1,795 → 1,802 (+7). The decline is entirely at the traded strike.
What changes below. Two things:
- The "short near-dated OTM call" label is withdrawn. No new short exists. The ≈$2.0 million was not premium collected for taking on upside risk between now and August 21 — it was the proceeds of liquidating calls bought earlier. Whether that was a profit-take or a stop-out we cannot tell from the tape; the strike sat at $45 against a $43.00–$43.29 spot, so these were out-of-the-money longs being cashed with ten days left.
- The bearish reading is gone, and so is the bullish one. A closing sale says the holder is finished, not that they are now negative on QIAGEN. The honest conclusion is that a large long call position at the $45 strike was retired ahead of expiration, and the remaining 27,509 contracts of open interest belong to someone else.
The two things this article got right and should keep. The correction that opened this piece — the flow screen's 40-contract open-interest field was wrong by three orders of magnitude against a real 45,759 — is what made this resolution readable at all. And the published caution ("our best guess leans toward new short calls being opened or an existing long being closed … we are not going to state either as fact") correctly refused to assert the branch that turned out to be wrong.
🤓 What This Actually Means — Plain English
First, what a cancellation actually is. A cancel print on the options tape matches an earlier trade's size and price and effectively erases it from the day's record — it's the tape's way of saying "that trade didn't happen after all" (a busted print, a correction, or an error being unwound). It happens far less often than a normal trade, but when it does, any flow-scanning tool — ours included — that grabbed the print before the cancel landed will show a trade that never actually settled. That's exactly what happened here: the $1.30 print looked, for about 40 minutes, like a straightforward bullish call purchase. It wasn't real. This is the whole reason we're leading with a correction instead of a trade idea.
Second, what's left after the correction. Two 10,000-lot blocks crossed at $1.00 each, both at or near the bid. Selling near-dated, out-of-the-money calls at the bid — rather than paying up at the ask — is the footprint of a seller getting filled, not a buyer chasing. There are two very different stories that fit this footprint equally well right now: (1) someone opened a fresh short call, betting QGEN stays below $45 through August 21 and pocketing the ≈$1.00 premium per contract; or (2) someone who already owned these calls (perhaps from the run into the August 10 FDA clearance) sold them to lock in a gain or cut a loss. Selling calls is not automatically bearish — it can just as easily be a long-holder taking profits off a position that already worked. The size-versus-OI math genuinely can't separate these two stories today, which is why we're not calling this bearish, bullish, or anything else with confidence.
Third, the strike itself. $45 sits ≈4.6-4.7% above the current spot (≈$42.90–43.29 across the session) and above every closing price QGEN has printed since June 1 — including the August 10 FDA-clearance spike to $43.85. Whoever is on the short side of these calls is being paid to bet the stock doesn't clear a level it hasn't touched in the last three months.
4. Chart check-up
Price context
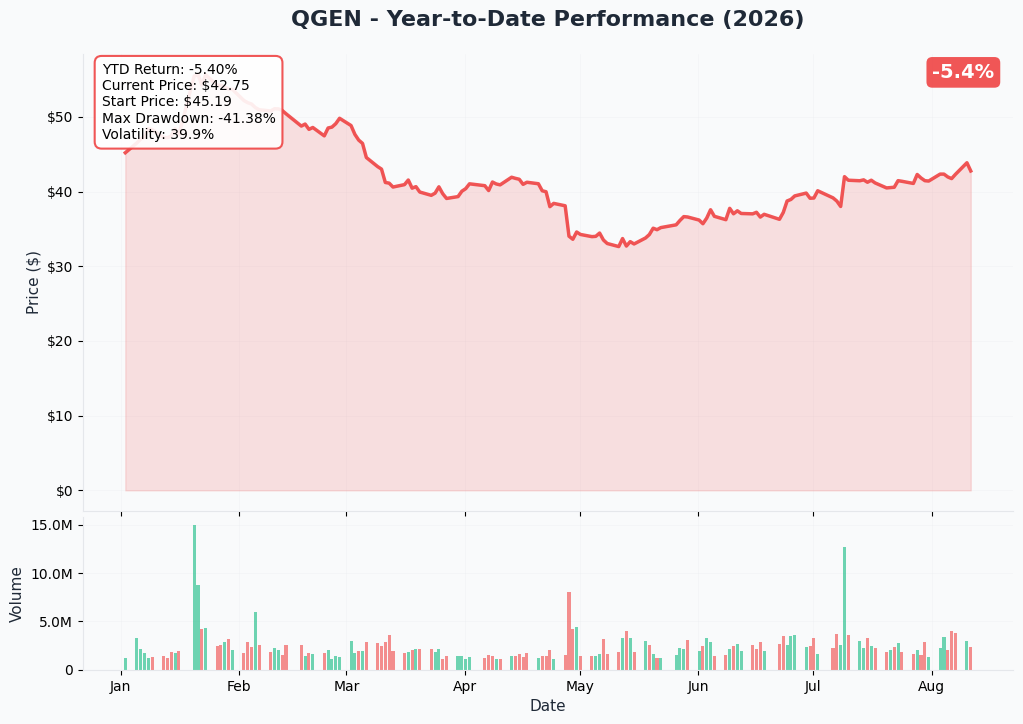
QGEN enters this trade 9.2% below where it started 2026, after a V-shaped three months: a June 8 low close of $36.23, a recovery to a three-month-high close of $43.85 on August 10 (the FDA-clearance day, +3.66%), and then a 2.17% pullback to $42.90 on August 11 — the same session this flow printed. The $45 strike has not been touched on a closing basis anywhere in that stretch.
Gamma support & resistance
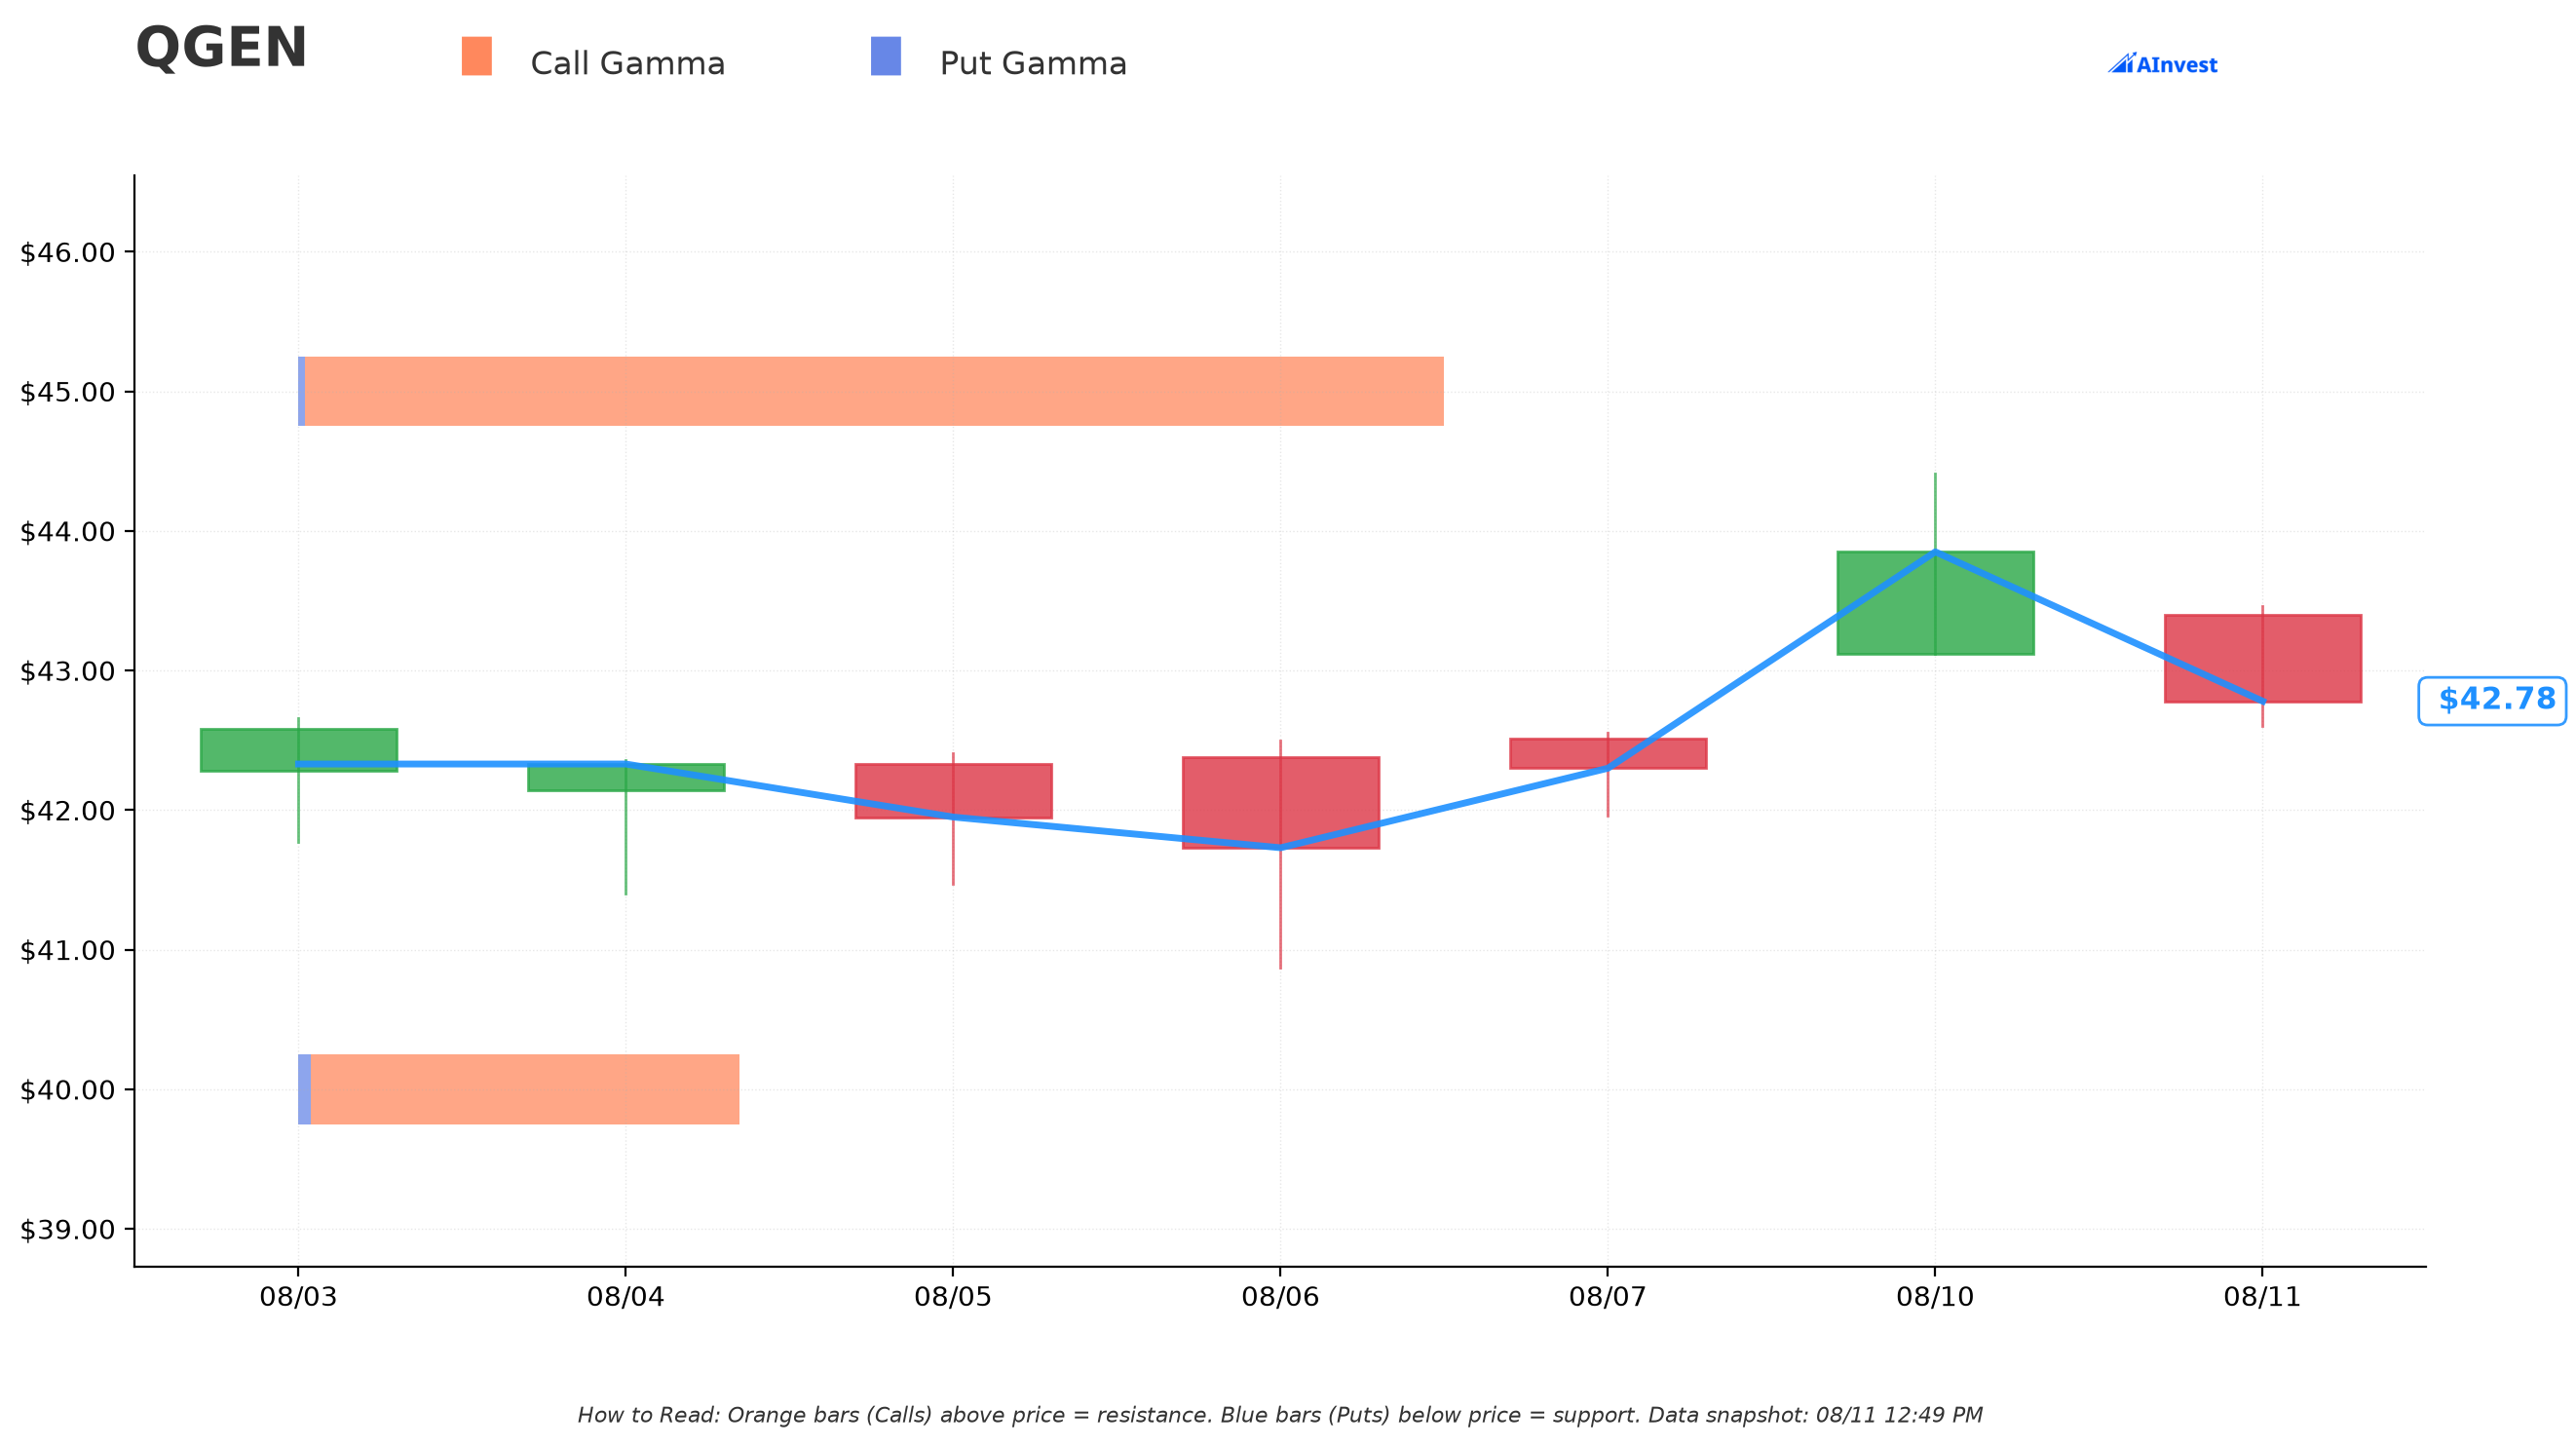
Reading the dealer-gamma map as of a ≈$42.77 reference price: the $45 strike is a Very Strong resistance wall — total gamma exposure of ≈18.09, almost entirely call-side (≈17.99 of it), sitting ≈5.2% above spot. That's the exact strike these calls were sold on, and it's the single heaviest gamma level on the board — consistent with a lot of open call interest already stacked there (which lines up with the 45,759 prior OI). On the downside, $40 is a Strong support wall (total gamma ≈6.97, ≈6.5% below spot). Remember: these levels are inferred from open interest and a standard dealer-positioning assumption, not directly observed — they describe where hedging flows are likely concentrated, not a guarantee of where price stops.
Implied move
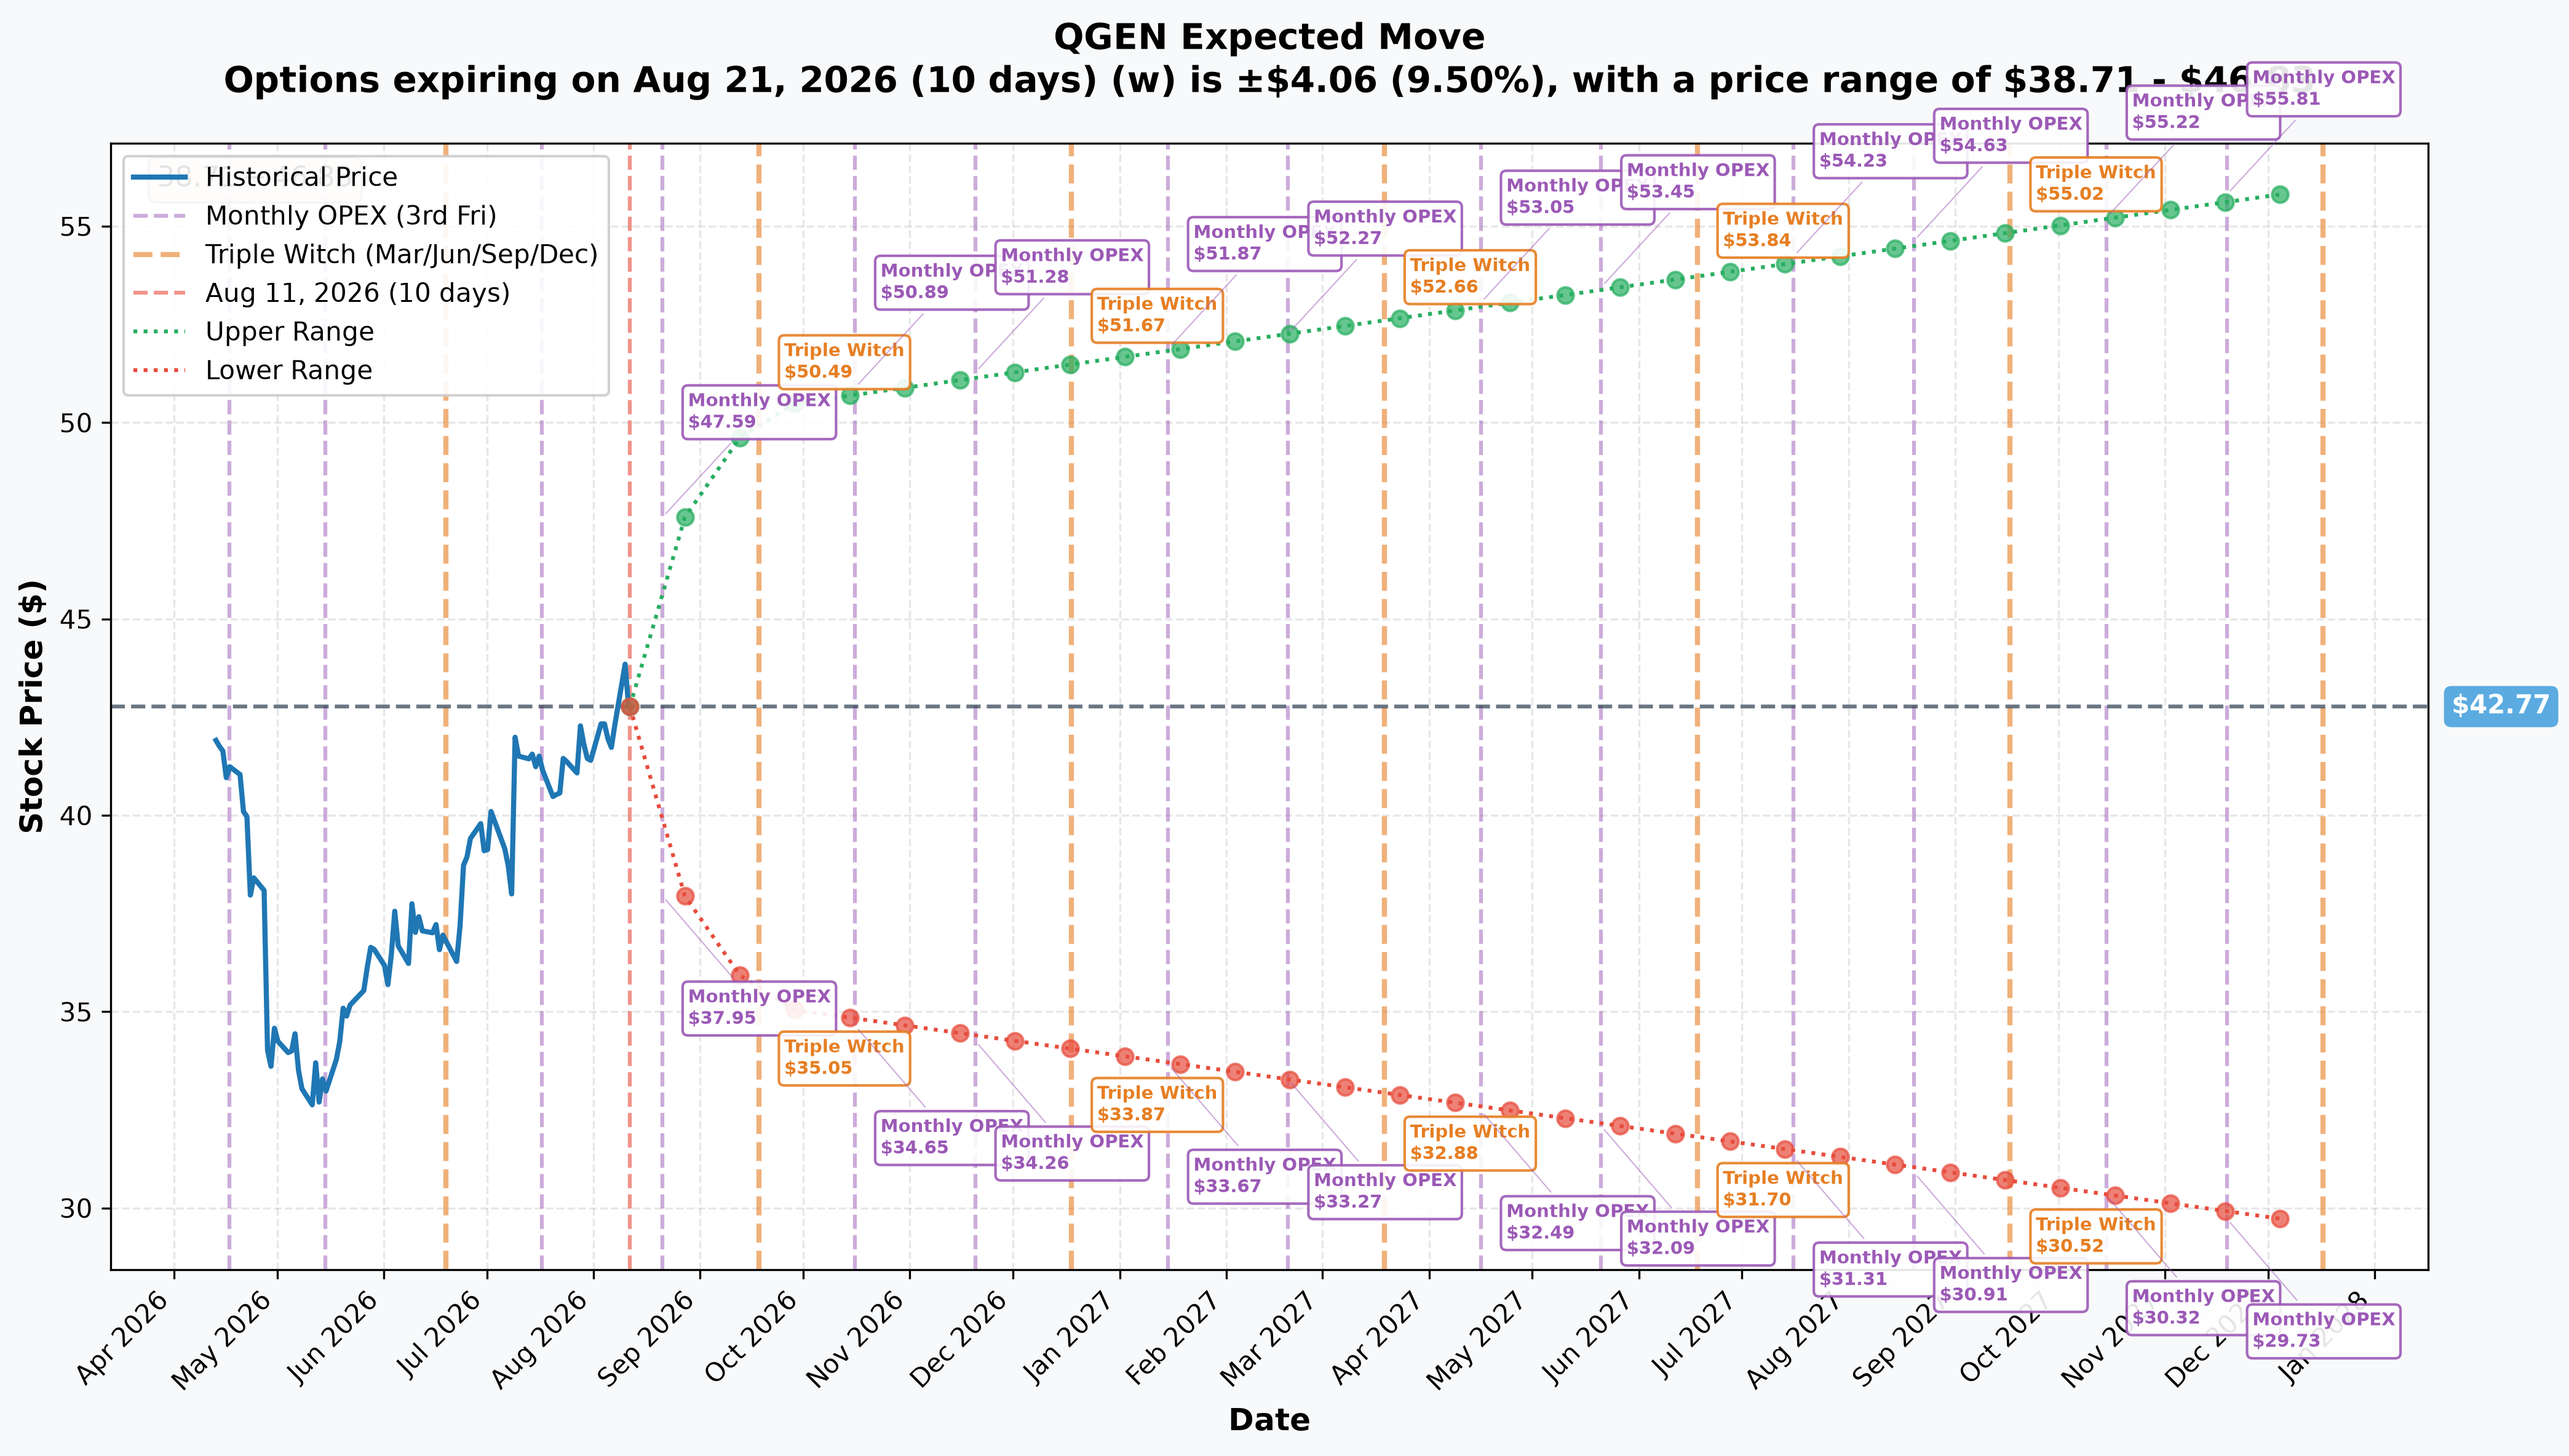
Into the August 21, 2026 monthly expiration (10 days out), the options market is pricing an implied move of ≈9.5%, or ≈$4.06, putting the one-standard-deviation range at roughly $38.71 to $46.83 off a ≈$42.77 reference. The $45 strike sold today sits inside that range — a plausible move for the stock to reach by expiration, not a moonshot bet, which is part of why we can't read urgency into the trade on strike selection alone. The wider September 18 triple-witch expiration implies a ≈17.8% ($7.60) move, range $35.17–$50.37, for context on how much the market's uncertainty band widens once you look past this single expiration.
5. Catalysts
Leading with the finding that matters most: there is no scheduled QIAGEN catalyst between today and the August 21 expiration. Every dated, company-controlled event that could move this stock has already happened, and all of them landed before this trade printed:
| Event | Date | Status |
|---|---|---|
| Q2 2026 results (beat + FY guidance reaffirmed, not raised) | August 5, 2026 | Past |
| U.S. FDA clearance, QIAstat-Dx BCID GPF Plus AMR Panel (+3.66% day) | August 10, 2026 | Past |
| Dividend ex-/record date ($0.35, +40% YoY) | July 7, 2026 | Past |
| Annual General Meeting, Venlo | June 24, 2026 | Past |
Q2 net sales were $535 million, flat year over year, against guidance for a ≈2% CER decline — a modest beat — with adjusted EPS of $0.62 versus a ≥$0.60 floor (results release). But full-year guidance was reaffirmed, not raised — still ≈1–2% CER sales growth — and QuantiFERON, historically the company's most reliable growth engine, grew just 1% CER on what management called a "significant decline in U.S. immigration testing demand" (same release). The August 10 FDA clearance — QIAGEN's first U.S. bloodstream-infection panel — drove the stock's best single day of the last three months, to $43.85, before it faded 2.17% to $42.90 on August 11, the same day this flow printed.
The only live wildcard inside the 10-day window is undated: a companion QIAstat-Dx BCID GN Plus AMR Panel (gram-negative) is under active FDA review, per the same clearance release, but the company has disclosed no decision date, and 510(k)-type clearances don't come with public timelines the way PDUFA dates do. It could land any day inside this expiration — or two months after it. There is no way to handicap that.
The next dated company event, Q3 2026 results, has no announced date — QIAGEN typically issues a scheduling notice about three weeks ahead, which by that pattern would put an announcement around mid-October and the report itself in late October or November, well past this option's life (Q2 scheduling-release precedent). Analyst target hikes clustered August 7–10 — J.P. Morgan to $50, Morgan Stanley to $46, Citi to $45 while staying Neutral — but even the high end of the street ($46.07 average on one tally, $43.93 on another) sits close to, not far above, the $45 strike sold today (price-target tracker).
Expiration date (August 21) and catalyst dates are two different things — don't confuse them. The expiry falls on a day with nothing scheduled to happen at QIAGEN.
6. Four ways to read this, depending on who you are
🎯 YOLO trader
There's no scheduled catalyst here to trade around, and the flow you'd have keyed off — a $1.3M call buy — was cancelled. What survives is calls being sold near the bid on a stock that hasn't closed above the strike in three months. If you're looking for a directional lottery ticket on QGEN, this print gives you the opposite of conviction: it looks like someone got paid to bet against a move through $45, not someone paying up for one. Chasing the $45 calls higher off this flow would mean betting against the print itself.
📈 Swing trader
The setup worth watching isn't the option flow — it's the chart. QGEN is pinned between the ≈$40 gamma support and the ≈$45 gamma resistance/strike, inside a ≈$38.71–$46.83 implied-move band into August 21. With no scheduled catalyst, a range-bound approach (fading strength near $45, watching for support near $40) is more defensible than reading directional intent into a cancelled-then-corrected cross.
💰 Premium collector
This is the closest thing to your playbook already in motion, if the "opened fresh" branch of the OI check confirms tomorrow: someone sold ≈4.6% OTM calls with 10 days left for ≈$1.00, collecting time decay on a low-beta (0.62) name with an empty catalyst calendar between now and expiration — textbook premium-selling conditions. The catch is you don't yet know if this was an opening trade or someone closing out. Check tomorrow's OI before treating this as validation to sell the same strike.
🌱 Beginner
Two things to take from this one, more than any trade idea: first, flow screens can and do show trades that get cancelled minutes to hours later — always treat a big, exciting print with a "let's see if it holds" mindset rather than acting on it immediately. Second, "calls being sold" is not automatically a bearish signal — it can mean a new short position (a bet the stock stays put or falls) or simply an existing long-call holder cashing out a winner. Without knowing which, there's no clean lesson to trade on here beyond patience.
7. Honest limits — what the tape cannot prove
- We cannot prove open or close on either surviving leg today. Size (10,000) is well below prior OI (45,759) on both prints — that's the textbook case where the intraday tape is silent and only tomorrow's OI snapshot resolves it.
- We cannot see who is on either side of these crosses. OPRA data does not disclose broker/MMID or customer identity, so "institutional block" is a size-and-mechanism inference, not a named counterparty.
- We cannot know why the 10:33:24 print was cancelled. The cancellation is a tape fact; the reason behind it (a busted report, a repriced fill, an error correction) is not disclosed and we are not guessing at it.
- We cannot see any hedge. If either side of these crosses is paired with a stock or other options position elsewhere, that would change the read entirely, and nothing in the option tape alone reveals it.
- The %-across signal here is weak by design. These are negotiated block crosses, not lit executions — there's no order book being lifted or hit, so "near the bid" is a directional hint, not proof of aggressor side.
This analysis is for informational purposes only and is not investment advice. Options trading carries substantial risk, including the potential loss of the entire premium paid or, for uncovered short positions, losses beyond the initial premium collected.
Last updated: 2026-08-12 (pre-market) — the next-day OPRA open-interest snapshot resolved both crosses and they inverted. Aug-21 $45C 45,759 → 27,509 (−18,250 against 20,000 sold, 91% of the print retired): CLOSE (STC). The provisional STO labels and the "short near-dated OTM call" framing are retired — no new short position was opened, and the ≈$2.0M was realised liquidating an existing long. The title, both order-type and strategy cells and the premium-collection framing were updated; the ⏳ callout was replaced with the ✅ RESOLVED box.