🎛️ QQQ $122M Five-Leg Options Structure — Delta-Hedged Nasdaq-100 Vol Bet, NOT a Directional Call!
📅 July 30, 2026 | 🔥 Unusual Activity Detected
✅ UPDATE — July 31, 2026 pre-market: the OI check is in. All four strikes opened; the desk added risk rather than unwinding. Open interest rose on every leg, including the Sep-2026 $710 call sale (29,510 → 40,478), which confirms a genuine new short call and validates the call-calendar read. One asterisk: the Jun-2027 $600 put built only ≈41% new contracts — the rest changed hands. See the ✅ RESOLVED box for the full table.
🎯 The Quick Take
Someone just built a $122M, five-leg options structure on QQQ — and the headline $75M call buy that looks bullish at first glance is actually delta-hedged with ≈825,000 shares of short stock, which cancels out the directional bet. This is a volatility and term-structure position, not a bet that the Nasdaq-100 goes up or down, and it landed right in the middle of the biggest earnings week of the year — Apple and Amazon report tonight, one day after Microsoft (+14%) and Meta (−9%) gave the market whiplash. Translation: this is a sophisticated desk positioning for turbulence, not a whale calling a top or bottom.
📊 Company Overview
QQQ (Invesco QQQ Trust) is the flagship ETF tracking the Nasdaq-100 Index — the 100 largest non-financial companies listed on Nasdaq — and it's the most heavily traded options underlying tied to Big Tech:
- AUM: ≈$456.9 billion
- Holdings: 106 positions, with the top 10 accounting for ≈45.65% of the fund
- Top weights: Apple ≈8.26%, NVIDIA ≈7.93%, Microsoft ≈4.82%, Micron ≈4.68%, Amazon ≈4.15%
- Sector tilt: ≈85.5% technology exposure (vs ≈28.7% for the S&P 500) — QQQ is effectively a leveraged bet on six or seven mega-cap tech names
- Current price: ≈$680, about 9% below its June 2, 2026 record, up ≈10.2% YTD
That concentration is exactly why a $122M options structure on QQQ matters more than most single-stock flow — it's a read on how a sophisticated player is positioning around the entire mega-cap tech complex, not just one name.
💰 The Option Flow Breakdown
📊 What Just Happened
All five legs printed today as negotiated block crosses (known counterparty, off the lit book) — this is one coordinated institutional package, executed piece by piece between 09:47 and 10:57 ET:
| Time | Buy/Sell | Call/Put | Expiration | Premium | Strike | Volume | OI | Size | Spot | Option Price | Option Symbol |
|---|---|---|---|---|---|---|---|---|---|---|---|
| 10:54:18 | BUY | CALL | 2027-03-19 | $46M | $715 | 10,000 | 582 | 10,000 | $679.60 | $45.80 | QQQ20270319C715 |
| 10:57:07 | BUY | CALL | 2027-03-19 | $29M | $715 | 17,000 | 582 | 6,500 | $678.68 | $45.18 | QQQ20270319C715 |
| 10:26:26 | SELL | CALL | 2026-09-18 | $18M | $710 | 14,000 | 30,000 | 14,000 | $681.51 | $12.91 | QQQ20260918C710 |
| 10:08:02 | SELL | PUT | 2028-12-15 | $17M | $600 | 3,000 | 5,200 | 3,000 | $680.30 | $55.85 | QQQ20281215P600 |
| 09:47:33 | BUY | PUT | 2027-06-17 | $12M | $600 | 4,000 | 16,000 | 4,000 | $678.20 | $31.00 | QQQ20270617P600 |
🤝 Mechanism, all five legs: block cross (negotiated, known counterparty) — not aggressive lit sweeping. The two $715 call buys were also matched with two large equity blocks (≈500,000 and ≈325,000 QQQ shares, ≈825,000 shares total) printed alongside them — confirming this was delta-hedged at inception, not a naked directional bet.
✅ RESOLVED — All Four Legs Opened; One Only Partially
We flagged every leg as provisional, because three of the four had a print size smaller than the open interest already sitting there — from the tape alone we could not tell a fresh open from a partial close or roll. The July 31 pre-market OPRA snapshot resolves all of them, and every leg came back opening:
| Leg | Baseline OI (Jul 30 snap) | Resolving OI (Jul 31 snap) | Δ | Print size | Δ as % of print | Verdict |
|---|---|---|---|---|---|---|
| Mar-19-2027 $715 Call (bought) | 582 | 15,108 | +14,526 | 16,500 | ≈88% | ✅ OPEN (BTO) — mostly new |
| Sep-18-2026 $710 Call (sold) | 29,510 | 40,478 | +10,968 | 14,000 | ≈78% | ✅ OPEN (STO) — not a close |
| Dec-15-2028 $600 Put (sold) | 5,217 | 8,260 | +3,043 | 3,000 | ≈101% | ✅ OPEN (STO) — clean full open |
| Jun-17-2027 $600 Put (bought) | 15,567 | 17,218 | +1,651 | 4,000 | ≈41% | ⚠️ PARTIAL OPEN — see below |
The headline: this desk put on new risk, it didn't unwind anything. Every leg's open interest went up. The most important confirmation is the Sep-2026 $710 call sale — with 14,000 sold against ≈29,510 existing contracts, a falling OI would have meant the desk was buying back an existing short and dismantling the structure. Instead OI rose by 10,968, proving this was a genuine new short call and that the call-calendar reading in this article is correct.
The one honest asterisk — the June 2027 $600 put. Open interest rose only 1,651 against a 4,000-lot print, so roughly 41% of that leg created new contracts and ≈59% simply changed hands between existing holders. In plain terms: our desk bought 4,000 puts, but whoever sold them to it was mostly closing out their own long puts rather than opening a new short. The desk's position is real and new — it does own 4,000 more June $600 puts than it did yesterday — but this leg did not add net new open interest to the market at anything like the rate the other legs did. The two calendar legs are also slightly asymmetric in size (3,000 sold Dec-2028 vs 4,000 bought Jun-2027), so treat the "$600 put calendar" as approximate rather than a matched one-for-one structure.
No cancellations appeared on any of the four legs' tapes — the sizes reported are the sizes that executed. The overall read — a delta-hedged, multi-leg volatility and term-structure package, not a directional bull or bear bet — is confirmed and unchanged.
🤓 What This Actually Means — Plain English
Here's the part that matters most: the $75M call buy is NOT a bullish bet.
- 🛡️ The hedge is verified, not guessed. Two stock blocks — ≈500,000 shares and ≈325,000 shares of QQQ, ≈825,000 shares total — printed at the same time as the two $715 call clips. Do the math: 16,500 contracts × 100 shares × ≈0.50 delta (a roughly at-the-market delta for a call struck ≈5% out-of-the-money) ≈ 825,000 shares. That's essentially a perfect match. Whoever bought these calls also sold roughly 825,000 shares of QQQ short at the same moment.
- 🎢 Long calls + short stock = long volatility, flat direction. When you buy a call and immediately hedge away the delta by shorting the equivalent stock, you're left holding pure convexity — you profit if QQQ makes a big move in either direction (because gamma lets you re-hedge and capture the swings), and you lose slowly to time decay if QQQ just sits still. This is a volatility trade dressed up as a call purchase. Don't read "$75M in calls" as "someone thinks QQQ goes to $715."
- 📆 The calendar spreads are financing plays, not new conviction. Selling the near-term Sep-2026 $710 call against the long Mar-2027 $715 call is a call calendar — collecting $18M in premium today to help pay for the long-dated convexity, betting the near-term option decays faster than the far-dated one. Selling the Dec-2028 $600 put and buying the Jun-2027 $600 put at the same strike is a put calendar at $600 — again a term-structure trade (different expirations, same strike), not a straightforward bearish bet on QQQ falling below $600.
- 🧩 Put it together and you get a "financed volatility cone." The near-term call sale ($18M collected) and the far-dated put sale ($17M collected) partially fund the long Mar-2027 $715 calls ($75M) and the Jun-2027 $600 puts ($12M bought as protection). Net, this reads like a desk expressing a view on how much QQQ moves and when, bracketing a roughly ±6-7% range around spot, while staying largely delta-neutral on day one. That's an institutional volatility/term-structure book, not a whale calling a top or bottom.
📈 Technical Setup / Chart Check-Up
YTD Performance Chart
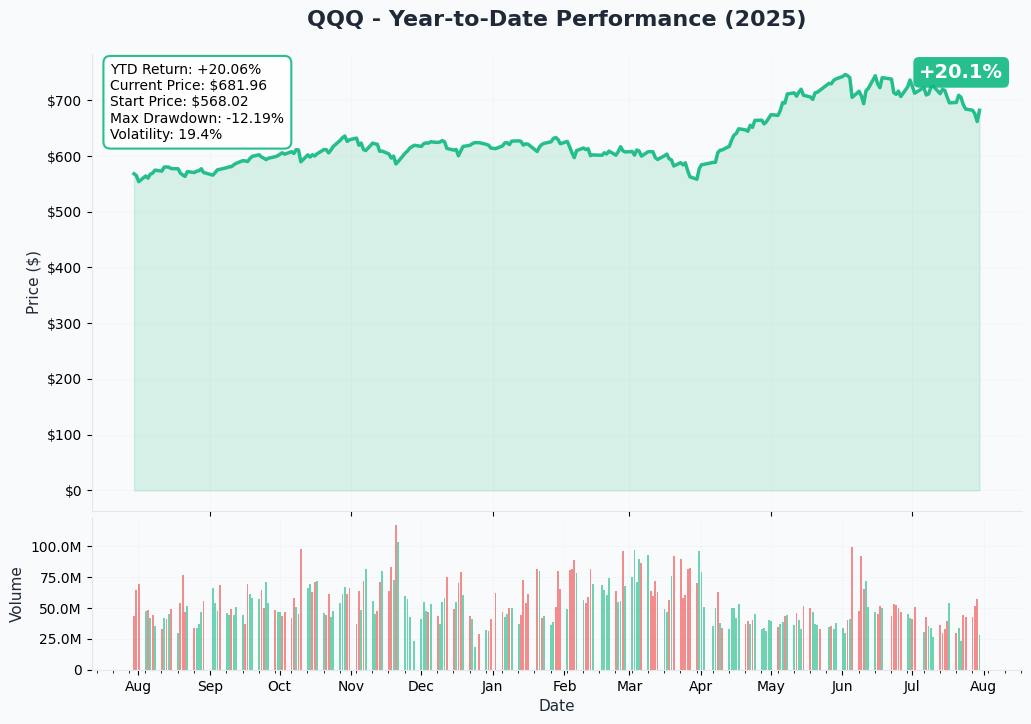
QQQ is trading near ≈$680, still ≈9% below its June 2, 2026 record high but up ≈10.2% YTD with dividends reinvested. The past two sessions have been a study in contrasts — Microsoft's post-earnings +14% pop and Meta's post-earnings −9% drop have effectively bookended the index, and Apple and Amazon report tonight after the close.
Gamma-Based Support & Resistance Analysis
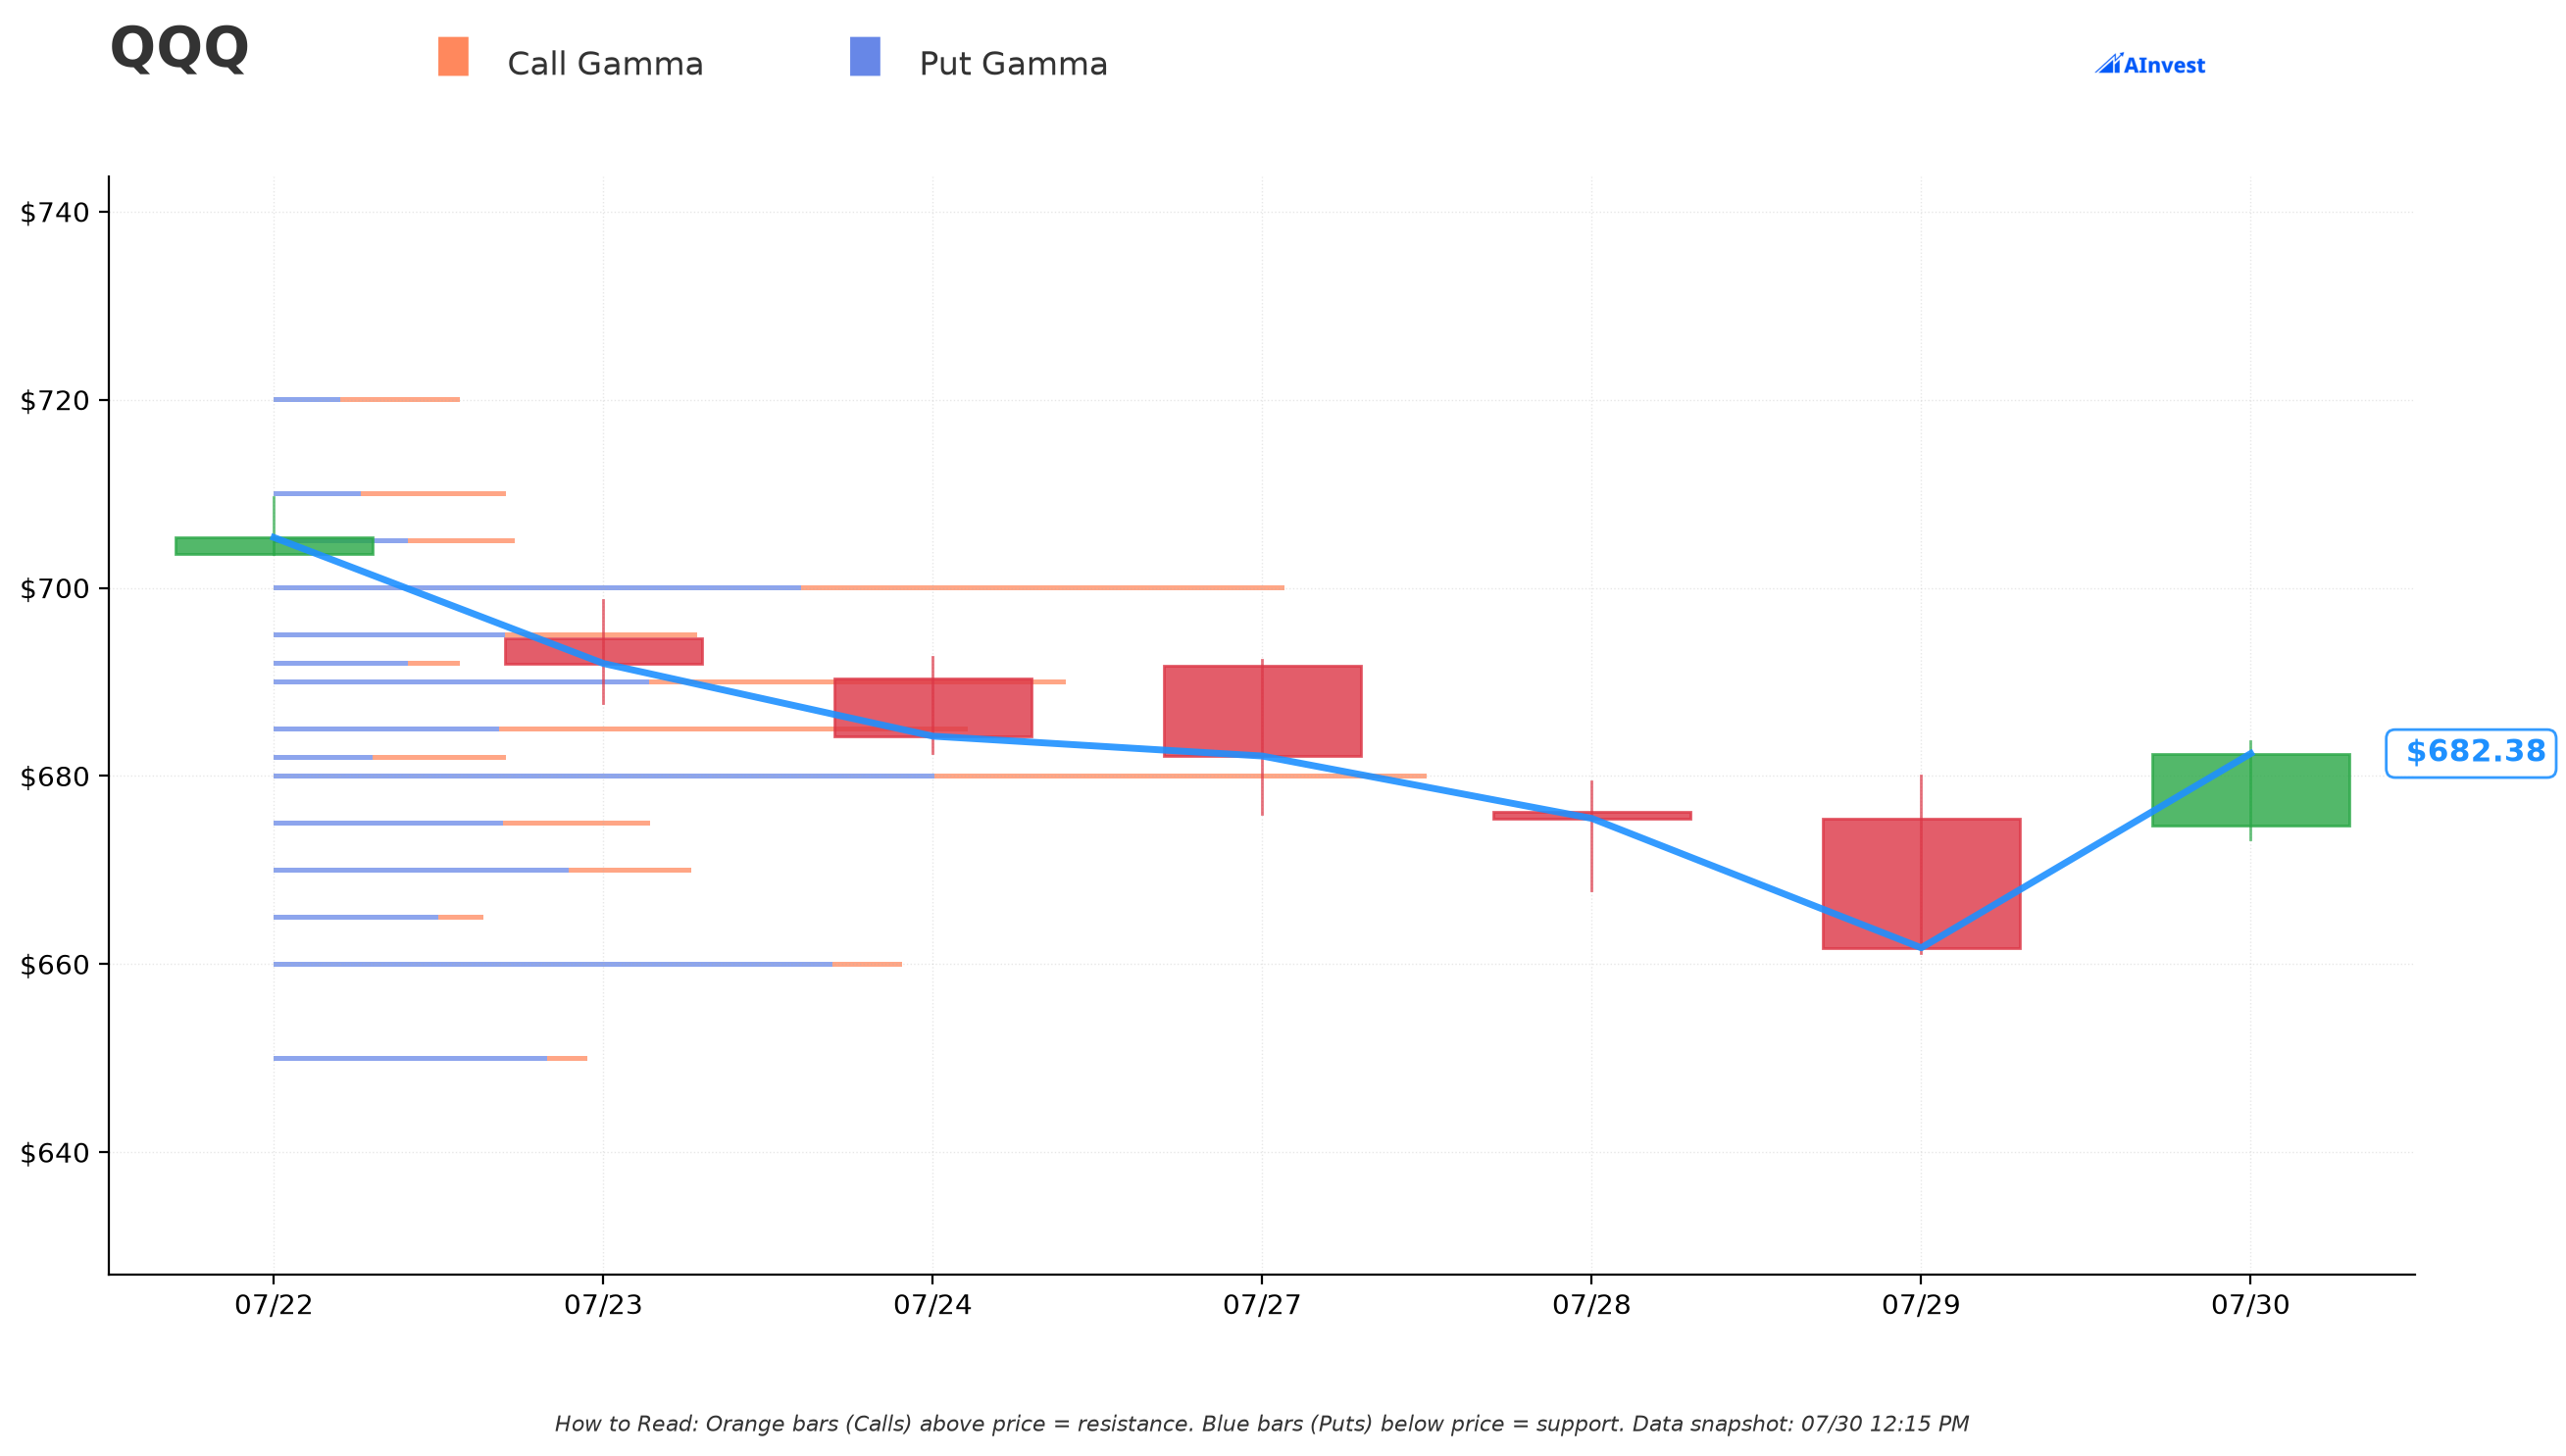
Current price: ≈$682
- 🔵 Support — $680: the strongest wall on the board (≈$313B total gamma), sitting essentially right at spot — this is the pin level for today.
- 🔵 Support — $645: ≈$46B gamma, ≈5.5% below spot — a "very strong" secondary floor.
- 🔵 Support — $640: ≈$36B gamma, ≈6.2% below spot.
- 🟠 Resistance — $700: ≈$276B gamma, ≈2.6% above spot — the next major ceiling dealers will defend.
- 🟠 Resistance — $720: ≈$50B gamma, ≈5.5% above spot — interestingly, this sits right below the $715 strike this morning's call buyer is targeting.
- 🟠 Resistance — $730: ≈$46B gamma, ≈7% above spot.
What this means for traders: QQQ is pinned right at its strongest support wall ($680), with a heavy resistance shelf at $700 that would need to break before a run at the $715 calls' strike gets interesting. The put-calendar's $600 strike sits ≈12% below spot — near a modest gamma shelf, but well outside the market's current gravitational pull. These levels shift daily as new option flow prints, so treat them as a live map, not a fixed prediction.
Implied Move Analysis
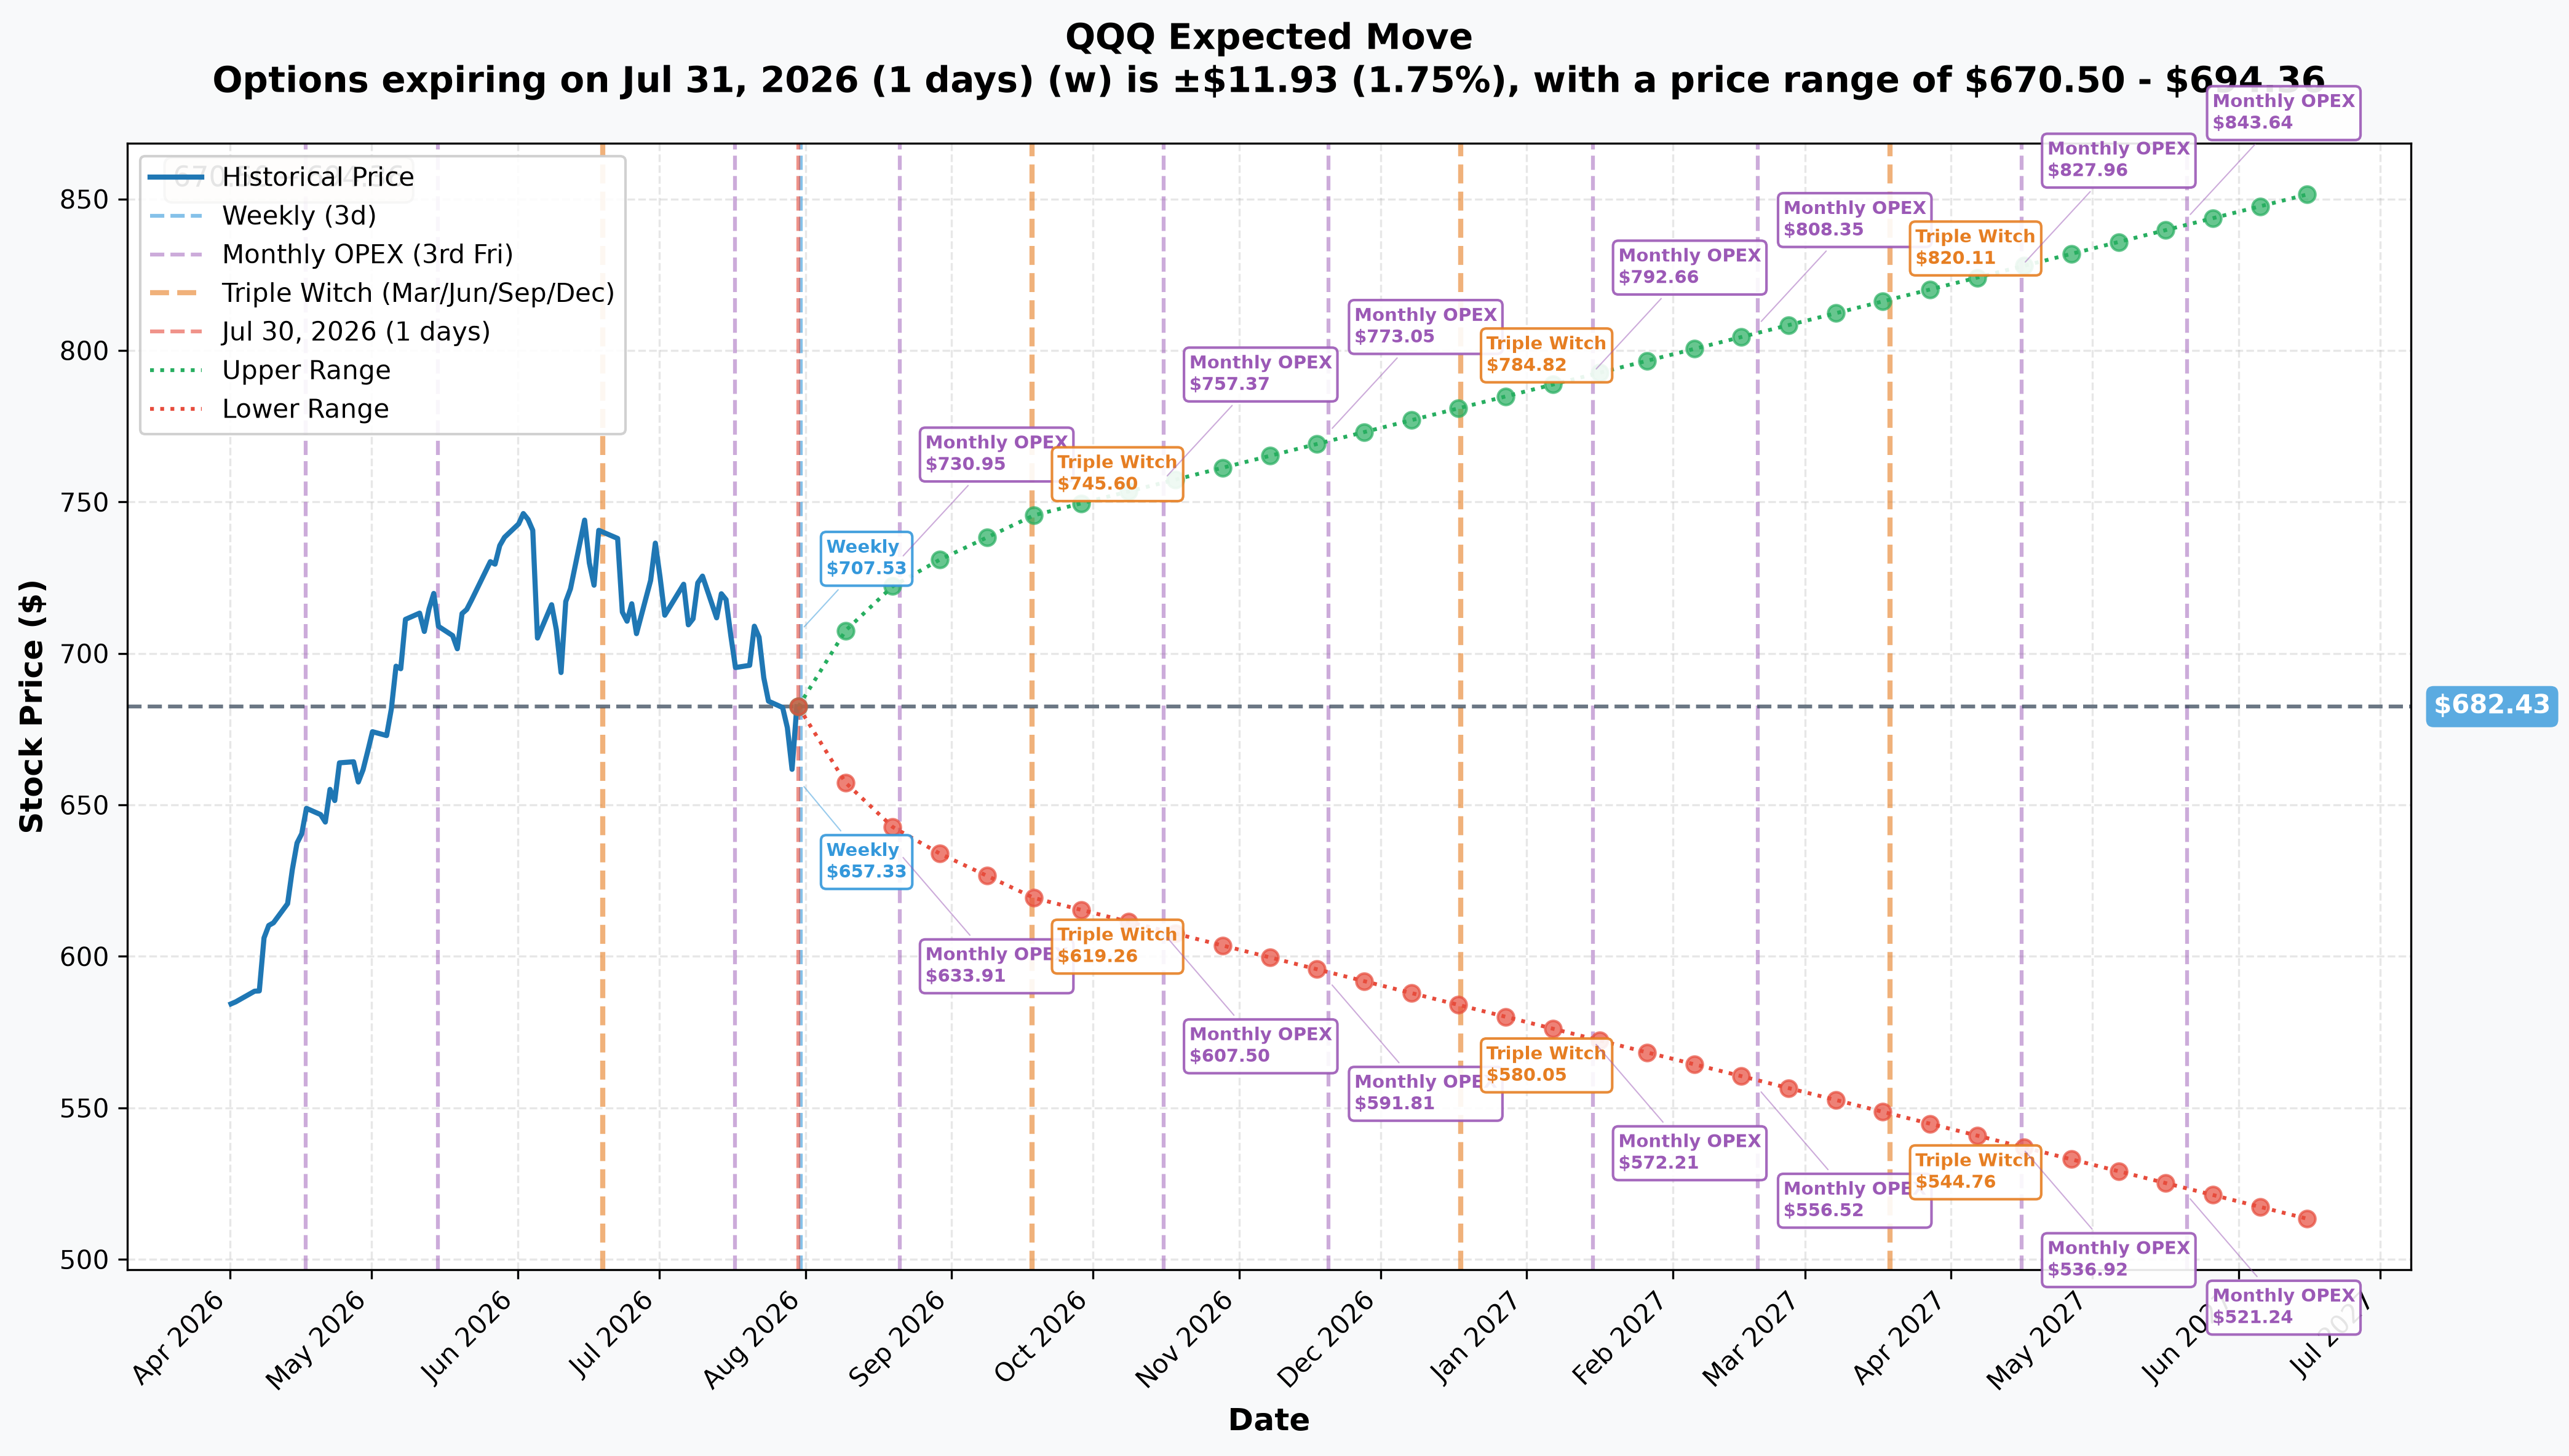
Options pricing for upcoming expirations:
- 📅 Weekly (July 31 – 1 day): ±1.75% (±$11.93) → range $670.50 – $694.36
- 📅 Monthly OPEX (August 21 – 22 days): ±6.25% (±$42.66) → range $639.77 – $725.09
- 📅 Quarterly Triple Witch (September 18 – 50 days): ±9.26% (±$63.17) → range $619.26 – $745.60
- 📅 Yearly/LEAPS (June 17, 2027 – 322 days): ±24.89% (±$169.83) → range $512.61 – $852.27
Translation for regular folks: the market is pricing a tight ±1.75% move for tomorrow (Apple and Amazon report tonight), but by the March-2027 expiration where this morning's call buyer is positioned, the implied range is enormous — the LEAPS-dated cone alone stretches from ≈$513 to ≈$852. That's exactly the kind of wide, uncertain range a long-volatility structure like this one is designed to profit from if QQQ makes a big move either way over the next 18 months, rather than a bet on a specific direction.
🎪 Catalysts
🔥 Already Happened (Last Few Days)
Microsoft (MSFT) — reported July 29, 2026 after close: Adjusted EPS $4.74 on revenue $90.01B, both above estimates, with Azure +43%, crossing $100B in annual revenue for the first time. The stock soared ≈14% — the "AI monetization proven" reaction.
Meta (META) — reported July 29, 2026 after close: Revenue ≈$60.8B (+28% YoY) beat, but EPS missed by ≈14% and declined ≈13% YoY; the company failed to provide 2027 spending guidance. Shares fell >9% — the "capex without clarity" reaction.
Alphabet (GOOGL) — reported July 22, 2026: Beat on EPS ($9.11) and revenue ($119.8B, +24% YoY), with Google Cloud +82%, but capex guidance was raised to $195-205B and shares fell ≈4.2% after hours anyway.
FOMC — July 29, 2026: The Fed held rates at 3.50%-3.75% in a divided 9-3 vote, with three dissenters pushing for higher rates. The next decision is September 15-16.
🚀 Upcoming Catalysts
Apple (AAPL) and Amazon (AMZN) — both report today, July 30, 2026 after close. Apple consensus EPS ≈$1.88-$1.89 after a stretched +20% one-month run; Amazon consensus revenue ≈$196B with focus on AWS growth and AI infrastructure spend. Both reporting the same night means elevated QQQ volatility into Friday's session.
NVIDIA (NVDA) — August 26, 2026 after close. Guidance ≈$91.0B revenue for Q2 FY2027 — as QQQ's ≈8% weight and the AI-capex demand barometer, this is the single biggest name-specific catalyst left in Q3.
FOMC — September 15-16, 2026: the next live rate decision, with three hawkish dissents already on record keeping a hold/hike surprise in play.
Seasonality: August and September are historically the weakest stretch for the Nasdaq-100 — worth noting given the structure's calendars stretch across exactly this window.
🎲 Price Targets & Probabilities
Because this structure is delta-hedged, the useful question isn't "will QQQ go up or down" — it's "how far and how fast will it move." Using gamma levels, implied move data, and the earnings gauntlet ahead:
📈 Big-Move-Up Scenario (the convexity pays off)
Target: $700-$720+ by early 2027
Apple and Amazon deliver clean AI/AWS beats tonight, extending Microsoft's "monetization proven" narrative; NVIDIA's August 26 guide reaffirms AI demand; a September Fed cut re-rates tech multiples. QQQ would need to clear the $700 gamma resistance wall and then the $715-720 shelf — exactly where the long Mar-2027 calls sit. This is one of the two scenarios where the long-vol structure profits.
🎯 Grind-Sideways Scenario (the structure bleeds slowly)
Target: $660-$700 range through year-end
Earnings land in-line, the Fed stays cautious, and QQQ chops inside its current gamma-defined range. This is the scenario the structure is least suited for — the short-dated calendar legs decay, and without a big move, the long convexity doesn't earn back its cost. Time decay works against a long-vol book here.
📉 Big-Move-Down Scenario (the convexity also pays off)
Target: $640-$600 by 2027-2028
A capex-ROI scare broadens beyond Meta, hawkish Fed dissent gains traction, and Aug-Sep seasonal weakness compounds a concentration-driven unwind. The $600 strike — where both puts sit — lines up with a real (if modest) gamma shelf ≈12% below spot. Because the structure is long convexity, a sharp move down can be just as profitable as a sharp move up for the position's net gamma.
💡 Trading Ideas
🛡️ Conservative: Watch, Don't Chase
Play: Treat this flow as a volatility signal, not a directional signal. Don't buy QQQ calls or puts just because a $122M ticket crossed the tape.
Why this works: The whole point of this article is that the headline number is misleading — a delta-hedged structure tells you the desk expects turbulence, not which way. Chasing the $715 calls because "someone bought $75M of them" ignores the ≈825,000-share short that neutralizes the directional read.
Risk level: Minimal | Skill level: Beginner-friendly
⚖️ Balanced: Play the Range with Defined Risk
Play: With QQQ pinned between the $680 support wall and $700 resistance wall, consider a defined-risk iron condor around the August 21 monthly OPEX (implied range $639.77-$725.09) — for example sell the $700 call / buy further OTM call, and sell a put spread below $645.
Why this works: The gamma map shows real, dealer-defended walls at $680 and $700; a range-bound premium-collection strategy profits if the earnings gauntlet resolves into consolidation rather than a breakout — the "grind sideways" scenario above.
Risk level: Moderate (defined risk) | Skill level: Intermediate
🚀 Aggressive: Own the Earnings Volatility (Advanced Only)
Play: With Apple and Amazon reporting tonight and the weekly implied move only ±1.75%, consider a short-dated straddle or strangle around Friday's expiration if you believe the market is underpricing the combined AAPL/AMZN reaction — similar logic to why this morning's institutional structure is a long-vol trade, just on a much shorter fuse.
Why this could blow up: Implied volatility is already elevated into a binary event; IV crush after tonight's prints can erase gains even if QQQ moves. Only size this as a small speculative position, and plan to exit within a day or two of the print — don't hold to expiration.
Risk level: Extreme (can lose 100% of premium) | Skill level: Advanced only
⚠️ Risk Factors
- We cannot see the whole book. OPRA shows us the option prints and the paired equity block, but not the trader's other positions, broker, or true intent. The delta-hedge is verified by the numbers matching — but why they wanted this specific volatility exposure (portfolio hedge? proprietary vol trade? structured product financing?) is inferred, not proven.
- Per-leg direction on a hedged combo is unreliable. Because this is a coordinated multi-leg package, reading any single leg's "%-across" or aggressor signal in isolation can mislead — the legs were priced as a package, not four independent trades.
- ✅ Open/close is now RESOLVED — every leg opened. The Sep-2026 $710 call and both $600 puts all showed rising open interest on the July 31 snapshot, so the "this might be an unwind" risk is retired. The residual nuance: the Jun-2027 $600 put built only ≈41% new contracts, so that leg added less net new exposure to the market than its 4,000-lot size suggests.
- Earnings binary risk tonight. Apple and Amazon report after tonight's close; QQQ's implied weekly move is only ±1.75%, but Meta's −9% reaction on July 29 shows the market can be caught offside on any of these prints.
- Concentration and valuation. QQQ's ≈46% top-10 weight and Nasdaq-100 P/E ≈29.6 leave little room for a heavyweight miss to ripple through the whole index.
- This is not investment advice. Options trading involves substantial risk of loss and may not be suitable for all investors. This analysis is for educational purposes only.
🎯 The Bottom Line
Real talk: the biggest options ticket on QQQ today — $122M gross across five legs — looks like a massive bullish call bet at first glance, but the tape tells a different story once you follow the paired stock blocks. Buying $75M of Mar-2027 $715 calls while simultaneously shorting ≈825,000 shares of QQQ is a delta-neutral long-volatility position, not a directional wager. Layer in the call calendar (financing the long calls by selling near-term premium) and the put calendar at $600 (a term-structure bet, not a crash call), and what you have is a sophisticated desk positioning for how much QQQ moves, not which way — right as Apple and Amazon report tonight into a market still digesting Microsoft's +14% and Meta's −9% earnings reactions.
If you own QQQ: nothing here should change your thesis — this flow doesn't tell you which way institutions think the index is headed. Watch the $680 and $700 gamma walls for near-term pin risk into tonight's prints.
If you're watching from the sidelines: the real signal is that a sophisticated player is paying up for convexity across an 18-month horizon spanning multiple Fed meetings and mega-cap earnings cycles — that's a reasonable cue to expect elevated realized volatility in QQQ, not to pick a side.
Mark your calendar:
- 📅 Tonight, July 30 after close — Apple and Amazon earnings
- 📅 August 21 — Monthly OPEX (implied range $639.77-$725.09)
- 📅 August 26 — NVIDIA earnings
- 📅 September 18 — Triple witch, and the expiration of the short $710 call leg
- 📅 September 15-16 — Next FOMC decision
✅ The OI-confirmed read is in (July 31 pre-market): this structure opened fresh risk — it did not adjust or unwind an existing one. Open interest rose on all four strikes, including the Sep-2026 $710 call sale that would have fallen had the desk been closing. The delta-hedged volatility and term-structure interpretation stands, now on confirmed rather than provisional footing.
Last updated: 2026-07-31 — next-day OPRA open-interest resolved all four legs as OPENING (Mar-2027 $715C +14,526; Sep-2026 $710C +10,968; Dec-2028 $600P +3,043; Jun-2027 $600P +1,651, a ≈41% partial open).
Disclaimer: Options trading involves substantial risk of loss and is not suitable for all investors. This analysis is for educational purposes only and not financial advice. The delta-hedge identification is based on matching the paired equity block size to the option's implied share-delta — it is strong evidence, not certainty, and OPRA data cannot reveal the trader's identity, broker, or full portfolio context. Always do your own research and consider consulting a licensed financial advisor before trading.