🧩 QQQ $5.55M Risk Reversal — Not the $17M Call Buy It Looked Like
📅 July 31, 2026 | 🔥 Unusual Activity Detected
✅ UPDATE — August 3, 2026 pre-market: the OI check is in and both legs opened. The Jan-2028 $800 call went 2,710 → 5,463 (+2,753, ≈92% of print); the $600 put went 4,092 → 4,813 (+721, ≈24%). The fresh synthetic-long read is confirmed — with an honest caveat that ≈76% of the put leg was existing contracts changing hands. See the ✅ RESOLVED box.
🎯 The Quick Take
The screenshot showed a lone $17M purchase of January 2028 $800 calls on QQQ (Invesco QQQ Trust) — but the real OPRA tape tells a different story. At 09:58:54, the same trader also sold $11.4M of January 2028 $600 puts in the same negotiated block. Net premium actually committed is $5.55M, not $17M. This is a long risk reversal — a synthetic long position on the Nasdaq-100 that stretches to January 2028 — and the dangerous half of the trade is the put they sold, not the call they bought. Translation: headline premium ≠ capital at risk, and the real risk here is an open-ended obligation below $600.
🏛️ Fund Overview — What You're Actually Buying
QQQ tracks the Nasdaq-100 Index, which per Invesco comprises "the 100 largest non-financial companies traded on the Nasdaq." The fund launched March 10, 1999.
Key facts (per StockAnalysis and Invesco):
| Metric | Value |
|---|---|
| Price (Jul 31, 2026) | $688.46 intraday |
| Net assets (AUM) | ≈$455.5B |
| Expense ratio | 0.18% |
| Dividend yield | 0.44% |
| 52-week range | $551.68 – $748.65 |
| 1-year total return | +21.71% |
| Number of holdings | 106 |
🔧 Structural change: On December 19, 2025, shareholders voted to convert QQQ from a unit investment trust into an open-end fund (effective December 22, 2025), per Invesco's press release via PR Newswire. The fee dropped from 0.20% to 0.18%, and the fund can now reinvest dividends and lend securities — small tailwinds that matter over an 18-month LEAP hold.
Top holdings (as of July 24, 2026, per StockAnalysis):
| # | Holding | Weight |
|---|---|---|
| 1 | Apple (AAPL) | 8.26% |
| 2 | NVIDIA (NVDA) | 7.93% |
| 3 | Microsoft (MSFT) | 4.82% |
| 4 | Micron Technology (MU) | 4.68% |
| 5 | Amazon (AMZN) | 4.15% |
| 6 | AMD | 3.72% |
| 7 | Alphabet A (GOOGL) | 3.17% |
| 8 | Broadcom (AVGO) | 3.03% |
| 9 | Alphabet C (GOOG) | 2.97% |
| 10 | Meta (META) | 2.93% |
Top 10 = 45.67% of the fund. 🧠 Note the standout: Micron is now the #4 holding at ≈4.7% — bigger than Amazon. Add AMD (3.72%), Broadcom (3.03%) and Intel (2.12%) and you get ≈21.5% of QQQ sitting in semiconductors before even counting NVDA. Per The Motley Fool, technology is 66.9% of the fund and consumer discretionary 17.6% — ≈85% of QQQ in two sectors, with essentially zero financials by index construction.
What this means for a Jan-2028 call: you're not buying diversified equity exposure. You're buying a leveraged bet on (a) the AI/semiconductor capex cycle, (b) mega-cap platform earnings, and (c) long-duration growth valuations — all of which are rate-sensitive.
💰 The Option Flow Breakdown
📊 What Just Happened — Both Legs, From the Tape
A full-chain scan of the January-2028 QQQ options at 09:58:54.245 turned up exactly two prints, both size 3,000, both a negotiated multi-leg block cross (🤝 known counterparty, off the lit book — not a sweep, no aggression):
| Time | Symbol | Buy/Sell | Call/Put | Expiration | Premium | Strike | Volume | OI | Size | Spot | Option Price | Option Symbol |
|---|---|---|---|---|---|---|---|---|---|---|---|---|
| 09:58:54 | QQQ | BUY | CALL | 2028-01-21 | $16.95M | $800 | 3,014 | 2,710 | 3,000 | $686.39 | $56.49 | QQQ20280121C800 |
| 09:58:54 | QQQ | SELL | PUT | 2028-01-21 | $11.40M | $600 | 3,121 | 4,092 | 3,000 | $686.39 | $38.00 | QQQ20280121P600 |
🤝 BLOCK CROSS — negotiated, not urgent buying. The call leg printed at the offer ($56.50 ask, 100% across NBBO); the put leg printed at the bid ($38.00 bid, 0% across). Both legs printed in the same millisecond as part of one package — a broker matched both sides of this off the open book.
- Gross premium: $16.95M paid for the call + $11.40M collected from the put = $28.35M of gross flow.
- Net premium — the number that matters: $5.55M debit. The put sale financed 67% of the call purchase.
- Spot $686.39. The $800 call strike sits ≈17% above spot; the $600 put strike sits ≈13% below spot. Horizon: ≈18 months.
- Package net delta: ≈+198,450 shares of QQQ-equivalent exposure — moderately bullish, not maximally leveraged.
✅ RESOLVED — Both Legs Opened. The Call Cleanly, the Put Only Partly.
Neither leg was a clean "proven open" from the tape alone. The August 3 pre-market OPRA snapshot resolves both — and both came back on the opening side, though with very different strength:
| Leg | Baseline OI (Jul 31 snap) | Resolving OI (Aug 3 snap) | Δ | Print size | Δ as % of print | Verdict |
|---|---|---|---|---|---|---|
| Jan-21-2028 $800 Call (bought) | 2,710 | 5,463 | +2,753 | 3,000 | ≈92% | ✅ OPEN (BTO) — clean |
| Jan-21-2028 $600 Put (sold) | 4,092 | 4,813 | +721 | 3,000 | ≈24% | ⚠️ PARTIAL OPEN (STO) — ≈76% transferred |
The call leg is settled and strong. We warned that "at most 290 contracts are provably new opens." In fact open interest rose by 2,753 — ≈92% of the entire 3,000-lot print became genuinely new exposure. The "part or all of it was a close" scenario is ruled out; this is a real fresh long call.
The put leg needs an honest asterisk. Open interest rose, so the direction is settled — this was opening, not closing, and the short-put obligation described below is real. But it rose by only 721 contracts against a 3,000-lot sale, meaning roughly 76% of that leg was existing open interest changing hands rather than new contracts being created. Someone else was closing a short $600 put at the same moment this desk was opening one. The structure and the risk profile are unchanged — this trader genuinely carries the obligation on all 3,000 — but the market-wide build in $600 puts is far smaller than the headline size suggests.
Bottom line for the risk-reversal read below: it holds. Both legs opened, so this is a brand-new synthetic long position, not an adjustment of an existing one. The BTO/STO labels are now confirmed rather than inferred.
🤓 What This Actually Means — Plain English
Think of this trade in two separate pieces, because they carry very different risk:
Piece 1 — the call they bought ($16.95M paid): a long call, struck 17% above today's price, expiring January 2028. On its own, this is a simple bullish bet: if the Nasdaq-100 is meaningfully higher in 18 months, this pays off.
Piece 2 — the put they sold ($11.40M collected): this is where it gets interesting. Selling a put means they are obligated to buy QQQ at $600 if it's below that price at expiration — no matter how far below. In exchange for taking on that obligation, they collected $11.4M in premium up front, which they used to help pay for the call.
Put the two pieces together and you get a "risk reversal" — Wall Street's name for a synthetic long stock position built entirely with options. Owning a risk reversal behaves a lot like owning the index outright between $600 and $800: you make money as QQQ rises above $800, you lose money as it falls below $600, and between those two strikes you're mostly flat (aside from the small net debit paid).
Why this matters for a retail trader reading the headline "$17M call buy": that headline is technically true but badly misleading. The trader did not commit $17M of capital — they committed $5.55M net, financing the rest by taking on a real, open-ended obligation. If you only read the call side, you'd think this was a straightforward $17M bullish bet. It's actually a much cheaper, much riskier structure: cheap upside financed by dangerous downside.
The short put is the risk, and it is NOT bounded like a normal option purchase. If you buy a call and you're wrong, you lose only what you paid. If you sell a put and you're wrong, your loss grows the further the index falls below $600 — theoretically all the way to zero, though a ≈68% collapse in the Nasdaq-100 is an extreme tail scenario. This is not a structure retail traders should casually replicate. Selling a naked put on an index, especially with an 18-month horizon, carries margin requirements and open-ended downside that most retail accounts are not built to withstand. If you want the "cheap upside" idea, buying a call outright — paying full price, with your loss capped at the premium — is the far safer way to express the same bullish view.
Order type, plainly stated: ✅ now confirmed, not inferred. The classifier defaulted to BTO on the call and STO on the put — a brand-new synthetic long position — and the August 3 next-day open-interest snapshot confirmed both legs opened (call +2,753 of 3,000; put +721 of 3,000). This is a fresh synthetic long, not an adjustment. The one caveat carried forward from the ✅ RESOLVED box above: only ≈24% of the put sale created new market-wide open interest — the rest was existing contracts changing hands.
📈 Technical Setup / Chart Check-Up
YTD Performance
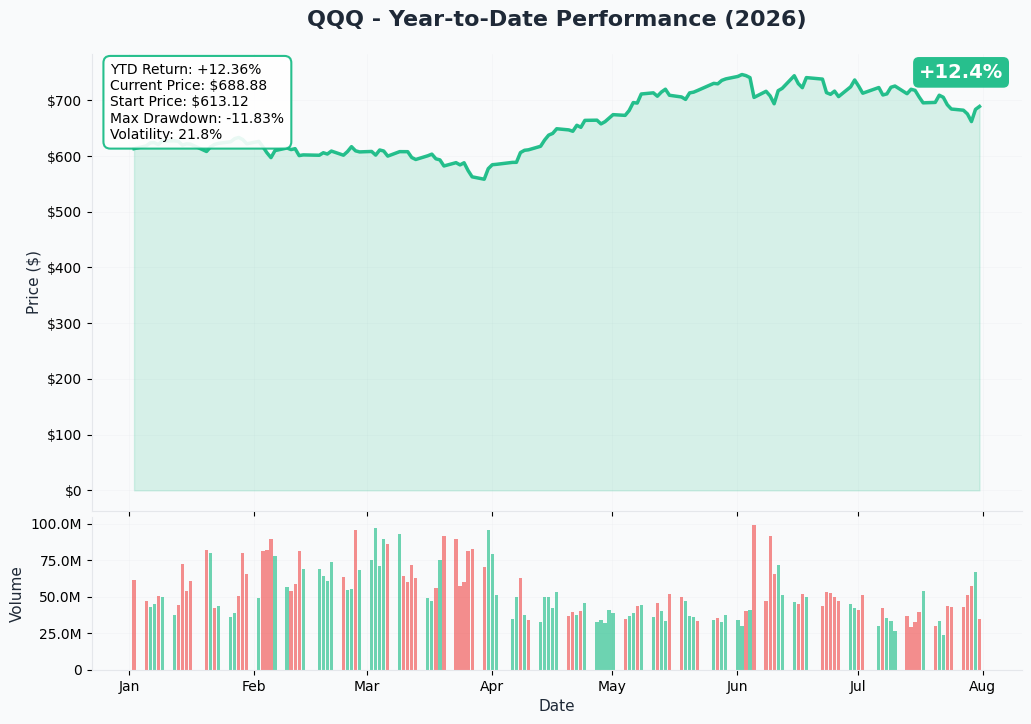
QQQ enters August at ≈$686-689, about 8.3% below its 52-week high of $748.65, after a 2026 that went melt-up → correction → violent earnings rebound (full story in the Catalysts section below).
🎯 Gamma-Based Support & Resistance
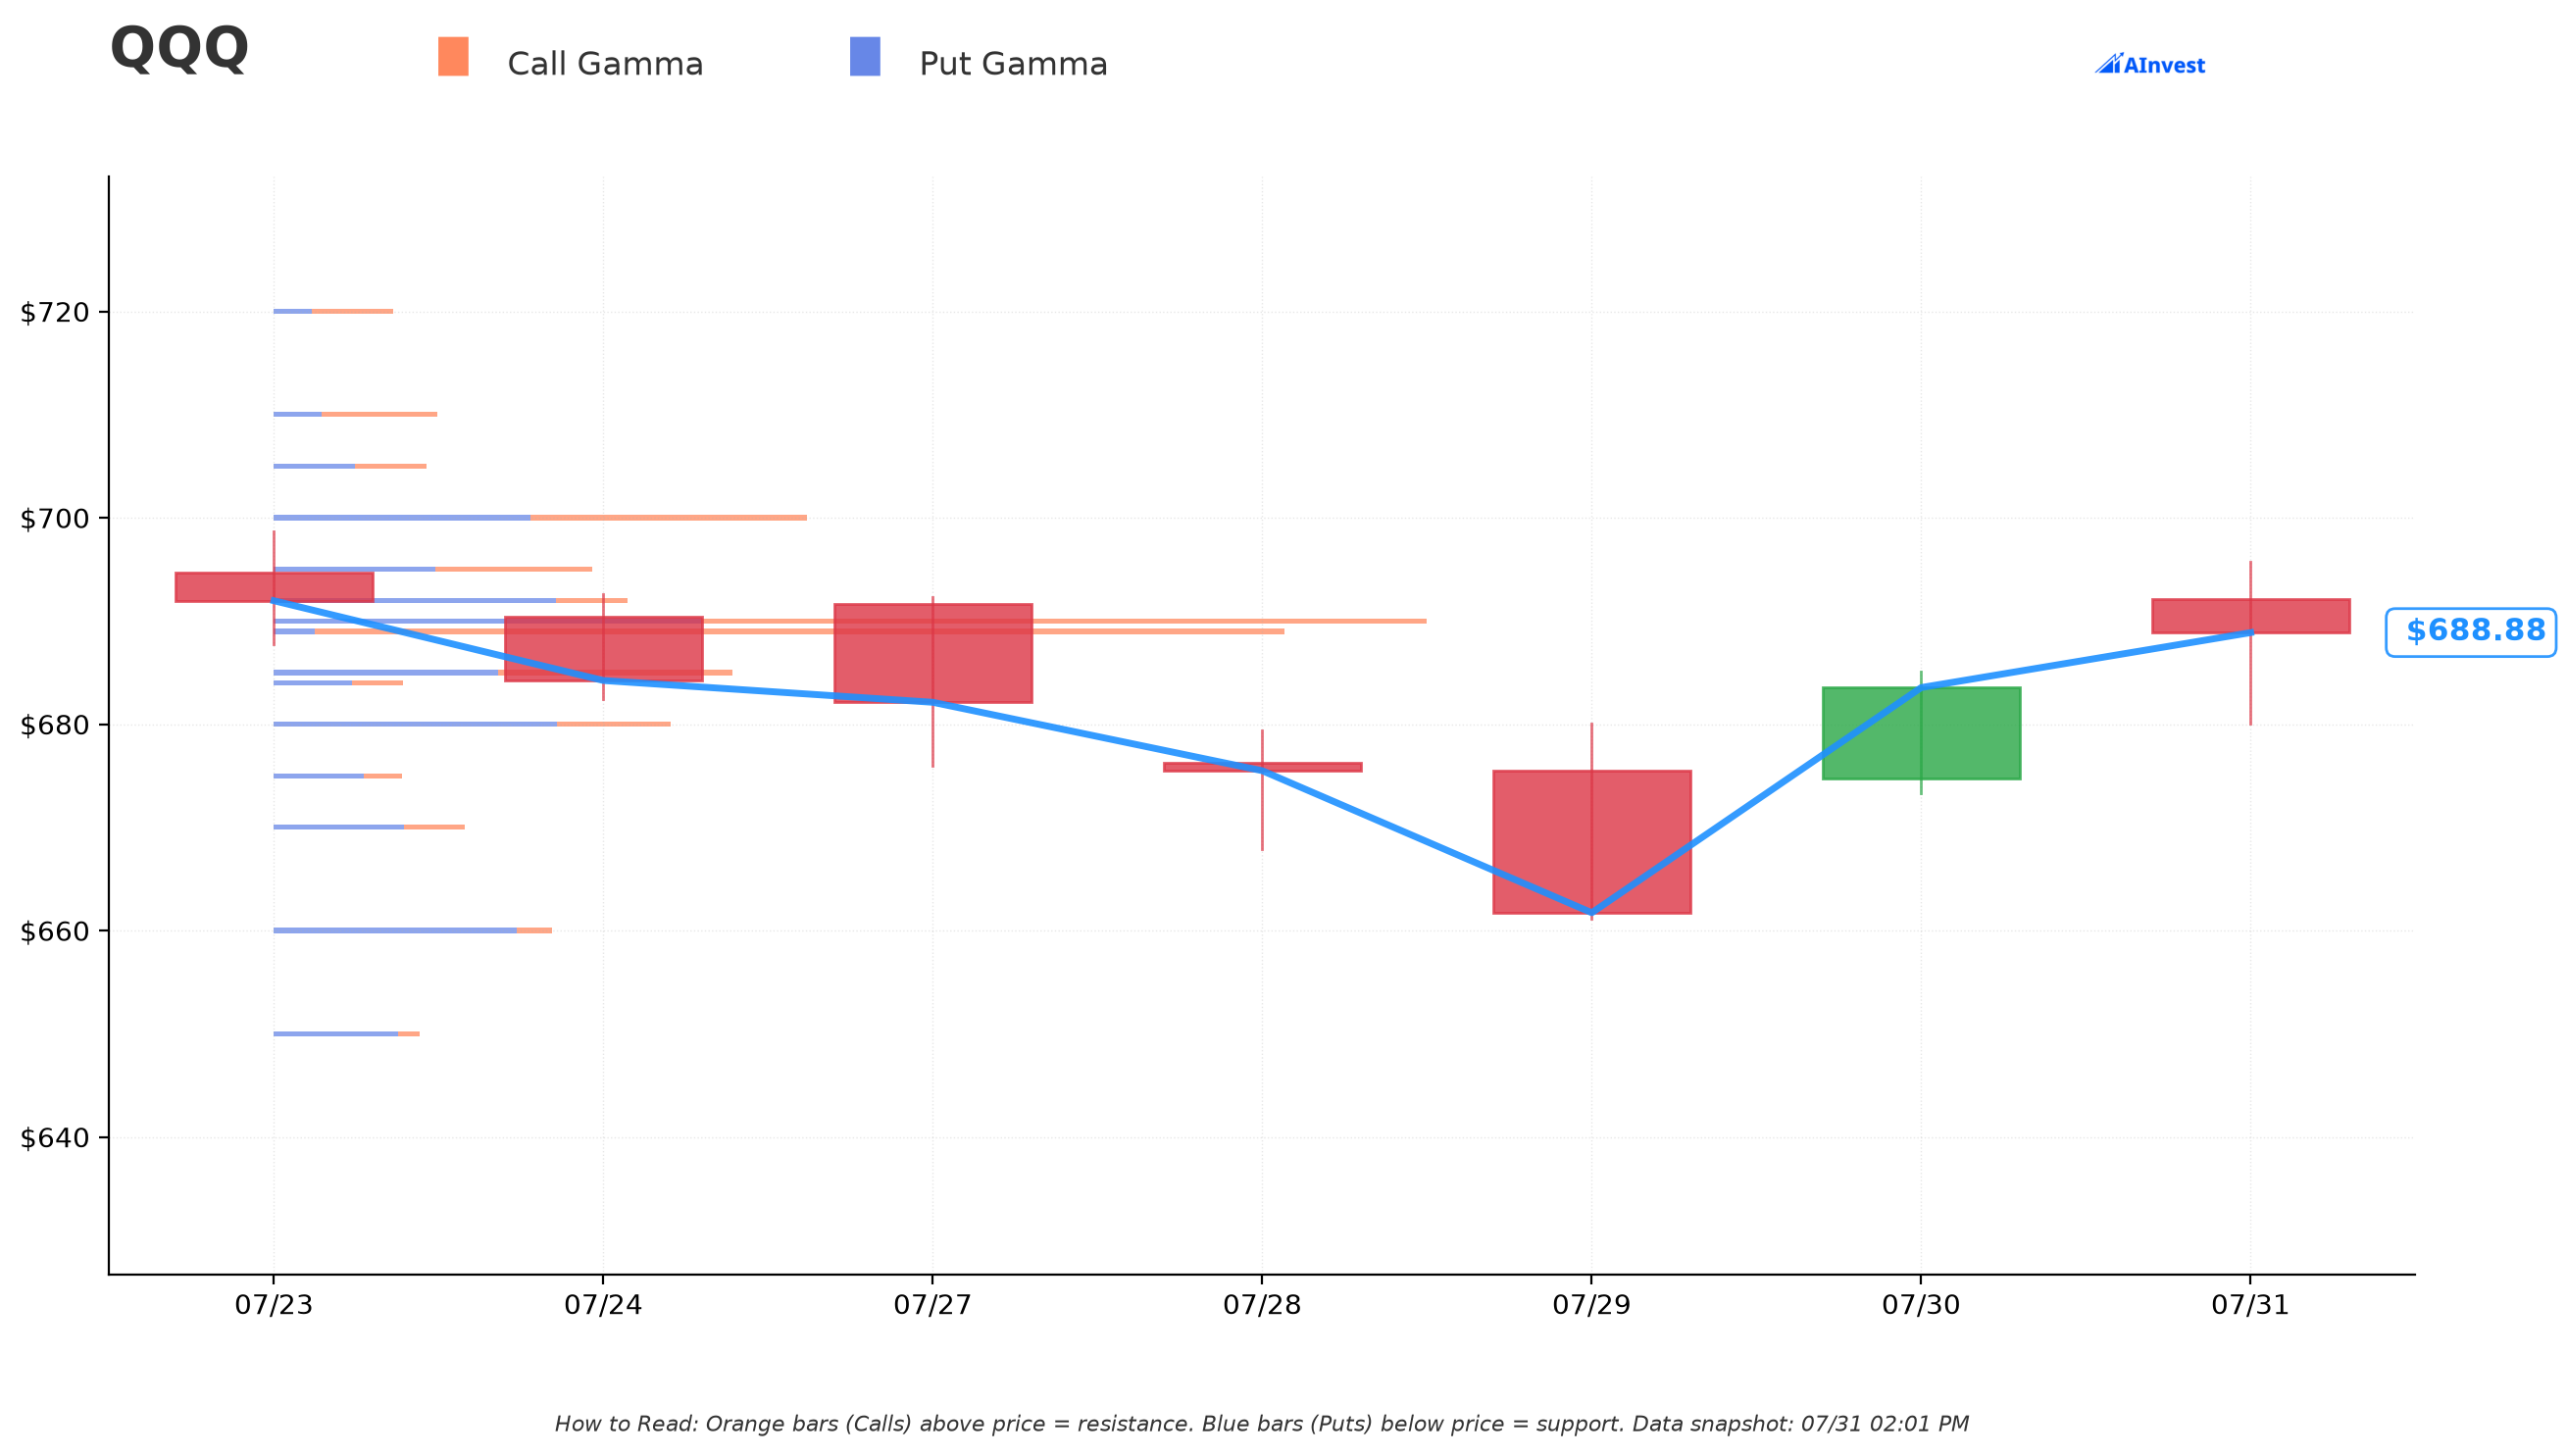
Current price for this gamma read: $689.00. The nearest levels from gex.json:
🟠 Resistance (call gamma above price):
- $689–$690 — the largest wall on the board, total gamma 868.8 at $689 and 584.4 at $690 (net gamma sharply positive here — dealers are long gamma right at spot, which tends to dampen swings). This is essentially at-the-money resistance, the single strongest gravitational point on the chain.
- $700 — total gamma 284.0, roughly 1.6% above spot.
- $720 — total gamma 60.0, ≈4.5% above spot.
🔵 Support (put gamma below price):
- $685 — total gamma 228.2, ≈0.6% below spot — the nearest meaningful floor.
- $680 — total gamma 175.7, ≈1.3% below spot.
- $650 — total gamma 72.7 (mostly put gamma — 62.0 put vs. 10.7 call), ≈5.7% below spot — the first level where dealers are decisively short gamma below.
What this means for a Jan-2028 position: near-term, QQQ is pinned by heavy gamma right at $685–$690 — expect the index to gravitate toward that band into August OPEX. The $800 call strike sits ≈16% above the nearest visible resistance wall at $800 (gamma 24.2) — a real but comparatively thin level this far out, meaning gamma structure this far dated is a weak guide; the call strike is really a fundamental/macro bet, not a gamma-magnet bet. The $600 put strike lines up almost exactly with a real support shelf (total gamma 35.0 at $600, mostly put gamma), which is a mildly favorable sign for the put seller — dealers have historically defended that zone, though gamma levels this far from expiration carry much less predictive weight than near-dated ones.
📏 Implied Move Analysis
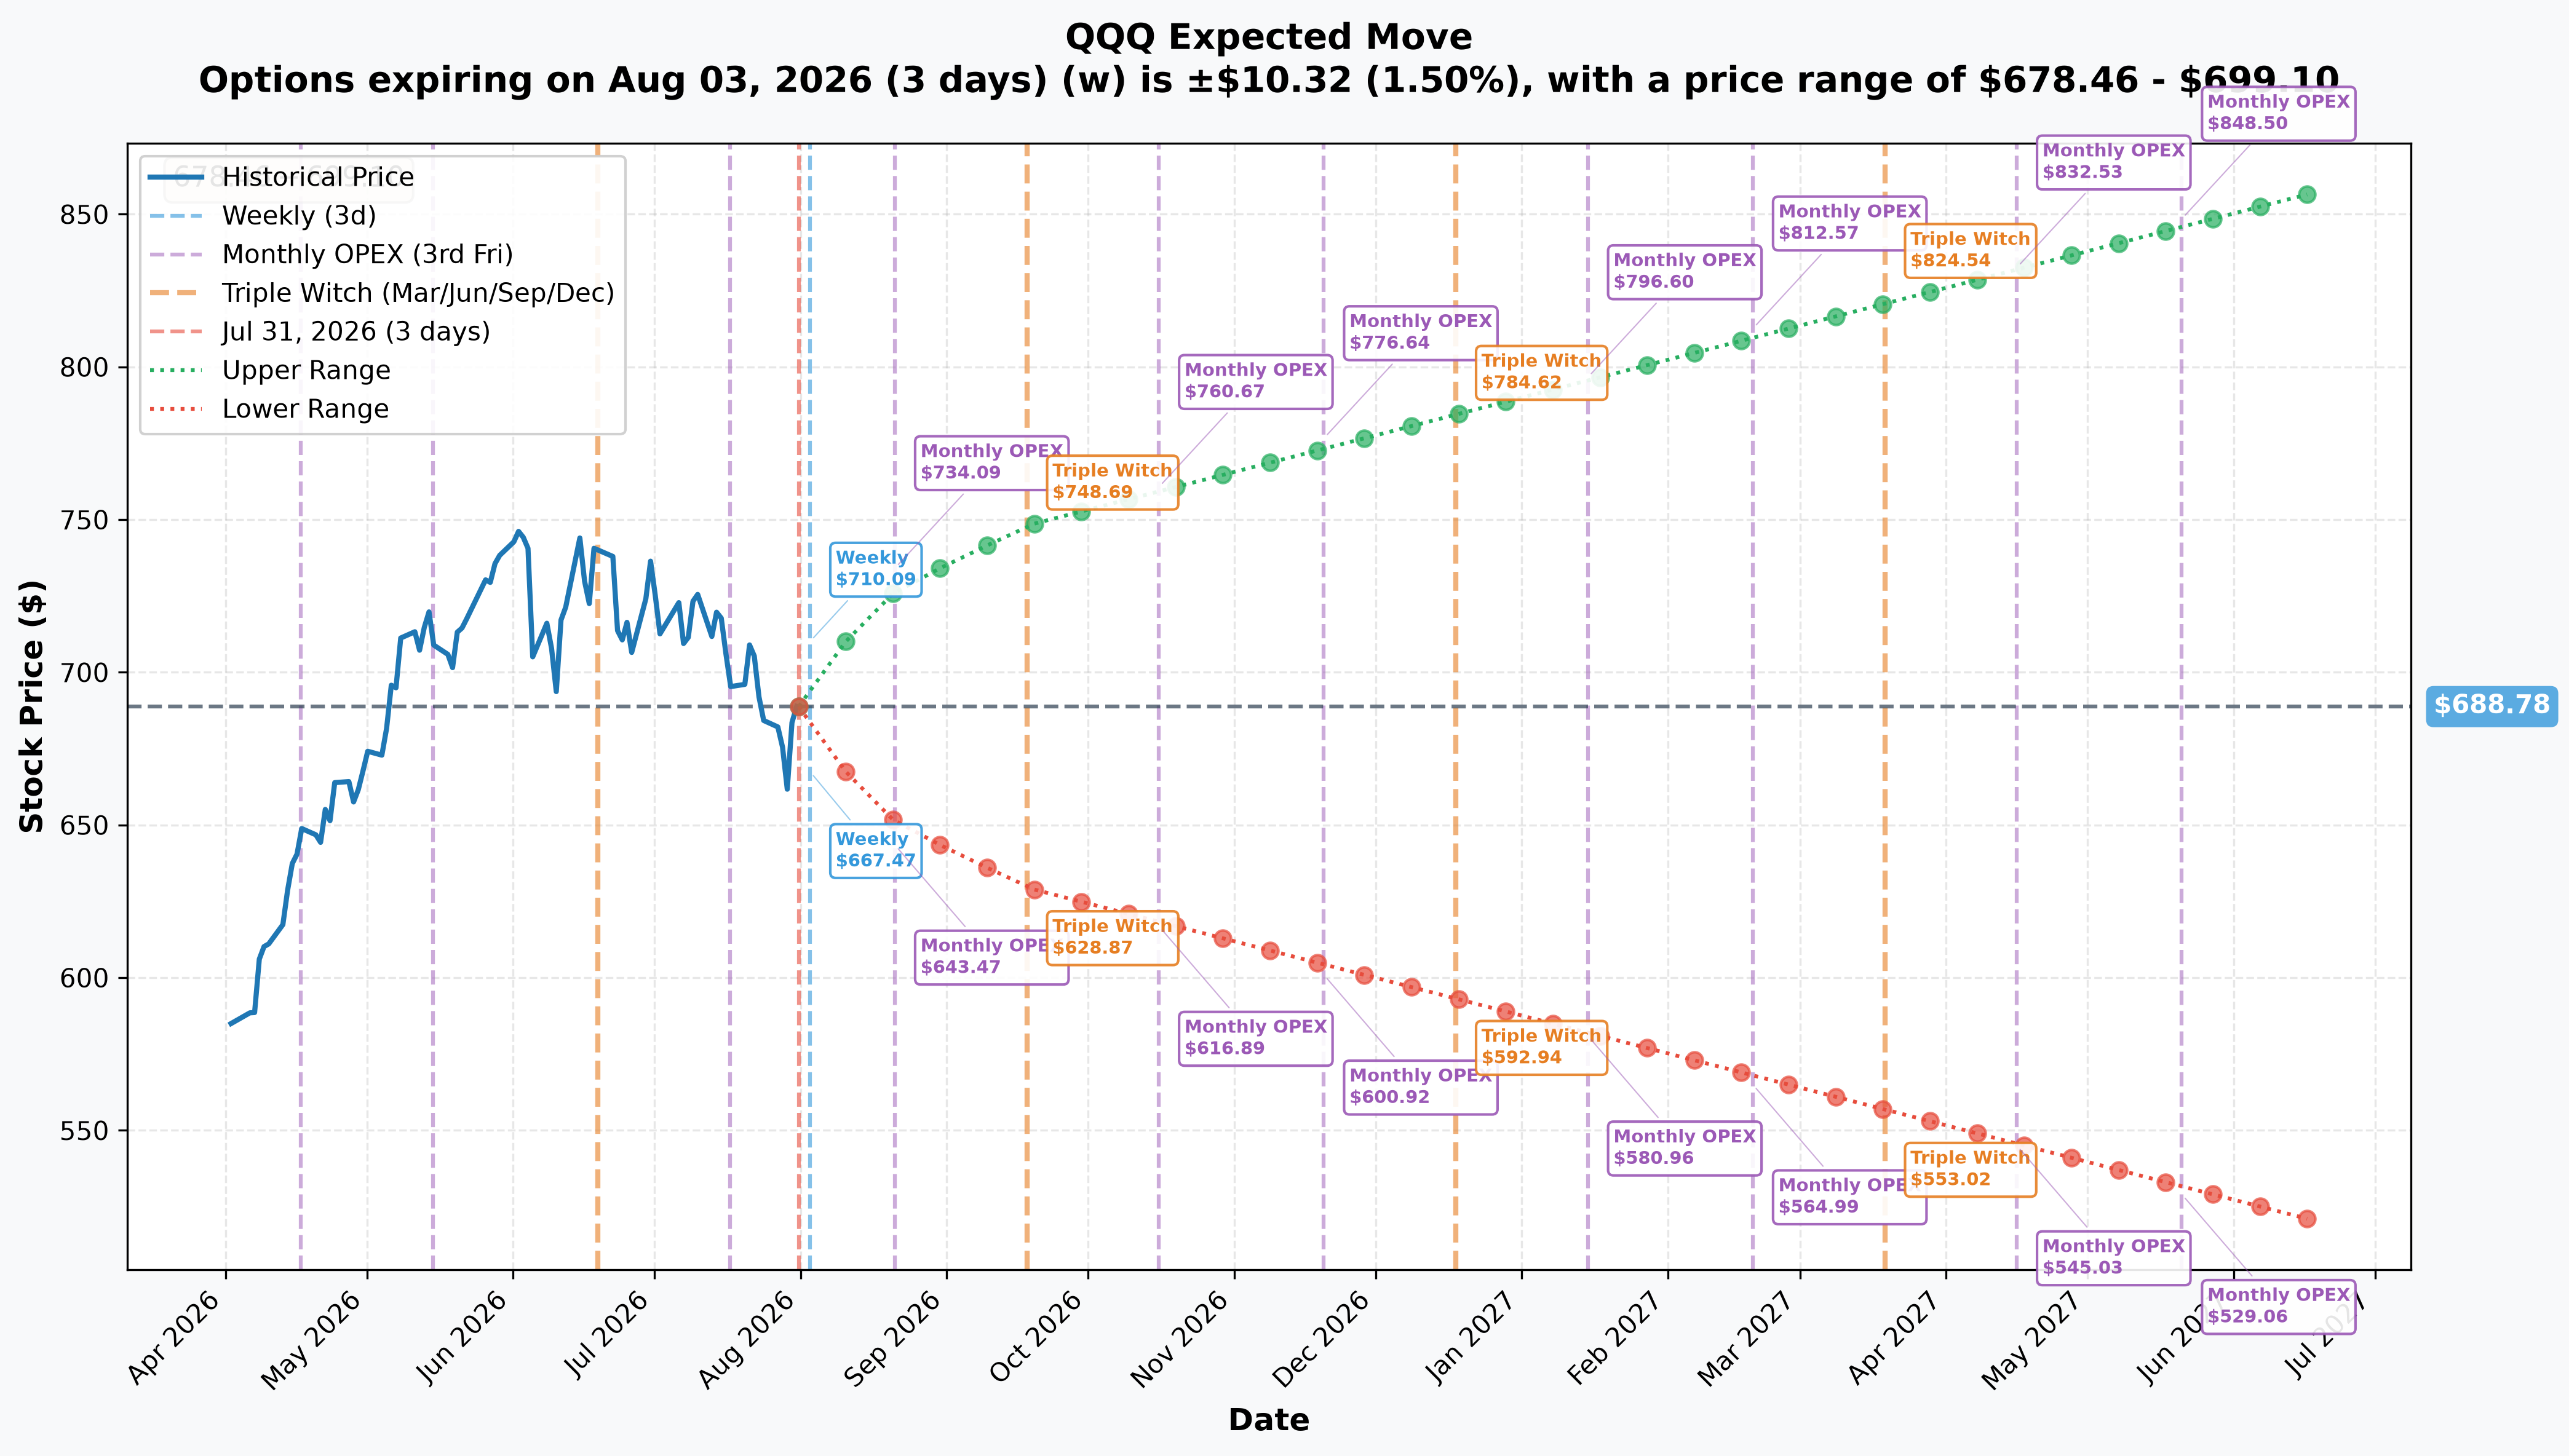
Options market pricing for QQQ (spot $688.78, per QQQ_implied_move.json):
- 📅 Weekly (Aug 3, 2026 — 3 days): ±1.5% (±$10.32) → range $678.46 – $699.10
- 📅 Monthly OPEX (Aug 21, 2026 — 21 days): ±5.6% (±$38.58) → range $650.20 – $727.36
- 📅 Quarterly Triple Witch (Sep 18, 2026 — 49 days): ±8.64% (±$59.51) → range $629.27 – $748.29
- 📅 Yearly LEAPS proxy (Jun 17, 2027 — 321 days): ±24.41% (±$168.10) → range $520.68 – $856.88
Translation: the options market is NOT pricing certainty either way over the life of a Jan-2028 contract. Using the closest available reference (the June 2027 LEAPS implied range), the market's own pricing implies QQQ could plausibly trade anywhere from ≈$521 to ≈$857 with normal volatility assumptions — and that's before the additional ≈7 months out to January 2028. Both strikes in this risk reversal sit inside a range the options market itself considers plausible. The $800 call (≈17% above spot) is inside the upper half of that implied range; the $600 put (≈13% below spot) sits comfortably above the lower bound of ≈$521 — meaning the market is pricing real, non-trivial odds of QQQ testing $600 before January 2028, which is exactly the risk the put seller is being paid to accept.
🎪 Catalysts
🔴 Already Happened — The Last 3 Months
Fed regime change — the dominant macro fact. Kevin Warsh was confirmed as Fed chair on May 13, 2026 and sworn in May 22, 2026. At the July 29, 2026 FOMC meeting, per the official Fed statement, rates were held at 3.50–3.75% on a 9–3 vote, with Hammack, Kashkari and Logan dissenting in favor of a 25bp HIKE. Per U.S. Bank, markets now anticipate one to two hikes by end-2026. This is a real headwind for a long-dated, long-duration index bet — hikes compress the multiple on the most rate-sensitive index in US large caps.
The July 2026 correction. IBTimes reported the Nasdaq-100 fell ≈10% from its June record by July 29, entering correction territory, with the Philadelphia Semiconductor Index down 24%. CNBC put chip-sector losses at more than $1 trillion, and Yahoo Finance confirmed Micron, Samsung and SK Hynix are all >20% off highs — a bear market in memory. Since Micron alone is ≈4.7% of QQQ, this is an index-level event.
The mega-cap earnings rebound. On July 30, 2026, per The Motley Fool, Microsoft surged 15–16% — its strongest single-day gain since 2008 — driving the Nasdaq Composite up 2.8%. Per CNBC and Yahoo Finance, Azure grew 43%; per Yahoo Finance, AWS grew 36.7%, the fastest pace in 18 quarters; per BigGo Finance, Google Cloud grew 82% with a $514B backlog. Per Investing.com, Apple briefly touched a $5 trillion market cap. But Meta missed badly — per TradingKey, adjusted EPS of $6.18 vs. $7.13 consensus, shares down over 7% after hours.
⚠️ The honest capex flag: per IBTimes, Alphabet posted its first-ever negative quarterly free cash flow (−$5.9B) despite raising FY2026 capex guidance to $195–205B. Per Introl's analysis, hyperscalers raised $108B of debt in 2025 with ≈$1.5T of issuance projected ahead — the capex boom is increasingly debt-funded, converting an equity-story risk into a credit-cycle risk. And Microsoft's headline capex "cut" to ≈$175B came from extending depreciation schedules from 15 to 25 years, an accounting change, not a reduction in physical buildout.
🟢 Upcoming — Mapped to This Option's Life (Expires 2028-01-21)
All of the following fall well inside the contract's ≈18-month life:
| Date | Event | Why it matters |
|---|---|---|
| Aug 7, 2026 | July jobs report | After June's 57K miss, confirms or reverses the labor-cooling trend |
| Aug 12, 2026 | July CPI | First read to capture the post-July-8 oil re-spike |
| Aug 26, 2026 | July PCE (Fed's preferred gauge) | Core PCE is currently 3.3% y/y, 130bp above target |
| Aug 26, 2026 | 🔥 NVIDIA FQ2 FY2027 earnings | 7.93% of QQQ; the AI-trade sentiment proxy |
| Sep 15–16, 2026 | 🔥 FOMC + Summary of Economic Projections | First full dot plot under Chair Warsh with 3 standing hike dissents — the single largest scheduled macro risk before year-end |
| ≈Sep 18, 2026 | Nasdaq-100 quarterly rebalance + quad witching | Mechanical flow event in QQQ/NDX options |
| Oct 27–28, 2026 | FOMC meeting | Live meeting for a hike if energy-driven inflation persists |
| ≈Oct 28–30, 2026 | 🔥 Microsoft, Meta, Alphabet, Apple, Amazon Q3 2026 earnings | Second read on whether cloud acceleration is durable and where 2027 capex lands |
| Nov 3, 2026 | US midterm elections | Morgan Stanley sees limited direct market impact |
| Dec 8–9, 2026 | 🔥 FOMC + final 2026 SEP | Sets the 2027 rate path this option has to live through |
| ≈Dec 11, 2026 | 📋 Nasdaq-100 reconstitution announcement | Watch whether the memory/storage cohort (MU, STX, WDC) gets weight-reduced after its >20% drawdown |
| ≈Dec 21, 2026 | 📋 Reconstitution effective | Composition risk — with AAPL at 8.26% and NVDA at 7.93%, a concentration-trigger rebalance is live to monitor |
| Late Jan 2027 | Q4 2026 mega-cap earnings begin | Sets the 2027 AI-capex baseline |
| H2 2027 | (no fixed date — structural risk window) | The 2026–27 capex wave should be depreciating into earnings here, and the memory cycle is projected by broker research to peak. This is the real risk window for this specific option, not the next quarter. |
On price targets: per Investing.com's survey, the median 2026 year-end S&P 500 target across 19 firms is 7,850 (≈+5.5% from July 30's close). ⚠️ No major bank publishes a year-end Nasdaq-100 target — any NDX/QQQ level implied from S&P targets is inference, not consensus, since QQQ historically carries higher beta than the S&P.
👥 Four-Reader Interpretation
🎰 YOLO Trader
This isn't your trade to copy as-is — the size ($28M notional) is institutional, and replicating the short-put leg on margin at retail size is a fast way to blow up an account if QQQ ever revisits $600. If you want the bullish idea, buy a call outright (capped loss) rather than financing it by selling a naked put you can't comfortably hold to $600.
📈 Swing Trader
The near-term picture is about gamma and the Aug 21/Sep 18 implied-move windows (±5.6% / ±8.64%), not this 18-month structure. Watch the $685–$690 gamma wall for short-term pinning and the September 15–16 FOMC for the next volatility trigger.
💰 Premium Collector
The short $600 put itself is a recognizable premium-collection idea — 13% out-of-the-money, ≈18 months to expiration, $38.00 collected. If you like being long QQQ below $600, this is a legitimate way to get paid to wait for that entry. Just size it knowing the obligation is real and can grow larger than the premium collected if the index falls hard.
🌱 Beginner
The single most important lesson in this trade: a "$17M call buy" headline can hide a much smaller net commitment and a much larger hidden risk. Always ask two questions before reacting to a big options print — "is there a second leg?" and "what did they give up to pay for this?" Here, the answer to both mattered enormously.
⚠️ Risk Factors & Honest Limits
- ✅ Open vs. close is now proven on both legs — both opened. The August 3 pre-market OPRA snapshot resolved what the same-day tape could not: the $800 call built +2,753 contracts (≈92% of the print) and the $600 put built +721 (≈24%). This is a fresh synthetic long. The residual honest limit is size, not direction: ≈76% of the put leg was existing open interest changing hands, so the market-wide build in short $600 puts is much smaller than the 3,000-lot print implies.
- We cannot see whether this overlays an existing QQQ or NDX position. A risk reversal like this is a very common way to cheaply add upside to (or partially collar) an existing long portfolio. No equity block was found paired to this option package at the time of the cross, but that does not rule out a pre-existing, unhedged holding elsewhere in the trader's book — OPRA cannot show us broker identity, customer identity, or holdings outside the option tape.
- The short put's downside is not capped in any practical sense for a retail account. Below $600, losses scale with the size of the further decline; this is the single biggest risk in the structure and is not appropriate to copy at retail size without understanding margin and assignment mechanics.
- Fed policy is now a headwind, not a tailwind, for a 67%-technology, long-duration index. Three sitting FOMC members are on record wanting to hike, not cut.
- Capex is increasingly debt-funded across the hyperscaler complex, and Alphabet's first-ever negative quarterly free cash flow is a genuine yellow flag worth tracking into 2027.
- Gamma levels this far from expiration (Jan 2028) carry much less predictive weight than the near-dated levels shown on the chart — treat the gamma read above as a near-term (weeks) tool, not an 18-month roadmap.
- Options trading involves substantial risk of loss and may not be suitable for all investors. This analysis is for informational purposes and is not financial advice.
Compiled July 31, 2026. All figures sourced inline from the OPRA tape and the catalyst research file. Not investment advice.
Last updated: 2026-08-03 — next-day OPRA open interest confirmed both legs OPEN: $800 call 2,710 → 5,463 (+2,753); $600 put 4,092 → 4,813 (+721, ≈24% of print — the rest transferred).