🔄 QQQ $50M Deep-ITM Call Roll Banks $28.6M Credit — But Cuts Bullish Delta 60%
📅 August 4, 2026 | 🔥 Unusual Activity Detected
🎯 The Quick Take
At 10:32:02 ET, with QQQ trading at $715.51, one desk sold 19,075 deep-in-the-money Aug-07 $690 calls and simultaneously bought 19,075 Sep-04 $735 calls in a single package — a net credit of $28,612,500. The headline number looks like a bearish "dump," but the delta tells the real story: exposure fell from roughly 1,760,813 shares' worth of upside to roughly 709,972 — a 60% cut. This reads as a desk taking risk off, not turning bearish, and rolling the position up and out to catch the calendar's biggest event window: Aug 26, when PCE, GDP, and NVIDIA's (estimated) earnings could all land the same day — a date that falls after the old Aug-07 call expires but comfortably inside the new Sep-04 one.
🏢 About QQQ — Invesco QQQ Trust
QQQ is the ETF that tracks the Nasdaq-100 Index, the 100 largest non-financial companies listed on the Nasdaq. It's one of the most heavily traded funds in the world — $455.80B in assets, a 0.18% expense ratio, and 106 holdings (StockAnalysis QQQ).
The fund is top-heavy: top 10 holdings = 45.95% of the total, led by Apple (8.15%) and NVIDIA (7.86%) (StockAnalysis QQQ holdings). The feature that matters most for this trade is the semiconductor block — NVDA (7.86%) + Micron (4.53%) + AMD (3.64%) + Broadcom (3.06%) + Intel (2.10%) = ≈21.2% of the entire fund. Micron alone is now the #4 holding, ahead of Amazon, Alphabet, and Meta. That concentration is why QQQ realizes 2.19% daily volatility versus SPY's 1.34% (Finviz QQQ, Finviz SPY) — QQQ moves about 1.6x as much as the S&P 500 on an average day.
QQQ traded at $719.09, up +2.72% on the session, but still −3.95% below its 52-week high of $748.65 — even as SPY printed a record high the same day (Finviz QQQ). The fund is +6.45% over the past week clawing back a ≈9–10% mid-July drawdown, and +17.06% YTD (Finviz QQQ, StockAnalysis compare).
💰 The Option Flow Breakdown
📊 What Just Happened
- 🔻 SOLD 19,075 × Aug-07-2026 $690 Calls @ $26.44 → $50,434,300 collected
- 🔺 BOUGHT 19,075 × Sep-04-2026 $735 Calls @ $11.44 → $21,821,800 paid
- 💵 Net credit: $28,612,500 — both legs printed in the same second as multi-leg floor trades, negotiated on the exchange floor, not lit sweeps
| Time (ET) | Buy/Sell | Call/Put | Expiration | Strike | Option Price | Premium | Volume | Prior OI | Size | Spot | Option Symbol |
|---|---|---|---|---|---|---|---|---|---|---|---|
| 10:32:02 | SELL | CALL | 2026-08-07 | $690 | $26.44 | $50,434,300 | 23,000 | 36,346 | 19,075 | $715.51 | QQQ260807C690 |
| 10:32:02 | BUY | CALL | 2026-09-04 | $735 | $11.44 | $21,821,800 | 27,000 | 319 | 19,075 | $715.51 | QQQ260904C735 |
Flow tag: 🛠️ Multi-leg floor trade (negotiated, worked as one package on the exchange floor — not a sweep, not an algorithmic order hitting the lit book).
QQQ ticker page: ainvest.com/etf/NASDAQ-QQQ.
Structure: Sell a deep-in-the-money near-term call, buy a further out-of-the-money call at a higher strike and a later date, same package, same second. That's the textbook shape of a long call roll — up and out. The sold $690 call was ≈3.6% in the money (delta 0.9231); the bought $735 call is ≈2.7% out of the money (delta 0.3722).
✅ RESOLVED — The OI Snapshot Confirms the Roll
Updated 2026-08-05 pre-market. The ≈06:30 ET OPRA open-interest snapshot (reflecting the August 4 close) has published, and it settles the one open question in this article: the Aug-07 $690C sale closed an existing long position. The roll read holds. The "fresh short / net-short-delta" alternative is refuted.
| Leg | Baseline OI (Aug-4 snap) | Resolving OI (Aug-5 snap) | Δ | Print size | Verdict |
|---|---|---|---|---|---|
| Aug-07-2026 $690 C (sold) | 36,346 | 26,975 | −9,371 | 19,075 | ✅ CLOSE (STC) — was ⏳ provisional |
| Sep-04-2026 $735 C (bought) | 319 | 26,997 | +26,678 | 19,075 | ✅ OPEN (BTO) — as published |
Read the direction, not just the size. Open interest at the $690 strike fell by 9,371 contracts. Contracts can only be destroyed when the buyer and the seller are both closing — so this print unambiguously took existing positions off the board rather than creating new ones. The decline is smaller than the 19,075 print because part of the block matched against a counterparty who was opening (that pairing nets to zero new OI), but the sign is what matters, and it points one way only: this was a sell-to-close.
The $735 leg opened as expected and then some — OI rose 26,678 against a 19,075 print, meaning other buyers piled into the same strike alongside the roll.
Bottom line: the "still long, just smaller" framing in this article is confirmed. The package cut directional exposure from ≈1,760,813 share-equivalents to ≈709,972 while banking a $28.6M credit. It was de-risking, not a bearish turn.
🤓 What This Actually Means — Plain English
Here's the trap in this trade: if you only look at the dollar signs, $50.4M sold vs. $21.8M bought looks like someone is bailing on QQQ calls. That's the wrong read.
Order type, leg by leg (per the classifier and today's OI):
- Aug-07 $690C: SELL, confirmed STC (sell-to-close) — ✅ resolved by the next-day OI snapshot (OI fell 9,371; see the RESOLVED box above)
- Sep-04 $735C: BUY, confirmed BTO (buy-to-open) — proven new position
What a "roll up and out" actually is: think of it as swapping a winning lottery ticket that's about to expire for a new ticket with a later draw date and a bigger number on it — and getting cash back on the swap. The Aug-07 $690 call was deep in the money with only 3 trading days left; almost all of its value was pure intrinsic value (stock price minus strike), not time premium. By selling it now instead of letting it expire, the position captured that value in cash. Then it used part of that cash to buy a cheaper, longer-dated, higher-strike call — still bullish, still owning upside in QQQ, just with a smaller and more efficient bet.
Why a $28.6M credit can mean LESS risk, not a bearish turn: a deep-in-the-money call moves almost dollar-for-dollar with the stock (delta 0.9231 — essentially owning ≈92 shares of exposure per contract). An out-of-the-money call barely moves with the stock at first (delta 0.3722 — more like owning ≈37 shares of exposure per contract). Swapping 19,075 of the first kind for 19,075 of the second kind means the total directional exposure fell from ≈1,760,813 share-equivalents to ≈709,972 — a 60% reduction. They collected cash AND took risk off the table at the same time. That's the opposite of a bearish reversal; it's a disciplined manager locking in gains and re-sizing the bet smaller and further out, not someone running for the exits.
The caveat, now resolved: all of this rested on the Aug-07 $690C sale having closed an existing long position — the geometry-favored read, but not provable from the trade-day tape alone. The next-day OI snapshot confirmed it (open interest fell 9,371 at that strike; see the RESOLVED box above). The alternative — a fresh short that would have left the package carrying ≈1.05 million shares of net short near-term delta — is off the table. The de-risking-roll framing stands as written.
📈 Technical Setup / Chart Check-Up
YTD Chart
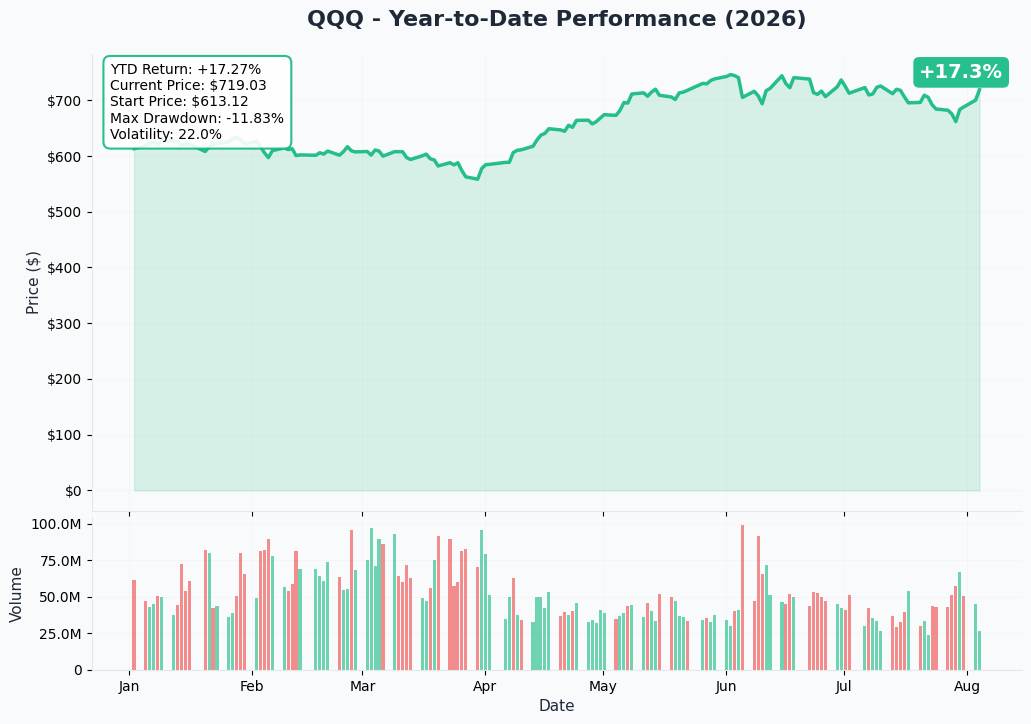
QQQ is +17.3% total return over the past year — a strong uptrend overall, but the last two months tell the real story: a violent ≈9–10% drawdown into mid-July, followed by a +6.45% five-session recovery that still hasn't reclaimed the 52-week high of $748.65 (Finviz QQQ). SPY, by contrast, already made a fresh record high the same day this trade printed (Finviz SPY). QQQ is playing catch-up, not leading.
Gamma-Based Support & Resistance
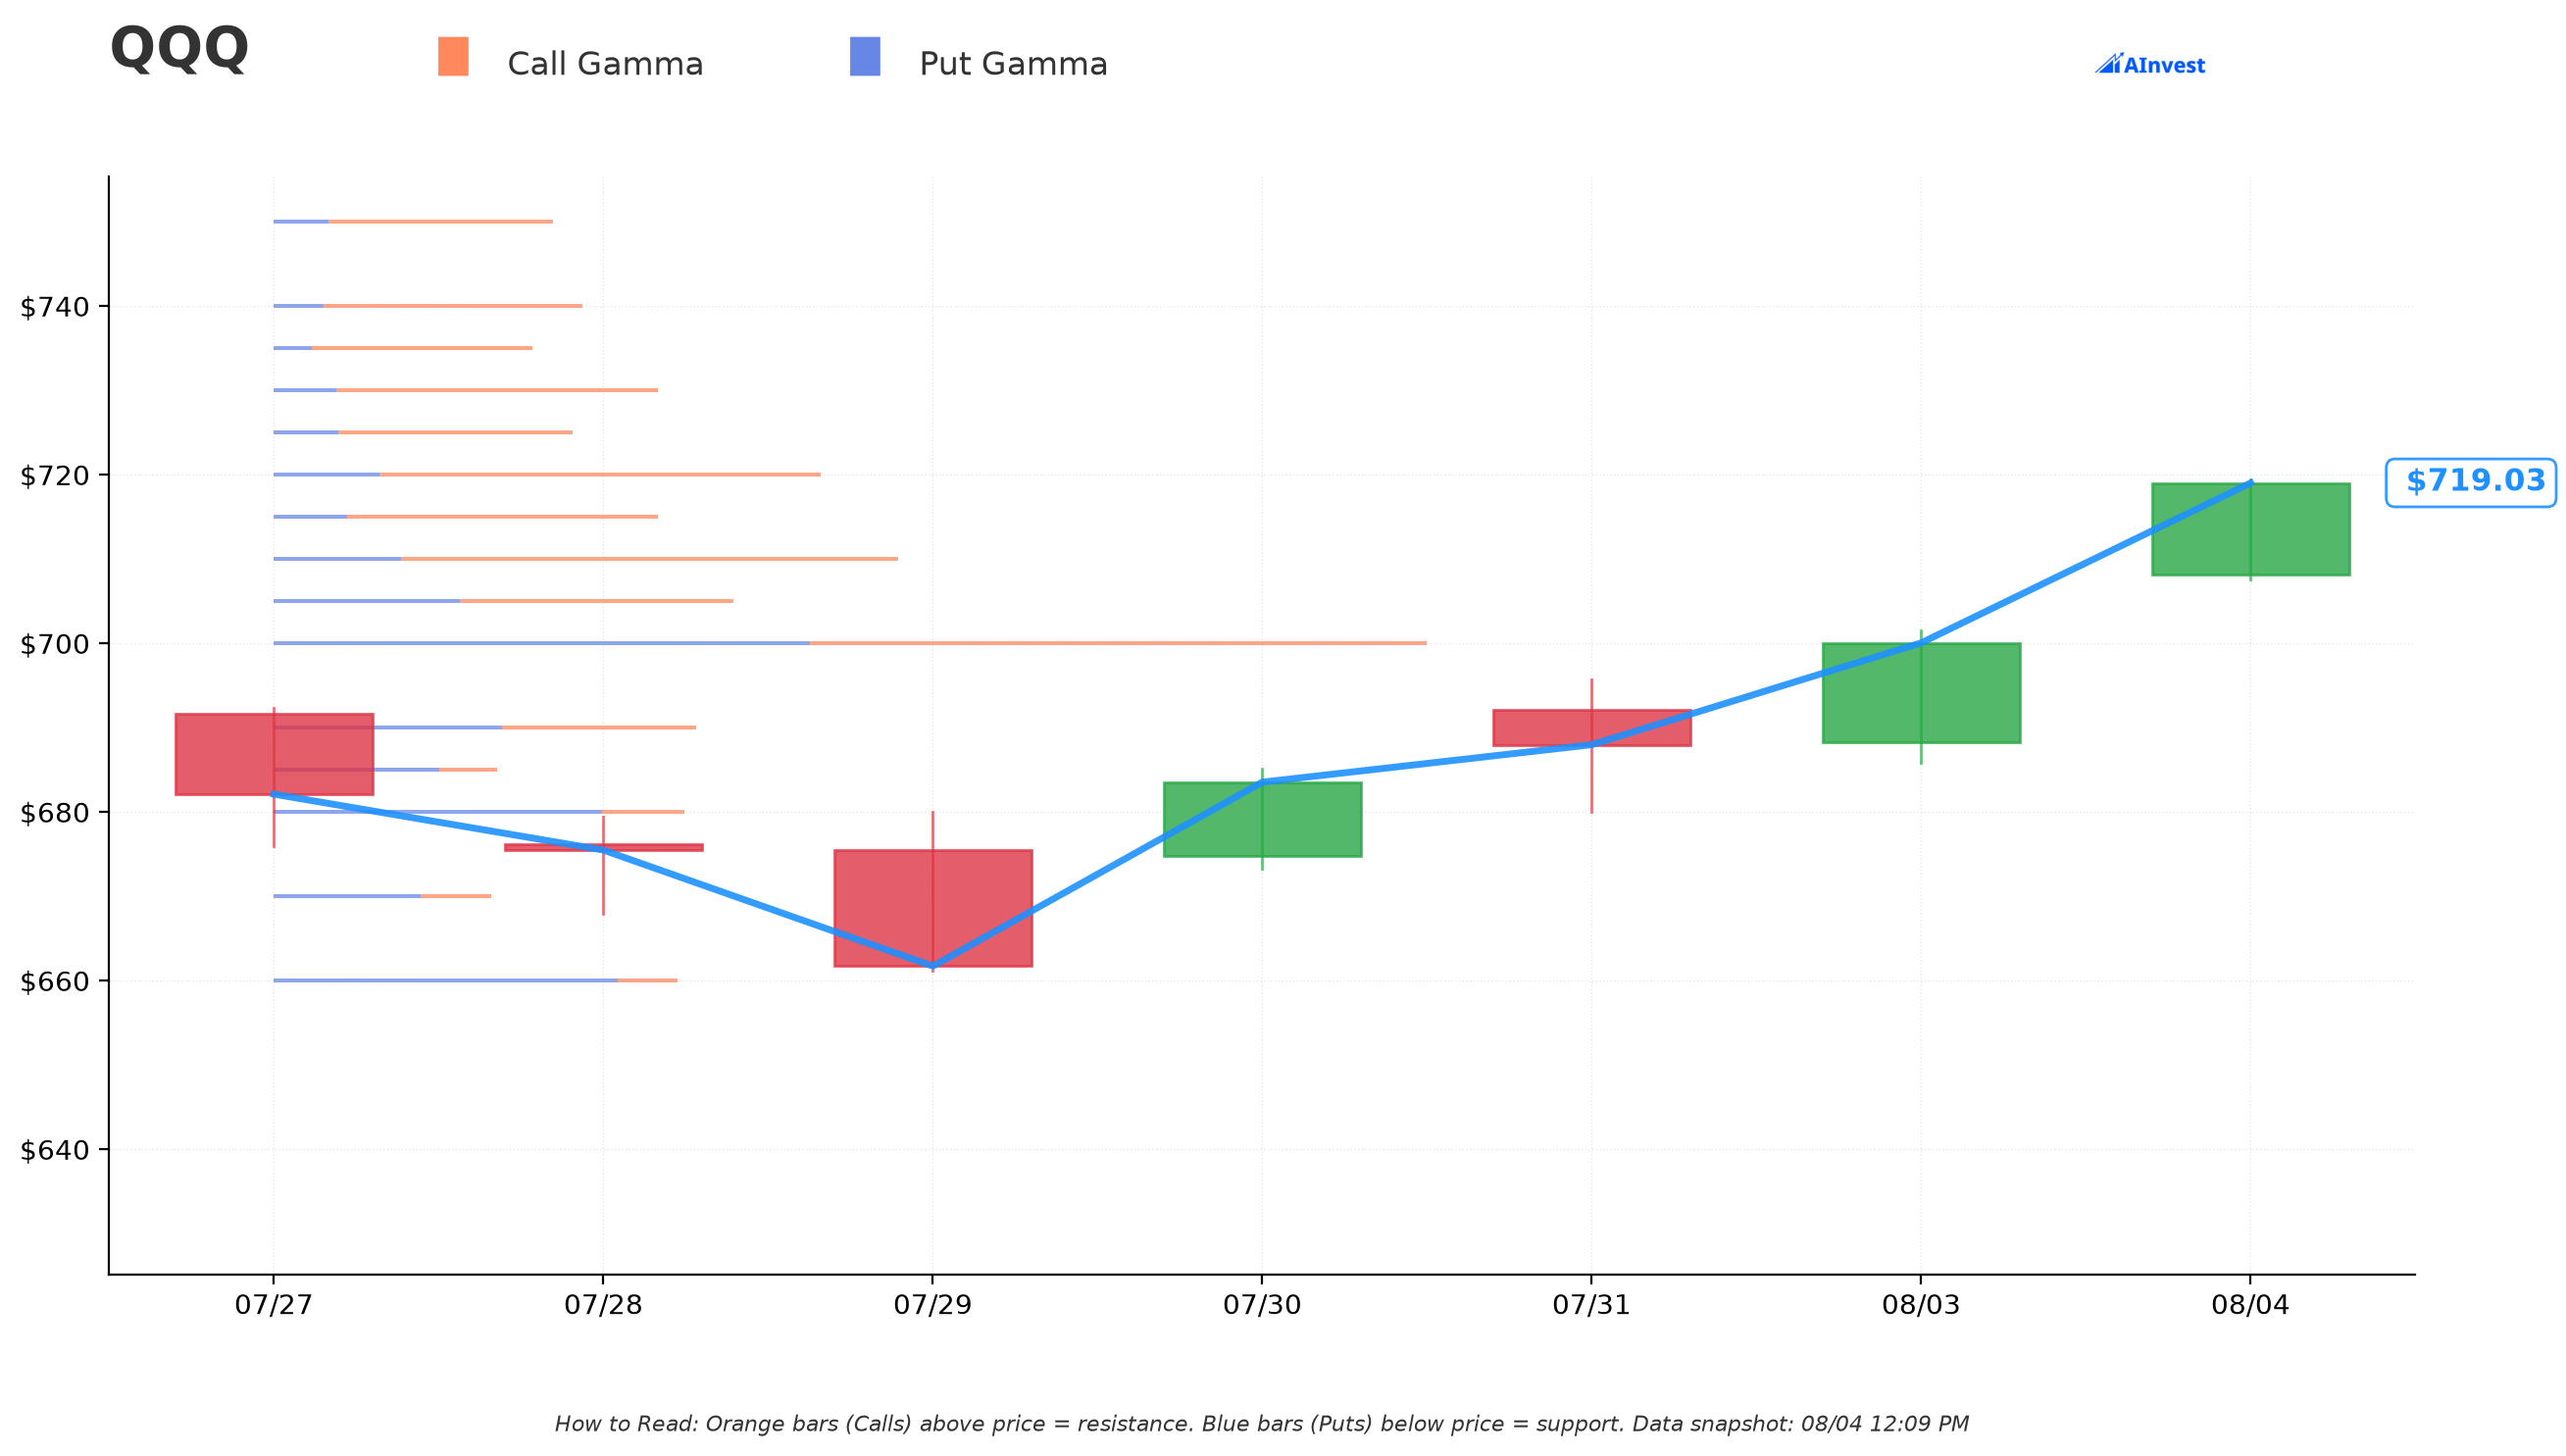
At a spot of $718.93, the options market is showing a wall structure that lines up almost perfectly with this trade's two strikes:
🟠 Resistance above (call-heavy walls):
- $720 — Very Strong, only 0.15% above spot. This is essentially a magnet/pin level right where the stock is trading.
- $735 — the new strike the desk just bought. Total gamma ≈$55.1M, call-side gamma ≈$46.9M, sitting ≈2.24% above spot. The new long call was placed almost exactly on top of a real resistance wall — if QQQ grinds up to test it, dealer hedging flows could help the move along.
- $750 — Very Strong, ≈4.32% above spot.
- $760 — Very Strong, ≈5.71% above spot.
🔵 Support below (put-heavy walls):
- $715 — Very Strong, essentially at spot (0.55% away).
- $710 — Very Strong, 1.24% below spot.
- $700 — Very Strong, the single largest support wall on the board (total gamma ≈$247.3M), 2.63% below spot.
- $690 — the strike the desk just sold out of. Total gamma ≈$90.6M, split nearly evenly between calls (≈$41.9M) and puts (≈$48.7M), sitting ≈4.02% below spot. Notably, the old strike they closed also sits right on a real gamma level — they didn't pick these numbers at random.
In plain English: dealer hedging flows tend to slow price down near big gamma walls (like $700, $710, $715, $720) and can accelerate moves once a level breaks. The roll moved this position's strike from one wall ($690, now support) to another ($735, now resistance) — betting the stock keeps working through the ladder rather than reversing hard.
Implied Move
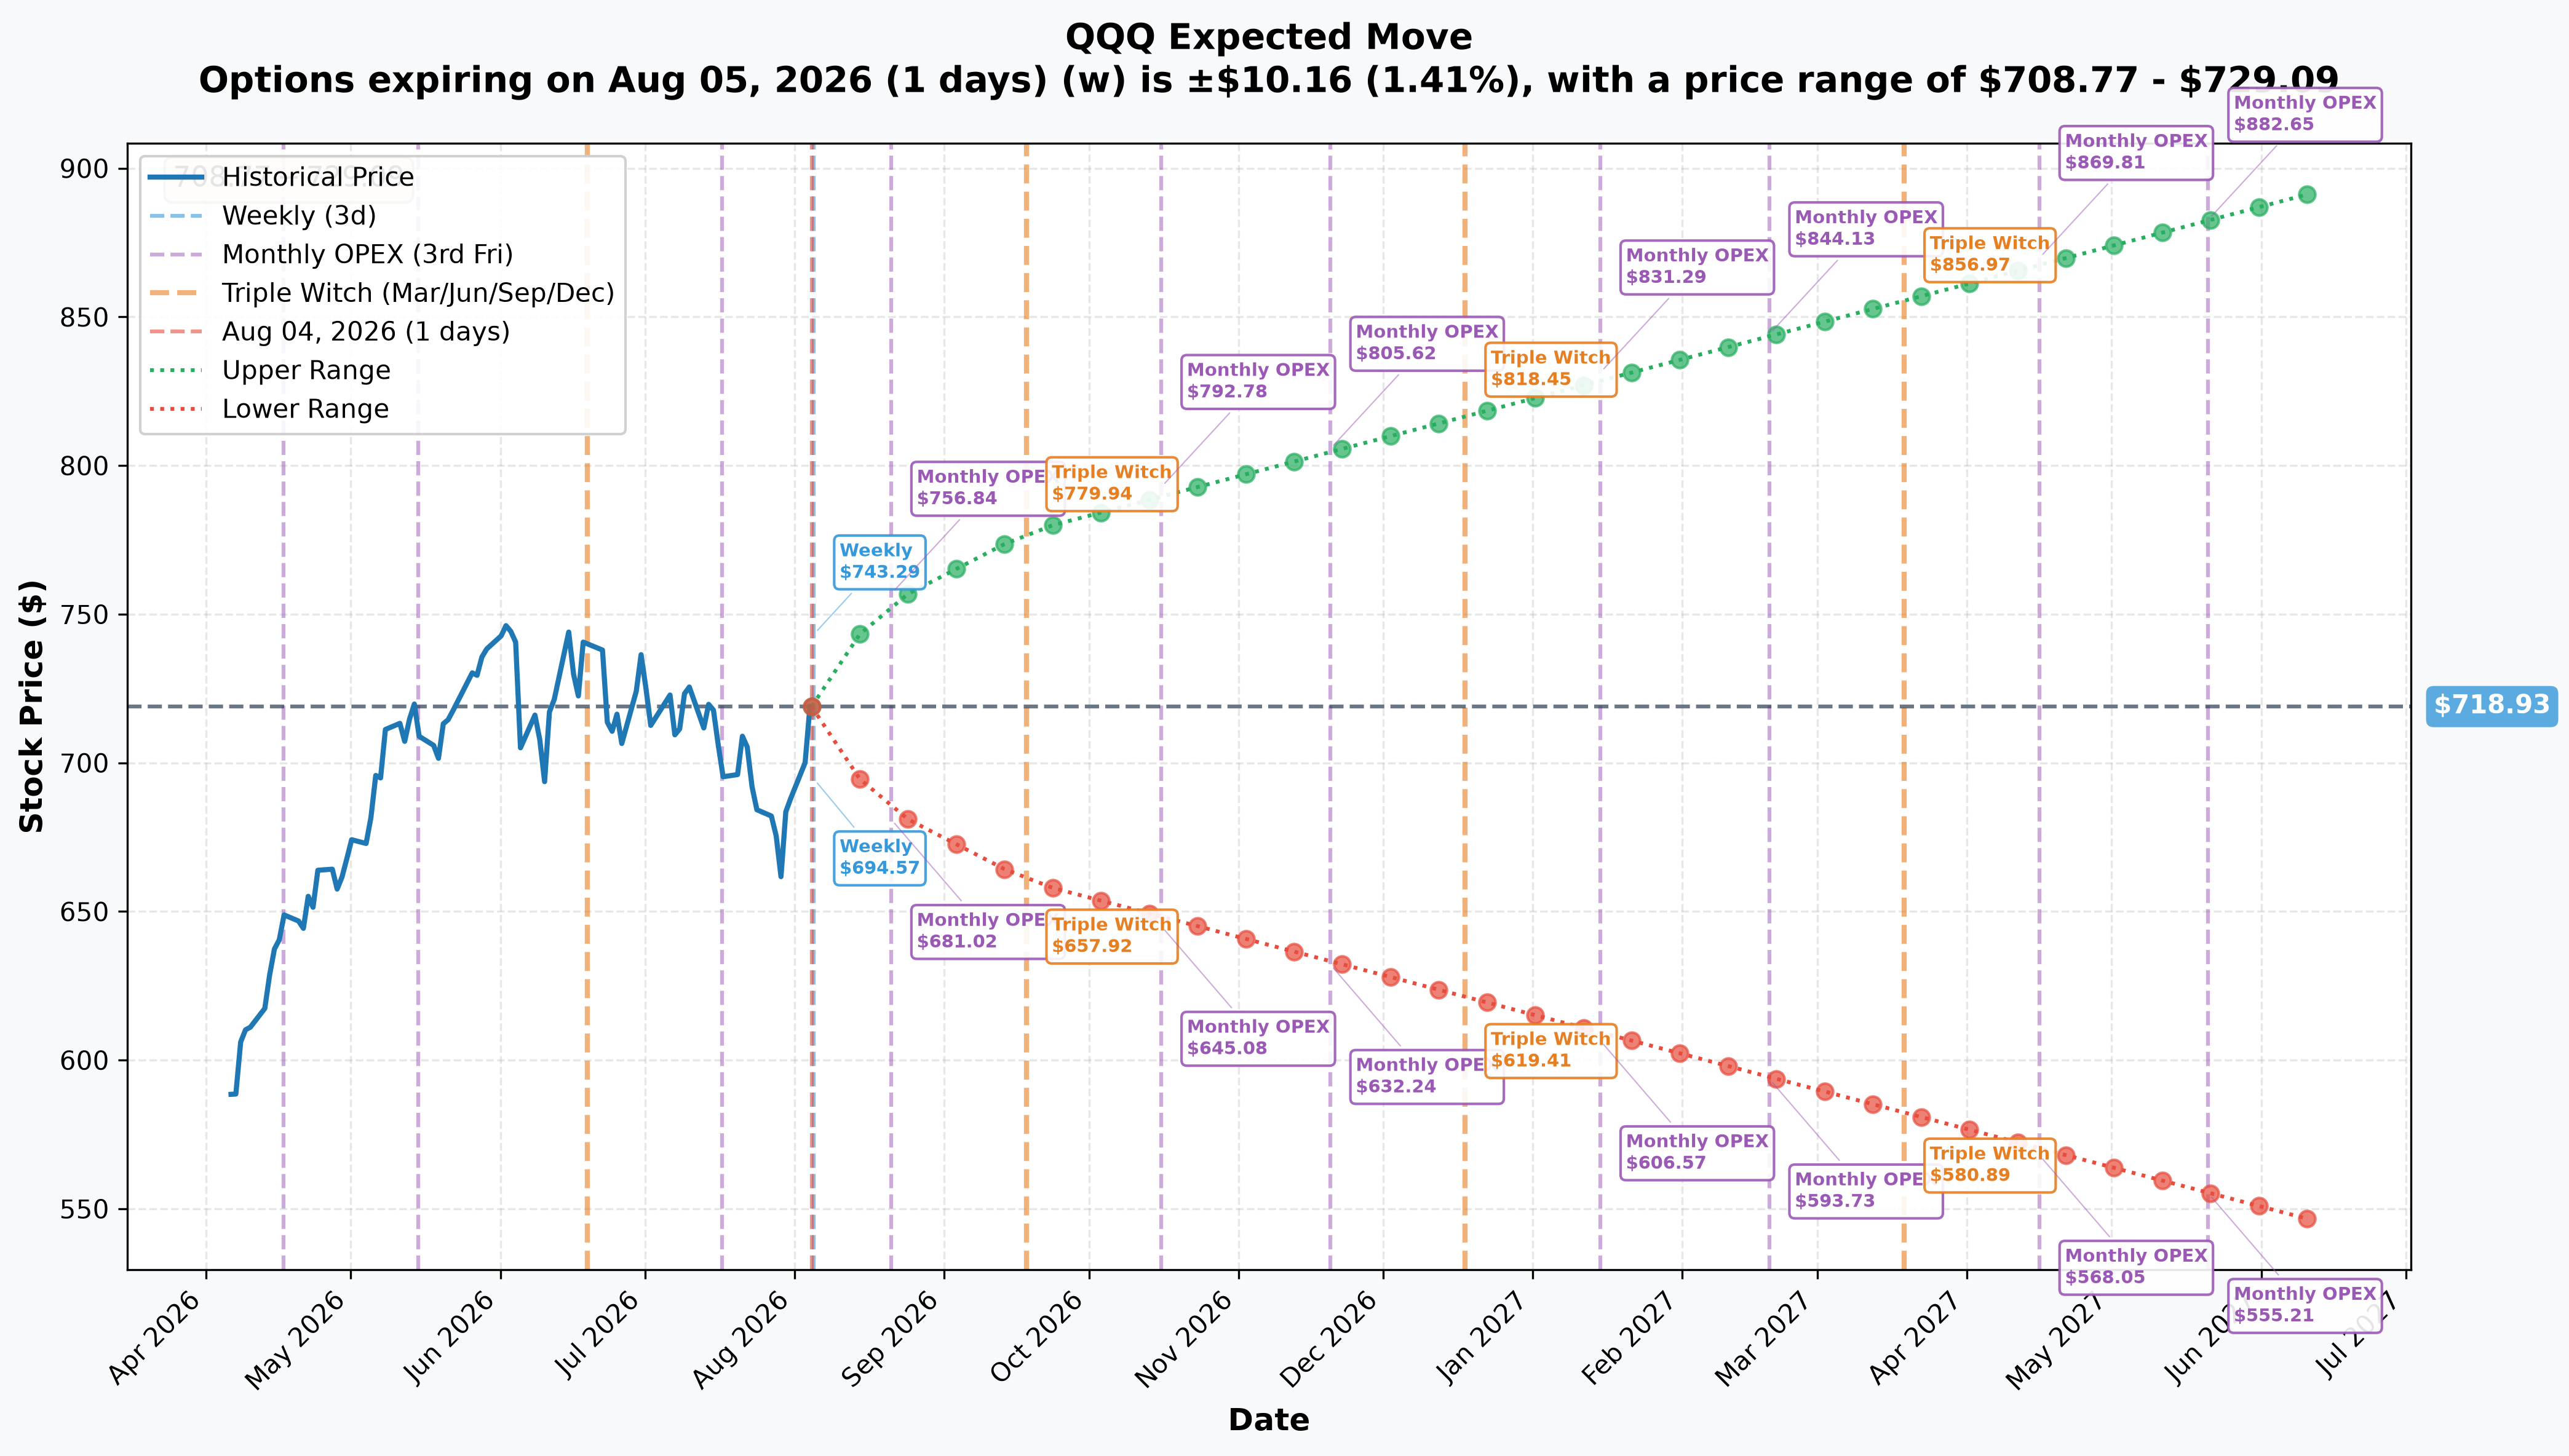
Pulled from quote-midpoint implied volatility as of August 4, spot $718.93:
| Expiry | Days | Implied Move | Range |
|---|---|---|---|
| Weekly (Aug 5) | 1 | ±1.41% (±$10.16) | $708.77 – $729.09 |
| Monthly OPEX (Aug 21) | 17 | ±4.92% (±$35.40) | $683.53 – $754.33 |
| Triple Witch (Sep 18) | 45 | ±8.19% (±$58.87) | $660.06 – $777.80 |
| LEAPS (Jun 17, 2027) | 317 | ±24.38% (±$175.27) | $543.66 – $894.20 |
The old Aug-07 leg (3 trading days out) sat inside the tightest part of this cone — barely more room than the weekly ±$10 range. The new Sep-04 leg (31 days out) sits between the monthly and quarterly readings above, meaning the market is pricing something in the neighborhood of ±5–6% of movement by then — call it roughly $680–$758 as a rough interpolation. The new $735 strike sits well inside that cone, not at its edge — this is a call bought with real room to work, not a lottery ticket priced at the tail.
Breakeven on the new leg by itself, ignoring the credit banked from the roll: $735 + $11.44 = $746.44 (+3.83% from the current $718.93). But because the roll collected $15.00 per contract more than it cost to buy the new call ($26.44 sold − $11.44 bought), the desk is already ahead on today's swap regardless of where QQQ finishes — worst case, the new call expires worthless and they still keep the $28.6M net credit; best case, QQQ keeps climbing past $746.44 and the new call adds further profit on top.
🎪 Catalysts
Already Happened (Last 3 Months)
The mega-cap earnings cluster that shook QQQ landed inside a nine-day window: Alphabet reported July 22 (revenue $119.80B beat), Microsoft and Meta both reported July 29 (MSFT beat; Meta missed EPS at $6.18 vs. $7.19 estimate), and Apple and Amazon both reported July 30 (Amazon revenue $200.61B beat). The Meta miss sits right in the middle of QQQ's mid-July drawdown window — a plausible trigger, though the causal link is inferred, not confirmed.
The Fed held rates at 3.50%–3.75% on July 29 for a fifth straight meeting — with three members dissenting in favor of a 25bp HIKE. This is not a rate-cut story; the market is currently pricing hike risk, not cut risk.
Upcoming (Next 6 Months)
- Friday, August 7 — July jobs report (TradingEconomics calendar). This is the day the old Aug-07 $690 call expired — the roll moved the position past this event entirely, with zero time left to react to the number.
- Wednesday, August 12 — July CPI and Thursday, August 13 — July PPI (TradingEconomics calendar), both now captured inside the new Sep-04 window.
- Wednesday, August 19 — FOMC minutes (TradingEconomics calendar).
- ⭐ Wednesday, August 26 — the big one. PCE inflation and the GDP second estimate are both confirmed for this date, and it's also the estimated (not company-confirmed) date for NVIDIA's next earnings report (MarketBeat NVDA) — NVIDIA is QQQ's #2 holding at 7.86%. This date falls after the old Aug-07 call died and squarely inside the new Sep-04 call's window. That's the calendar math this roll bought.
- August 27–29 — Jackson Hole Symposium (TradingEconomics calendar), the day right after the estimated NVIDIA print.
- Friday, September 4 — August jobs report (Investing.com NFP), landing the same day the new call expires.
- September 15–16 — the next FOMC meeting (federalreserve.gov), just outside the Sep-04 expiry but visible on the horizon. The market currently prices ≈81% cumulative odds of at least one hike by December (Investing.com Fed Rate Monitor) — a genuine headwind for a 32.82 P/E index like QQQ.
👥 How Different Traders Might Read This
🚀 YOLO Trader: The dollar sign says $50M sold and screams "sell everything." It's wrong. This isn't a signal to short QQQ. If anything, the new leg — a $735 call bought outright, 2.7% out of the money, expiring Sep-04 — is the tradeable idea here, and it's already sized to a much smaller bet than the position it replaced. Don't chase the premium sale side; that part just banked profit and got smaller.
⚖️ Swing Trader: The interesting level is $735 — it's both the new strike and a real gamma resistance wall (≈$55M total gamma, ≈2.24% above spot). A break and hold above $720 (the nearest, strongest wall) with follow-through toward $735 lines up with both the option flow and the gamma structure. The Aug-26 NVDA/PCE/GDP stack is the event to watch — it's exactly what this roll was built to survive.
💰 Premium Collector: This trade is a good reminder that selling deep-in-the-money calls for cash isn't automatically bearish — it's often just monetizing a winning position before time value evaporates. If you're running your own covered-call or credit strategies on QQQ, the fact that the $700, $710, $715, and $720 strikes all carry "Very Strong" gamma right now suggests premium near those levels may be pinned rather than freely moving — plan strikes accordingly.
🌱 Beginner: Two big lessons here. First: dollar amount alone doesn't tell you direction — you have to look at delta (how much the position actually moves with the stock), and here delta fell 60% even though cash came in. Second: open interest, not size, decides open vs. close — half of this trade is proven new money, the other half is genuinely unknown until tomorrow's official update. When in doubt, wait for confirmation instead of reacting to a headline number.
⚠️ Risk Factors & What The Tape Cannot Prove
- Open vs. close on the Aug-07 $690C is not proven. As explained above, this is the single biggest unresolved question in this trade, and it flips the entire interpretation (de-risking roll vs. new net-short diagonal) depending on how it resolves.
- This was a diagonal roll, not a simple vertical spread — there's no single clean breakeven or max-loss number for the combined package. The two legs have different strikes and different expirations, so standard spread math (max profit = strike width, etc.) doesn't apply cleanly here. The "worst case they keep the $28.6M credit" framing above applies only to today's swap in isolation, not to any pre-existing position they may still be carrying.
- We cannot see who did this or why. OPRA data shows the trade, not the trader — no broker, no account type, no stated intent, and no visibility into any other hedges (stock, futures, other options) this desk might be running elsewhere.
- Concentration risk is real and mechanical for QQQ. ≈21.2% of the fund sits in five semiconductor names, and the Aug-26 NVIDIA date this roll is positioned around is not even company-confirmed (MarketBeat NVDA) — both the timing and the magnitude of that catalyst carry genuine uncertainty.
- A hiking Fed against a 32.82 P/E is a real headwind, not a tailwind — don't read this trade, or QQQ's recent bounce, as a signal that rate risk has gone away.
- This is one print on one day. It tells you what one desk did with 19,075 contracts on each leg — it is not a signal about where QQQ is headed, and it should not be copied as a trade idea without your own risk assessment.
This article is for informational purposes only and does not constitute investment advice. Options trading involves substantial risk of loss and is not suitable for all investors. The open/close status of the Aug-07 $690C leg is provisional pending next-day open interest confirmation — check back for updates. Past performance and options flow do not guarantee future results.
Last updated: 2026-08-05 — next-day OPRA open-interest resolution added: Aug-07 $690C confirmed CLOSE (STC); the de-risking-roll read holds.