🛡️ QQQ $13.96M Long-Dated Put — A Desk Buys Portfolio Insurance Into 2027
📅 August 10, 2026 | 🔥 Unusual Activity Detected
🎯 The Quick Take
At 10:13:03 ET, a desk paid $13.96M to buy 2,500 March-19-2027 $745 puts on the Invesco QQQ Trust at $55.84 each, with QQQ trading around $724.30. The print crossed as a negotiated floor block — a known counterparty, no urgency, no panic. This is not a bet that the market crashes tomorrow. It's the signature of someone with a large equity book buying protection that runs through the next seven-plus months, paying real money every day to carry it.
📊 Fund Overview
Invesco QQQ Trust, Series 1 (QQQ) tracks the Nasdaq-100 Index (NDX) — the 100 largest non-financial companies listed on Nasdaq, 106 holdings in practice once multi-share-class names like Alphabet are counted twice. NDX closed at 29,710.33 on August 10, 2026, down 0.04% on the day.
Key stats:
- AUM: ≈$480B (two independent sources converge on $479.19B–$480.22B)
- Expense ratio: 0.18%
- P/E ratio: 33.05
- 1-year total return: +26.51%
- 52-week range: $555.60 – $748.65
- All-time closing high: $745.34 on June 2, 2026 — notice that number, it matters below
Top 10 holdings (45.95% of the fund):
| # | Ticker | Company | Weight |
|---|---|---|---|
| 1 | AAPL | Apple | 8.15% |
| 2 | NVDA | NVIDIA | 7.86% |
| 3 | MSFT | Microsoft | 5.58% |
| 4 | MU | Micron Technology | 4.53% |
| 5 | AMZN | Amazon.com | 4.22% |
| 6 | AMD | Advanced Micro Devices | 3.64% |
| 7 | GOOGL | Alphabet Class A | 3.23% |
| 8 | AVGO | Broadcom | 3.06% |
| 9 | GOOG | Alphabet Class C | 3.03% |
| 10 | META | Meta Platforms | 2.66% |
Nearly half of a $480B fund sits in ten names, and semiconductors alone (NVDA + MU + AMD + AVGO + INTC) make up ≈21% of the total. That concentration is exactly what turned a chip-led selloff into a 10.1% index correction in late July 2026 — the mechanism a long-dated hedge like this one is built to survive.
💰 The Trade in Plain English
Someone bought 2,500 put contracts at the $745 strike, expiring 2027-03-19 — a standard quarterly (quad-witching) expiration, not a special date. With QQQ at $724.30 at the time of the print, that put strike is already $20.70 in the money. The buyer paid $55.84 per contract, so $35.14 of that price is pure time value — the cost of carrying the right to sell QQQ at $745 for the next ≈7.3 months (221 calendar days), regardless of where the market goes.
Split across all 2,500 contracts, the $13.96M premium breaks down to ≈$5.18M of intrinsic value and ≈$8.79M of time value — meaning more than 60% of what was paid is the actual cost of the insurance, not money that already existed because the put is in the money.
Full trade details:
| Field | Detail |
|---|---|
| Time | 10:13:03 ET |
| Ticker | QQQ |
| Buy/Sell | BUY |
| Call/Put | PUT |
| Expiration | 2027-03-19 |
| Strike | $745 |
| Premium | $13.96M |
| Volume | 2,500 |
| Prior OI | 962 |
| Size | 2,500 |
| Spot | $724.30 |
| Option Price | $55.84 |
| Option Symbol | QQQ20270319P745 |
| Order Type | BTO (Buy to Open) |
| Strategy | Long Put — Long-Dated Portfolio Hedge |
Mechanism: 🤝 This printed as a floor block — manually negotiated on an exchange floor with a known counterparty on the other side, not a lit sweep. There's no urgency here; nobody was chasing an offer. A desk simply worked out a price for size with a facilitating counterparty. Treat this as a deliberate, planned transaction, not a reaction to breaking news.
✅ RESOLVED — The Open Confirmed, at the Top of the Predicted Range
Updated 2026-08-11 pre-market. Resolving OPRA snapshot timestamped August 11 (reflects the August 10 close); baseline is the August 10 snapshot (reflects August 7 — before these prints).
| Leg | Baseline (Aug-10) | Resolving (Aug-11) | Δ | Print size | Δ as % | Day vol | Our published prediction | Verdict |
|---|---|---|---|---|---|---|---|---|
| Mar-19-2027 $745 put (bought) | 962 | 3,532 | +2,570 | 2,500 | +102.8% | 2,789 | 2,500–3,462 | ✅ OPEN (BTO) — above the range |
We predicted 2,500 to 3,462; it printed 3,532. The result lands just above the top of the published range, which answers the precise question we said the tape could not: none of the pre-existing 962 contracts was recycled into this trade. Open interest rose 2,570 against a 2,500-lot purchase — more than 100% of the print — so today's buying was fully incremental, and a small amount of additional flow opened at the same strike on top of it.
What that means for sizing the position. We could prove only 1,538 contracts were new from the trade-day tape and asked readers not to treat anything more precise as fact. The snapshot now supports the full number: the $745 March-2027 put line went from 962 to 3,532, and the 2,500-lot purchase is genuinely new portfolio insurance, not a transfer of someone else's hedge.
🤓 What This Actually Means — Plain English
A 7-month, already-in-the-money put is not a lottery ticket — it's an insurance policy, and this is what that insurance actually costs.
Here's the mechanics: a weekly or monthly put you see in most unusual-activity flow is usually a speculative bet on a specific near-term catalyst — it's cheap, it decays fast, and if the move doesn't happen in days or weeks, it's worthless. This trade is structurally different. The buyer chose a strike that's already below the money ($745 vs. spot $724.30) and a date seven-plus months out. That combination — deep-ish intrinsic value plus a long runway — is the classic shape of portfolio insurance, not a directional short bet.
Why would anyone do this instead of just selling stock? A few reasons institutions actually use:
- 🏦 Tax and rebalancing costs. Selling a large, appreciated equity book (individual stocks or an index-tracking basket) can trigger capital gains and disrupt a portfolio's target allocation. Buying a put keeps the underlying exposure intact while capping the downside.
- ⏱️ Time-bounded conviction, not permanent bearishness. A 7.3-month put says "I want to be protected through a specific stretch of calendar," not "I think this asset is broken forever." Once that window passes (or the risk resolves), the hedge rolls off or gets rolled.
- 💸 Known, upfront cost vs. unknown downside. The buyer knows exactly what the insurance costs today — $13.96M — instead of an open-ended risk of losing much more if the market drops sharply and they stayed unhedged.
- 📉 Convexity. A single dollar of premium buys leveraged downside protection — far more efficient than trying to short an equivalent notional amount of index futures or ETF shares, which requires margin and carries unlimited theoretical risk on the short side.
The cost of carrying this insurance is the $35.14 of time value — roughly $0.16 per contract per calendar day if you spread it evenly (it doesn't decay evenly; time decay accelerates as expiration nears). That's the price of sleeping better through whatever the next seven months bring.
One evenhanded note: this is one desk's hedge, sized to whatever equity exposure they're carrying — it is not a market forecast. A single $13.96M put purchase, even a genuinely new one, tells us almost nothing about what "smart money" collectively believes will happen to the Nasdaq-100. Treat it as a data point about one participant's risk management, not a crystal ball.
📈 Technical Setup
YTD Performance
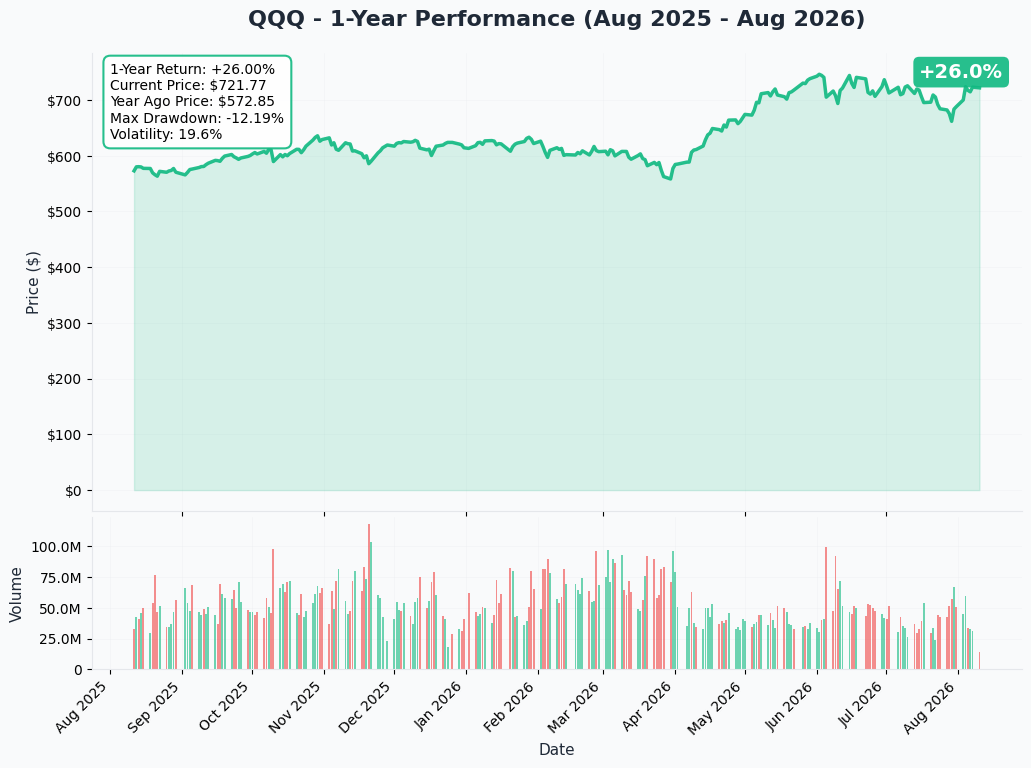
QQQ set an all-time closing high of $745.34 on June 2, 2026 — notice that's almost exactly the strike this put buyer chose. The fund then fell into its second 10%+ correction of 2026 by July 29 (semiconductor-led), before bouncing back to $723.39 by August 10, within ≈3% of the record. On August 6 alone, QQQ took in $3.16B in new money — the single largest ETF inflow day in the US that day — a sign dip-buying is real, even as the put buyer hedges.
Gamma-Based Support & Resistance
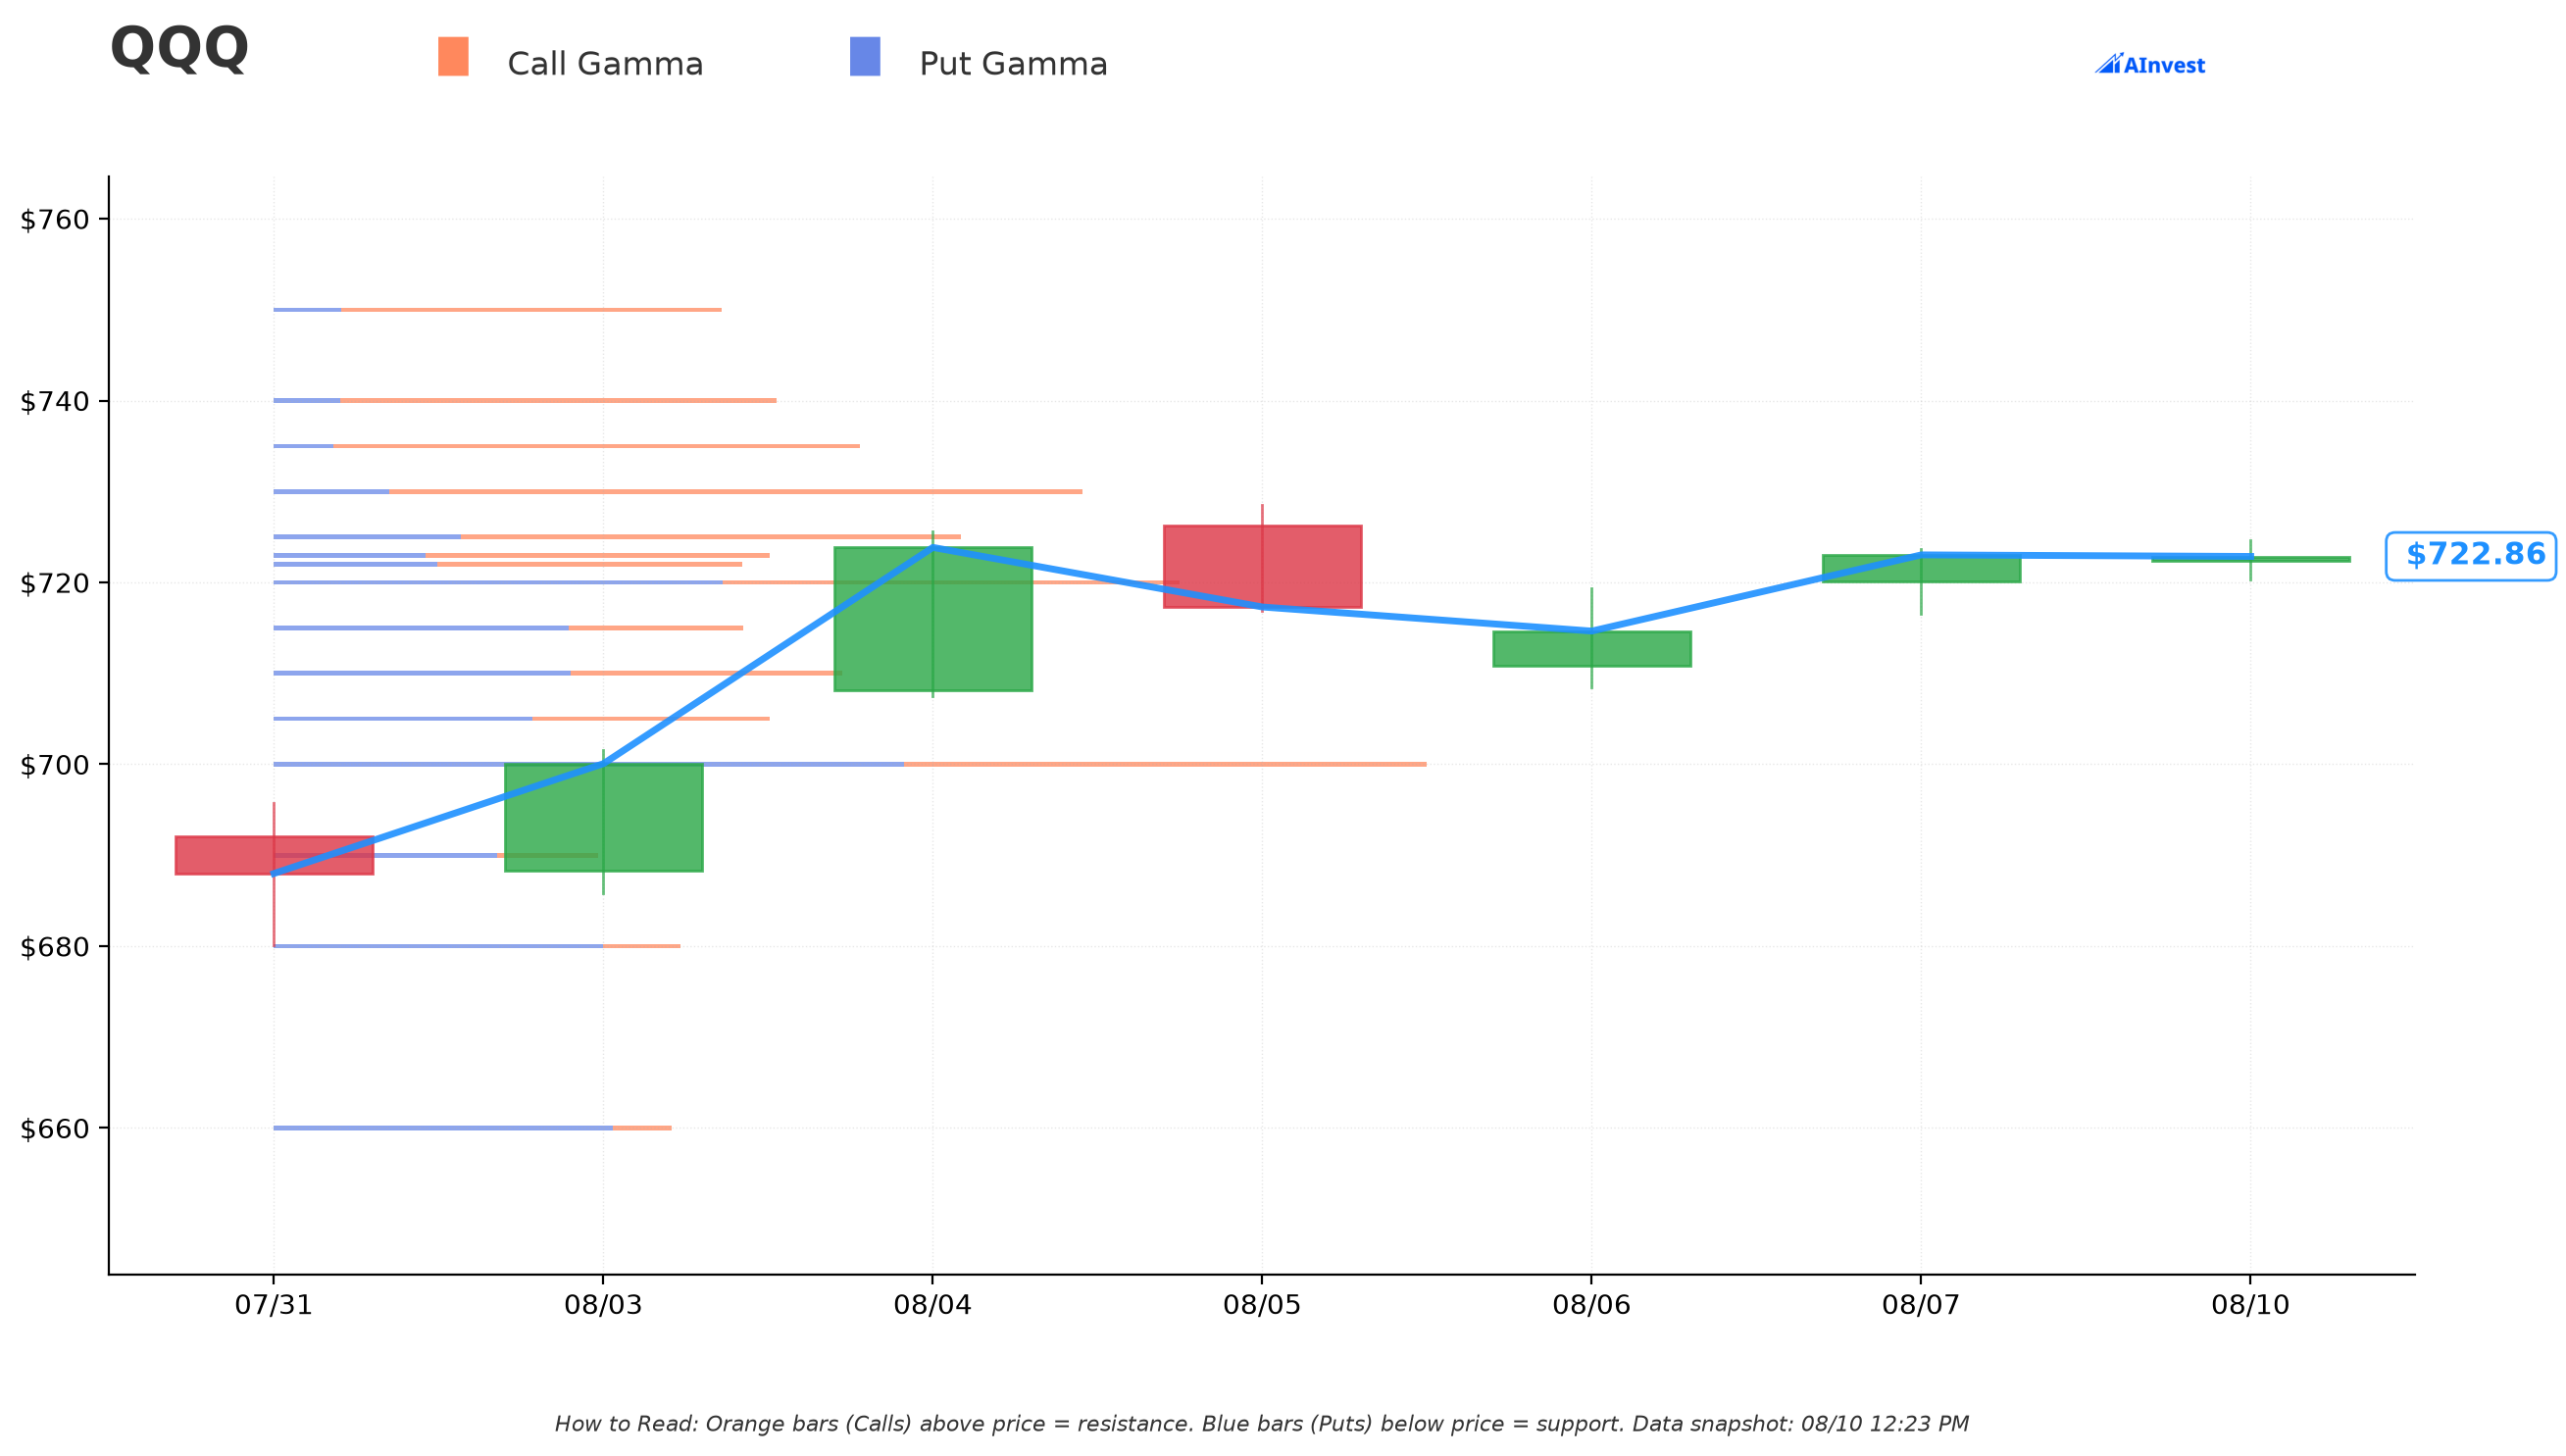
With QQQ around $723, the options market's dealer-hedging map shows:
🔵 Support below spot:
- $720 — Very Strong support (180.8B total gamma), essentially at-the-money
- $710 — Very Strong (113.8B)
- $700 — the single strongest support level on the board (230.7B total gamma, put-gamma dominant)
🟠 Resistance above spot:
- $725 — Very Strong resistance (137.8B), right at spot
- $730 — the single strongest resistance level nearby (161.5B, call-gamma dominant)
- $745 — a real resistance wall (36.8B total gamma, 88% of it call gamma) — this is the exact strike of today's put trade, and it's also almost precisely QQQ's June 2 all-time high. Dealers already see this level as a magnet from call positioning; the new put open interest here adds a second reason the strike matters.
What this means for traders: QQQ is boxed between very strong dealer support at $700–$720 and very strong resistance at $725–$730. The $745 strike where this hedge sits is a full resistance wall away from current price — the buyer isn't protecting against a routine pullback, they're protecting against a move back toward, or below, levels the index hasn't traded at with any real base since earlier this year.
Implied Move
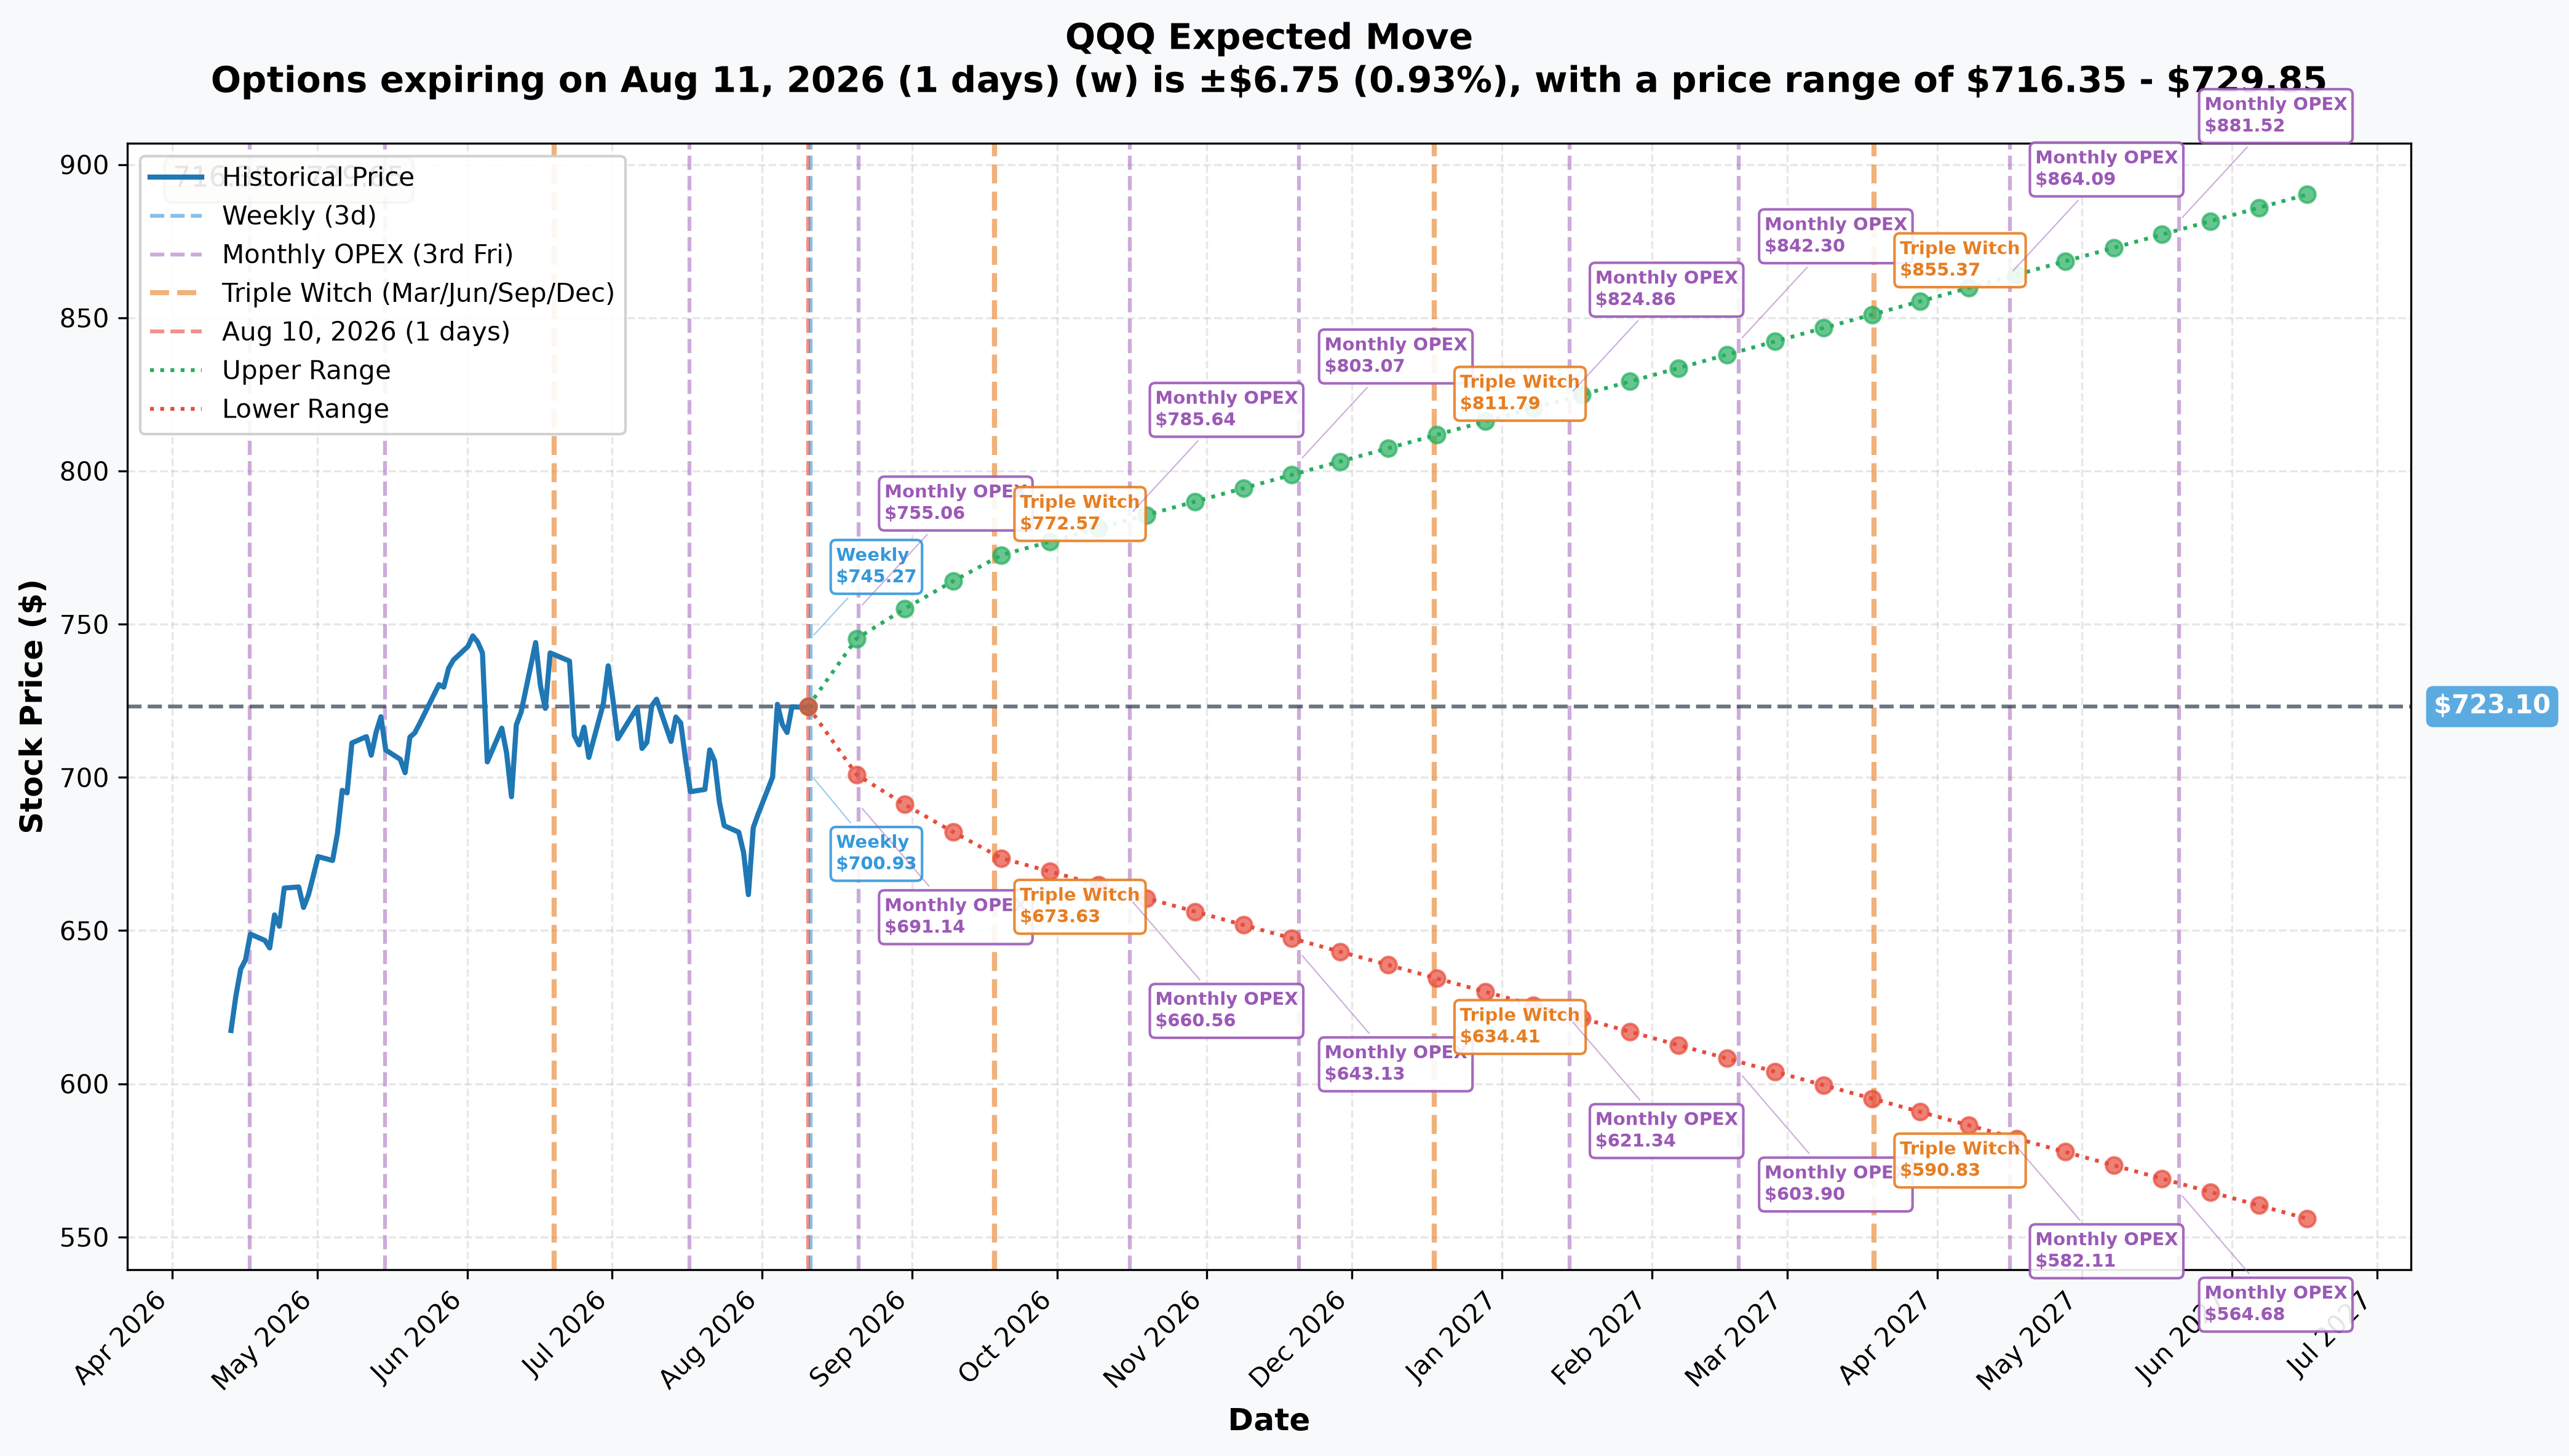
The options market is pricing these expected ranges from today's spot (≈$723):
- Weekly (Aug 11, 1 day): ±0.93% → $716.35 – $729.85
- Monthly OPEX (Aug 21, 11 days): ±3.3% → $699.22 – $746.98
- Quarterly Triple Witch (Sep 18, 39 days): ±6.78% → $674.07 – $772.13
- At this trade's own expiration (Mar 19, 2027, ≈221 days): the implied range is ≈$590.83 to ≈$855.37
That last number is the important one: by the time this put expires, the market's own pricing implies QQQ could plausibly land anywhere in a roughly $591–$855 band. The $745 strike sits well inside that range, only modestly above today's spot — this isn't a strike priced for a black-swan crash, it's a realistic, moderately-out-of-the-money level for a hedge sized to last the better part of a year.
🎪 Catalysts
Important distinction: the March 19, 2027 date is this position's deadline, not an event. Nothing happens to the market because the option expires — what matters is which real-world catalysts land before that deadline. Below are the confirmed and expected events between now (August 10, 2026) and expiration.
🔥 Already happened (context for the hedge)
- June 17, 2026 FOMC: The Fed's 2026 median dot rose from 3.4% to 3.8% — flipping the committee's own projection from implying a cut to implying a hike, per StockTitan's recap and InvestingLive.
- July 29, 2026 FOMC: Held rates, but voted 9–3, with three dissents (Hammack, Kashkari, Logan) favoring a hike, per the Federal Reserve's own statement. Per Fox Business, fed-funds futures priced a 57.2% probability of a 25bp hike at the next meeting. This is the single most under-appreciated fact behind any long-dated QQQ hedge right now: the market's modal expectation for the Fed's next move is a hike, not a cut.
- July 29, 2026: Nasdaq entered its second correction of 2026, down 10.1% from the June 1 high — a semiconductor-led selloff, per The Motley Fool.
📅 Inside the hedge's window (Aug 2026 – Mar 2027)
| Date | Event | Why it matters |
|---|---|---|
| Aug 12, 2026 | July CPI | First test of whether June's cooling trend holds, per the BLS release schedule |
| Aug 26, 2026 | July PCE + NVIDIA Q2 FY2027 earnings | NVIDIA is 7.86% of QQQ — the largest single-name event in the window, per MarketChameleon |
| Aug 27–29, 2026 | Jackson Hole Symposium | Fed Chair Warsh scheduled to speak; expected to signal whether September brings a hike |
| Sep 15–16, 2026 | FOMC + Summary of Economic Projections | The highest-probability regime-shift meeting in the window — 57.2% hike odds as of late July |
| Oct 27–28, 2026 | FOMC | No SEP |
| Nov 3, 2026 | US midterm elections | 435 House seats + 35 Senate seats, per Wikipedia |
| ≈late Oct 2026 | Mega-cap Q3 earnings (unconfirmed dates) | Second test of the capex-vs-cash-flow question that hit Alphabet and Meta in Q2 |
| Dec 8–9, 2026 | FOMC + SEP | Sets the 2027 dot plot |
| Dec 18, 2026 | Nasdaq-100 annual reconstitution effective | Mechanical index flows through a ≈$480B tracker, per the Nasdaq-100's Wikipedia entry |
| Jan 26–27, 2027 | FOMC | First meeting after the new Congress is seated |
| ≈late Jan–early Feb 2027 | Mega-cap Q4 earnings + first 2027 capex guidance (unconfirmed dates) | The AI-cycle verdict: does 2027 capex escalate or plateau? |
| Mar 16–17, 2027 | FOMC + SEP | Lands just 2–3 days before this position's expiration |
Then, separately: March 19, 2027 — the option's expiration, not a catalyst.
This window covers five FOMC decisions (three with a full Summary of Economic Projections), eight CPI prints, a national election, and roughly two full mega-cap earnings cycles. A hedge sized to this date spans the entire arc from "does the Fed actually hike in September?" to "does AI capex keep escalating into 2027?" — arguably the two questions that explain most of QQQ's volatility this year.
👥 Four-Reader Interpretation
🎰 YOLO Trader
This isn't your trade to copy directly — a $13.96M institutional hedge isn't a signal to buy puts and wait. But if you want directional exposure to the same "Fed surprises hawkish" thesis with much smaller size, a short-dated put spread around the September 15–16 FOMC (using the strong gamma resistance near $730 as your anchor) expresses a similar view with defined, small risk instead of tying up capital for seven months.
📊 Swing Trader
Watch the $700–$720 support band and $725–$730 resistance band from the gamma map. As long as QQQ holds above $700, this hedge is background noise, not a signal to trade against the tape. A break below $700 on rising volume — especially around the September FOMC — is the level where this kind of protective positioning starts to look prescient rather than precautionary.
💰 Premium Collector
The fact that someone paid $35.14 of time value for 221 days of protection gives you a rough sense of where implied volatility sits for QQQ's longer-dated puts right now. If you're comfortable being the seller of that kind of insurance (cash-secured or spread-based, sized appropriately), this print is a data point on what the market is currently willing to pay for downside protection through the Fed's rate-path resolution — not a reason to panic-buy your own puts.
🌱 Beginner
Here's the key difference between this trade and a typical "unusual options activity" weekly put you might see flagged elsewhere: a weekly put is usually a short, sharp bet on one specific event — it's cheap because it has almost no time value, and it's usually worthless a week later if the bet doesn't pay off fast. A 7-month put like this one is the opposite: it's expensive (most of the $13.96M is the cost of time, not just being in the money), it doesn't need a single catalyst to work, and it's built to be held through many separate events — Fed meetings, CPI prints, earnings seasons — rather than betting on any one of them. Buying a position like this is closer to paying for a long car-insurance policy than betting on a single race. It costs real money whether or not anything bad happens, and that's the point.
⚠️ Honest Limits — What the Tape Cannot Prove
- We cannot see the book this hedges. The single most important unknown here is whether this desk holds a large long equity or QQQ position elsewhere that this put offsets — that's the entire premise of "portfolio insurance," and OPRA's tape shows us the option leg only, never the hedger's broader portfolio.
- We don't know the counterparty's identity or motive. A floor block means a known counterparty on the other side, but "known" is only known to the two parties and the facilitating broker — not to us. We can't rule out that the seller of this put (the writer on the other side) had their own reasons entirely unrelated to a market view.
- We can't fully separate "new position" from "position size" yet. As covered above, we can prove at least 1,538 new contracts were created, but the true final number (up to 3,462 in OI) needs tomorrow's OPRA open-interest snapshot to confirm.
- We don't know if this position gets held to expiration. Institutional hedges are frequently rolled, resized, or unwound long before expiry as the underlying risk changes. Nothing here proves this exact position survives to March 2027.
- This is one trade, not a market signal. $13.96M is meaningful money, but relative to a ≈$480B fund, it is a rounding error. Do not read this as evidence about where the broader market is heading.
Disclaimer: Options trading involves substantial risk of loss and is not suitable for all investors. This analysis is for educational purposes only and is not financial advice. The mechanism, open interest, and size figures above come directly from the OPRA options tape; the intent behind the trade (portfolio insurance vs. any other motive) is inferred from the structure, not proven. Always do your own research and consider consulting a licensed financial advisor before trading.
Last updated: 2026-08-11 (pre-market) — the next-day OPRA open-interest snapshot resolved this session's provisional flags. Mar-19-2027 $745P 962 → 3,532 (+2,570 on a 2,500-lot print): OPEN (BTO), just above the published 2,500–3,462 range — proving the purchase was fully incremental and none of the prior 962 contracts was recycled. The ⏳ callout was replaced with the ✅ RESOLVED box.