🤝 QQQ: Two Blocks, $14.2M Committed, One Bet on Semis and One Bet on Everything
2026-08-12 | Two Negotiated Blocks, Same Direction, Different Difficulty
✅ Updated 2026-08-13 pre-market — the next-day OPRA open interest confirmed all four legs as opens. November $745C landed at 11,867 and October $800C at 32,862, both essentially on our published targets; November $725P (12,136) and October $770C (21,576) came in modestly below theirs, meaning a small share of those prints transferred rather than opened. Net new open interest across the four legs is +57,525 contracts against 58,636 printed — a 98.1% capture. All labels stand. See the ✅ RESOLVED box.
🎯 The Quick Take
Two large, negotiated QQQ options packages printed today — neither a lit sweep, both blocks with a known counterparty on the other side. A November 20 risk reversal sold 11,320 $725 puts and bought 11,320 $745 calls for a $4.22M net credit. A separate October 16 bull call spread bought 17,998 $770 calls and sold 17,998 $800 calls for a $9.97M net debit. Read together they're bullish — but they need very different things to happen, on very different timelines, and one of them is carrying far more risk than its headline credit suggests.
💰 Fund Overview — What You'd Actually Own
QQQ tracks the Nasdaq-100, "100 of the largest Nasdaq-listed non-financial companies," weighted by a modified market-cap scheme that caps any single name and any concentrated group, per Nasdaq's published NDX index methodology. The fund is rebalanced quarterly and reconstituted annually, per Invesco.
- Total net assets: ≈$479–491 billion (sources disagree — holdings page shows $479.19B as of Aug 6; fund profile shows $490.91B as of Aug 12)
- Expense ratio: 0.18%
- YTD return: +17.23% (fund profile)
- P/E: 34.45 vs. a category average of 18.55 (fund profile)
- 52-week range: $555.60–$748.65; today's spot ≈$723–725 sits ≈3.4% below the June 3 record
The concentration is the real story. Top 10 holdings are ≈46.7% of the fund:
| # | Ticker | Weight |
|---|---|---|
| 1 | NVDA | 8.46% |
| 2 | AAPL | 7.32% |
| 3 | MSFT | 5.93% |
| 4 | AMZN | 4.68% |
| 5 | MU | 4.38% |
| 6 | AMD | 3.52% |
| 7 | GOOGL | 3.33% |
| 8 | AVGO | 3.18% |
| 9 | GOOG | 3.11% |
| 10 | META | 2.79% |
Roughly $0.47 of every $1.00 in QQQ sits in ten companies. And within that, semiconductors and semiconductor equipment alone are ≈27.5% of the fund (NVDA + MU + AMD + AVGO + INTC + AMAT + LRCX + TXN + KLAC — holdings file) — bigger than Apple, Microsoft and Amazon combined. QQQ in August 2026 is functionally an AI-hardware vehicle wearing a diversified-tech-fund label. That matters directly for both trades below, because both are, underneath the structure, bets on that hardware cluster continuing to carry the index.
📊 What Just Happened — Two Separate Packages, Same Session
🤝 Package A — 10:36:32 ET — Block Cross — Risk Reversal / Synthetic Long
Sold 11,320 November 20 $725 puts, bought 11,320 November 20 $745 calls. Spot at the print: $724.47.
🤝 Package B — 10:09:11 ET — Multi-Leg Auction — Bull Call Spread
A multi-leg auction is a worked complex order exposed for price improvement — not a cross, not a lit sweep, but it keeps its premium tier. Bought 17,998 October 16 $770 calls, sold 17,998 October 16 $800 calls. Spot at the print: $725.29.
Full Trade Details
| Time | Buy/Sell | Call/Put | Expiration | Strike | Size | Vol | OI | Spot | Option Price | Premium | Symbol |
|---|---|---|---|---|---|---|---|---|---|---|---|
| 10:36:32 | SELL | PUT | 2026-11-20 | $725 | 11,320 | 11,000 | 1,783 | $724.47 | $30.36 | $34,367,520 | QQQ20261120P725 |
| 10:36:32 | BUY | CALL | 2026-11-20 | $745 | 11,320 | 11,000 | 531 | $724.47 | $26.63 | $30,145,160 | QQQ20261120C745 |
| 10:09:11 | BUY | CALL | 2026-10-16 | $770 | 17,998 | 18,000 | 3,712 | $725.29 | $9.22 | $16,594,156 | QQQ20261016C770 |
| 10:09:11 | SELL | CALL | 2026-10-16 | $800 | 17,998 | 18,000 | 14,890 | $725.29 | $3.68 | $6,623,264 | QQQ20261016C800 |
Package A net: $34.37M collected − $30.15M paid = ≈$4.22M credit. Package B net: $16.59M paid − $6.62M collected = ≈$9.97M debit.
Both packages were negotiated blocks that took no liquidity, so the BUY/SELL labels above are reported, not tape-proven. The %-across readings corroborate but don't prove: the November put printed near the bid (≈11% across), consistent with being sold, and its paired call printed near the offer (≈88%), consistent with being bought. There's no urgency here — these are known-counterparty trades priced in advance, not aggressive sweeps.
✅ RESOLVED — All Four Legs Opened; 98.1% of the Package Became New Interest
Updated 2026-08-13 pre-market. Resolving OPRA snapshot timestamped August 13 (reflects the August 12 close, after this print); baseline is the August 12 snapshot (reflects the August 11 close, before this print).
| Leg | Baseline (Aug-12) | Resolving (Aug-13) | Δ | Print size | What we published | Verdict |
|---|---|---|---|---|---|---|
| Nov-20 $725 put (sold) | 1,783 | 12,136 | +10,353 | 11,320 | "climb toward ≈13,000+ if fully new" | ✅ OPEN (STO) — 91% of size |
| Nov-20 $745 call (bought) | 531 | 11,867 | +11,336 | 11,320 | "climb toward ≈11,800+ if fully new" | ✅ OPEN (BTO) — 100.1% of size |
| Oct-16 $770 call (bought) | 3,712 | 21,576 | +17,864 | 17,998 | "climb toward ≈21,700+ if fully new" | ✅ OPEN (BTO) — 99.3% of size |
| Oct-16 $800 call (sold) | 14,890 | 32,862 | +17,972 | 17,998 | "climb toward ≈32,900+ if fully new" | ✅ OPEN (STO) — 99.9% of size |
Both blocks are confirmed new positions. No leg fell, so neither the risk reversal nor the bull call spread was an existing position coming off. The October spread in particular resolved almost perfectly: +17,864 and +17,972 against 17,998 on each side, so the spread went on essentially intact as a package.
The one soft spot is the November $725 put, which captured 91% of its print — ≈967 contracts matched against existing holders rather than creating new interest. That leaves the November risk reversal very slightly unbalanced in open-interest terms (+10,353 puts sold against +11,336 calls bought) even though it printed 11,320 a side.
Nothing here changes the article's framing. Two negotiated blocks, same broad direction, different degrees of difficulty — and now confirmed to be genuinely new risk in both cases rather than repositioning.
🤓 What This Actually Means — Plain English
Package A: selling a put to fund a call — a synthetic long, with real downside teeth.
A risk reversal means giving up protection to get exposure cheaper. The desk sold the $725 put — meaning they're now on the hook to buy 1,132,000 shares' worth of QQQ at $725 if the fund is below that level on November 20 — and used that $34.37M in collected premium to buy the $745 call, which pays off if QQQ rallies. Net, they collected $4.22M for taking on both sides of the bet.
This behaves almost exactly like owning ≈11,320 × 100 = 1,132,000 shares of QQQ synthetically, without paying full price for them. The catch: the $725 short put strike sits essentially at spot — literally 0.07% above where QQQ traded at the print — meaning roughly half of all possible outcomes land below it. The obligation being carried is ≈$820.7 million of downside notional (11,320 × 100 × $725), against a $4.22M credit. That's not a small hedge — that's a big number attached to a small number. A 10% drop in QQQ from here would cost roughly $82 million on this position against a $4.22M credit collected. This structure is a bet that QQQ simply does not break down meaningfully between now and November 20 — it's not really about hitting the $745 call target, it's about not falling through $725.
Package B: a bull call spread — capped risk, capped reward, needs a new high plus more.
Buying the $770 call and selling the $800 call caps both the cost and the payout. The maximum this position can lose is the $9.97M paid. The maximum it can make is the $30 strike width times 17,998 contracts times 100, minus what was paid — ≈$44.0 million, a ≈4.4-to-1 reward-to-risk ratio. But the breakeven is $775.54, which is +7.05% from spot — and the $770 lower strike alone sits ≈2.9% above the fund's all-time high of $748.65. This spread doesn't just need a new record; it needs the fund to blow past the old record by nearly 3% within roughly two months. Risk-neutral odds implied by the traded prices put the chance of finishing in the money around 20–23%, with only about a 12% chance of reaching the full $800 payout. Most likely outcome on the numbers: this spread expires worthless, and the desk knows that going in — it's a lottery-ticket-shaped bet with real premium behind it, not a base-case forecast.
📈 Chart Check-Up
1-Year Performance
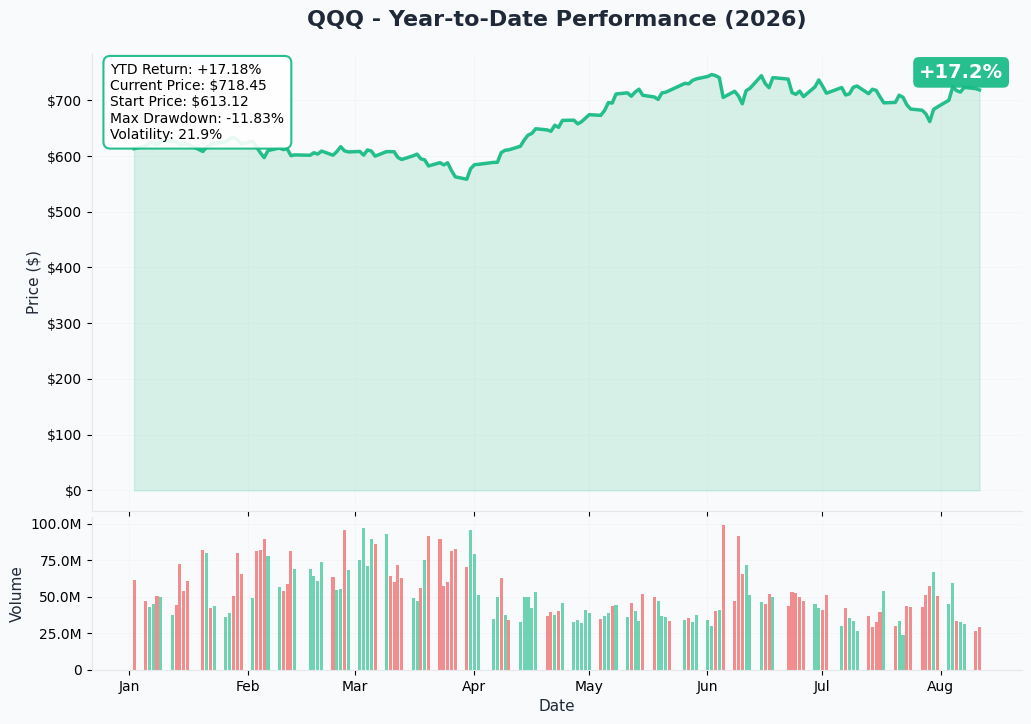
QQQ made its record high on June 3, faded through July, and has spent August climbing back toward — but not through — that level. Both of today's trades were placed into that recovery, two days after NVIDIA's August 10 announcement of a multi-firm push (Apollo, BlackRock, Blackstone, Brookfield, Goldman Sachs, KKR) to mobilize over $500 billion of third-party AI-infrastructure financing — explicitly still "subject to final agreement execution," per NVIDIA's newsroom.
Gamma Support & Resistance
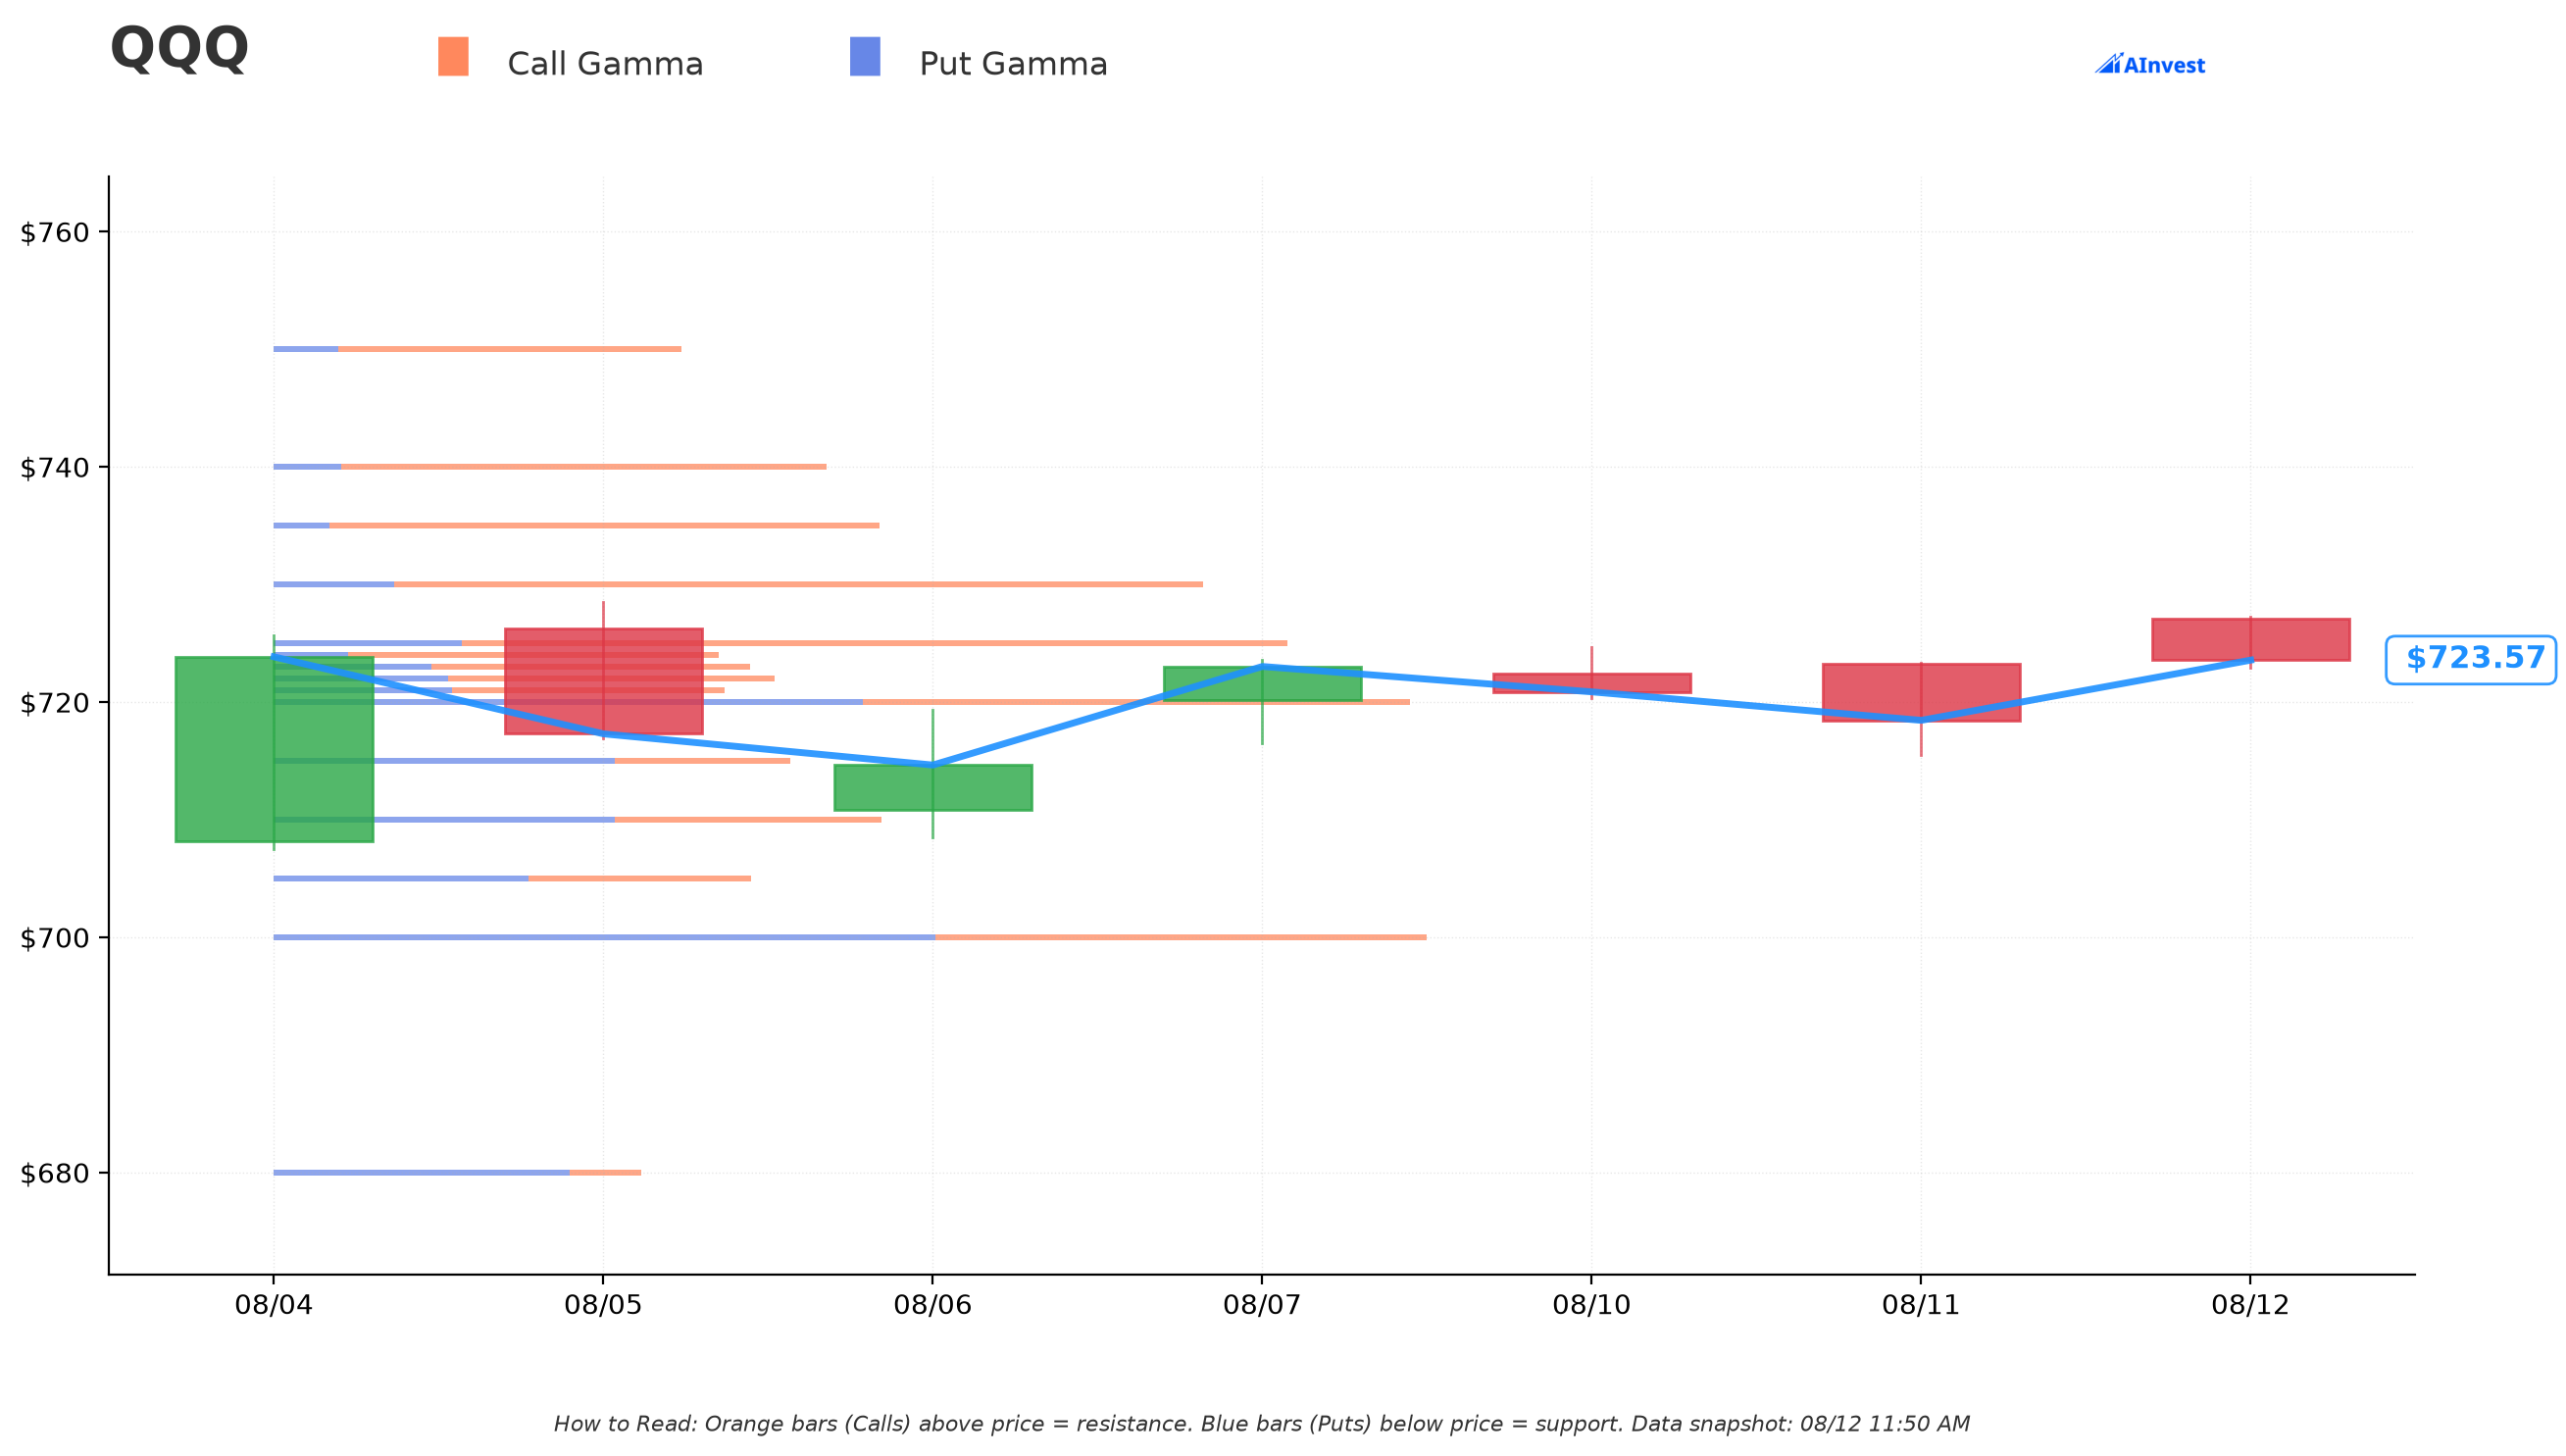
With spot at $723.36, dealer positioning shows resistance at $725 (Very Strong) — and that is the exact strike where Package A sold its put. In gamma terms, $725 is currently the strongest single line on the board; the desk chose to write insurance right at the market's own pivot point. Further resistance sits at $730 and $735 (both Very Strong), with $760 and $780 flagged Very Strong further out. On the downside, $700 is Very Strong support, with $720 and $710 as nearer support walls. These levels shift intraday as dealers rehedge — treat them as a current snapshot, not a fixed floor or ceiling.
Implied Move
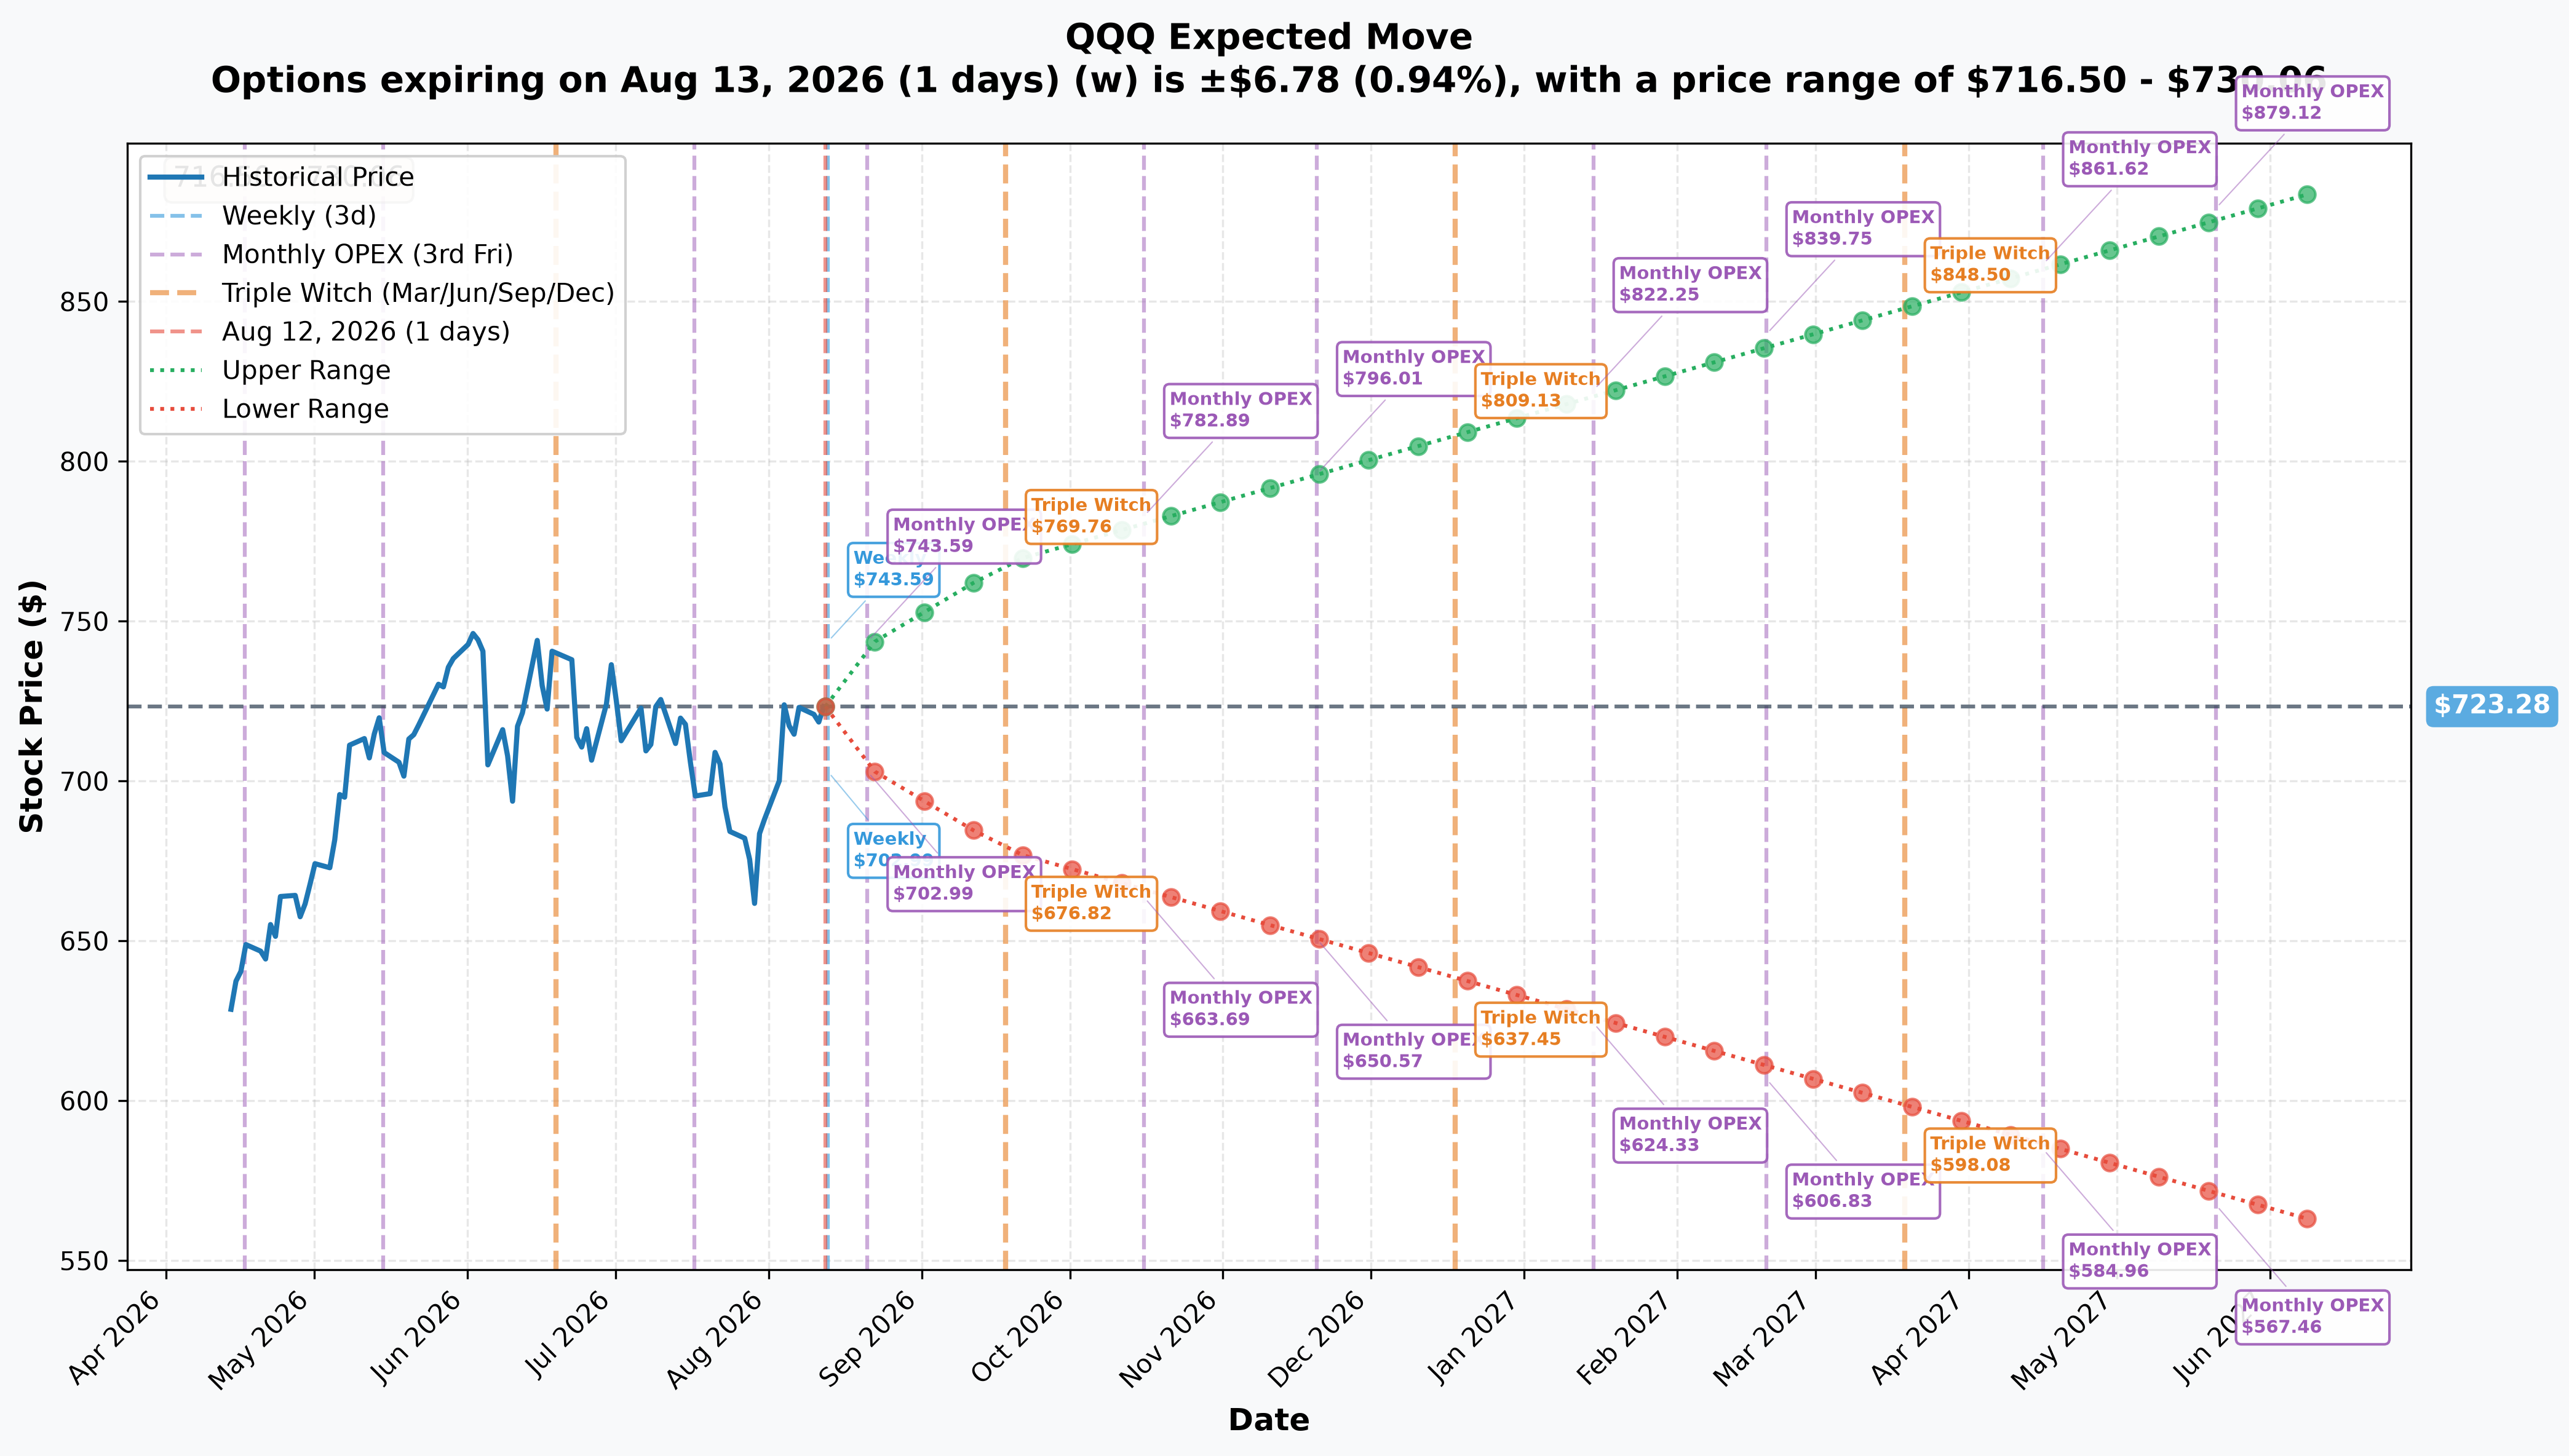
The options market is currently pricing:
- To August 13 (1 day): ±0.94% → $716.50–$730.06
- To August 21 (monthly OPEX): ±2.68% → $703.91–$742.67
- To September 18 (quarterly triple witch): ±6.24% → $678.13–$768.45
That last number is the important one: the September implied-move range tops out at $768.45 — below the October spread's $770 lower strike. The market is not currently pricing the move Package B needs, at least not by the quarterly expiration that lands a month before it settles. To get there, the fund would need volatility to expand meaningfully beyond what's priced in today, or the move would need to concentrate hard in the final weeks before October 16.
🎪 Catalysts
The expiration split is the whole analysis. These two packages don't overlap on what they're betting on — they capture almost entirely different events.
Inside the October 16 expiration (≈19.6% of index weight reporting — almost entirely semiconductors)
| Date | Event |
|---|---|
| Aug 12 | July CPI (released this morning) |
| Aug 13 | AMAT fiscal Q3 (1.85% weight) |
| Aug 26 | NVIDIA fiscal Q2 FY2027 (8.46% weight) — scheduled per NVIDIA's quote record, but not directly company-confirmed |
| Aug 27–29 | Jackson Hole Symposium |
| Aug 31 | Q3 index rebalance reference date |
| Sep 2 | Broadcom fiscal Q3 (3.18% weight) |
| Sep 4 | August payrolls |
| Sep 11 | August CPI |
| Sep 15–16 | FOMC with Summary of Economic Projections (Fed calendar) |
| Sep 21 | September rebalance effective at the open |
| Sep 22 | Micron fiscal Q4 (4.38% weight) |
| Sep 24 | Costco fiscal Q4 (1.86% weight) |
| Oct 2 | September payrolls |
| Oct 14 | September CPI (two trading days before expiration) |
What's NOT inside it: the October 27–28 FOMC, the entire late-October mega-cap earnings cluster (≈20.7% of the fund), November payrolls, and November CPI. The October spread expires before the fund's biggest non-semiconductor names say a word about the quarter.
Inside the November 20 expiration (adds everything above, plus — over 55% of index weight reporting)
| Date | Event |
|---|---|
| Oct 27–28 | FOMC (no SEP) |
| Nov 6 | October payrolls |
| Nov 10 | October CPI |
| Oct 26–30 | Microsoft, Meta, Apple, Amazon Q3 — ≈20.7% combined; dates expected, not yet published |
| early Nov | AMD, Palantir Q3 — ≈5.1% combined; unconfirmed |
| Nov 18 | NVIDIA fiscal Q3 FY2027 (8.46% weight) — inferred from last year's November 19, 2025 report, two days before expiration; not confirmed |
The one-line summary: the October spread is a bet on the semiconductor earnings cycle and the September Fed meeting alone; the November risk reversal is a bet on the entire mega-cap earnings season, two FOMC meetings, three CPI prints — and, on the expected schedule, NVIDIA's own report landing just two days before it settles.
🎲 Four Ways to Read This
🎲 The YOLO trader
Both structures already reflect big-money direction, but Package B is the one shaped like a lottery ticket: ≈4.4-to-1 payoff, ≈20–23% odds, needing a new all-time high plus nearly 3% more by October 16. If you want to ride that exact idea smaller, a single October $770/$800 call spread costs roughly $554 per contract at these prices — know going in that the base case is this expires worthless, same as it likely will for the desk that put on 17,998 of them.
📈 The swing trader
The more interesting read here isn't "buy the same thing" — it's watching whether QQQ holds $725 gamma resistance and $700 support over the next few weeks. A break and hold above $725 with NVIDIA's August 26 report as a catalyst would put the September 21 rebalance and October spread's logic in play. A close below $700 would argue the whole hardware-led rally is stalling, which is exactly the scenario Package A is short.
💰 The premium collector
Package A's short $725 put is the trade to study, not copy at this size. Selling a put at a strike that's essentially at the money, right on the strongest gamma wall on the board, for a credit that's a rounding error against the notional obligation, only works if you can actually carry $725-strike assignment risk on 100+ lots. On a retail scale, the same idea — collect premium near-the-money with defined risk — is far safer done as a credit spread than a naked short put.
🌱 The beginner
Don't read this as "big money says buy QQQ, so buy QQQ." Both of these are negotiated blocks with two willing counterparties — nobody swept the lit market in a panic. The lesson worth taking: a $34M "sold puts" headline sounds bullish, but it comes with a $820.7M obligation on the other side of it. Big premium numbers describe size, not conviction, and options strategies that look similar (a call spread vs. a short put) carry very different risk shapes even when they're both "bullish."
⚠️ Honest Limits — What the Tape Cannot Prove
- Direction is reported, not tape-proven. Both packages were negotiated blocks that took no liquidity; the %-across readings corroborate the labels but don't establish them as fact.
- No precise three-month return is available. A clean May 12, 2026 QQQ close could not be retrieved, so the exact trailing-three-month percentage move is unconfirmed — only the shape (June record, July fade, August recovery) is verifiable.
- NVIDIA's August 26 date is scheduled but not company-confirmed — no conference-call press release could be located on NVIDIA's own newsroom.
- NVIDIA's November 18 date is entirely inferred from the November 19, 2025 precedent, not published. A one-week slip either direction changes whether the November 20 options expire before or after NVIDIA's next report.
- No mega-cap Q3 earnings dates (MSFT, META, AAPL, AMZN, TSLA, GOOGL, AMD, PLTR) are published yet — the late-October/early-November window is a pattern-based expectation.
- The September and December Nasdaq-100 index event dates are calculated by applying the published methodology rules to the calendar, not read off an official Nasdaq announcement.
- 2027 CPI and payrolls dates are not yet published by the BLS.
- Options probabilities and implied volatilities cited above are the author's arithmetic from traded prices, not market-published values, and total fund AUM/holdings-count figures differ across sources by a few percent.
This is not investment advice. Options carry substantial risk of loss, including the potential loss of the entire premium paid, and — for anyone considering a short put or short call structure — obligations well beyond the premium collected. Trade sizes and structures described here reflect institutional positioning and are not a recommendation to replicate them at any scale. Verify all dates and figures independently before trading around them.
Last updated: 2026-08-13 (pre-market) — the next-day OPRA open-interest snapshot confirmed all four legs as opens. Nov-20 $725P 1,783 → 12,136 (+10,353, 91% of size), $745C 531 → 11,867 (+11,336, 100.1%), Oct-16 $770C 3,712 → 21,576 (+17,864, 99.3%), $800C 14,890 → 32,862 (+17,972, 99.9%) — 98.1% capture across the package. The ⏳ callout was replaced with the ✅ RESOLVED box; no thesis or title change was required.