🪜 RKT $4.3M Triple-Expiry Call Sale — Two Days Before Earnings
📅 2026-08-04 | 🤝 Block Cross — Laddered Call-Selling Program
🎯 The Quick Take
A desk sold three different call strikes across three different expirations in Rocket Companies (RKT) in one package, all as a negotiated block cross, collecting $4.27M in net credit. Every leg is a proven new position (size clears prior open interest on all three), and the strikes are laddered 12%, 19% and 40% above the $14.27 print-time spot, stretching all the way to June 2027. This landed two days before a company-confirmed August 6 earnings report, with a chain-implied weekly move already running hotter than the outside "expected move" estimate.
🏢 Company Snapshot
Rocket Companies is a Detroit-based mortgage originator and fintech platform — the parent of Rocket Mortgage, Rocket Money, Rocket Loans and (since the 2025 acquisitions) Mr. Cooper's mortgage-servicing book and the Redfin real-estate brokerage/search platform. It operates through two segments, Direct to Consumer and Partner Network, has roughly 23,500 employees, and is led by CEO Varun Krishna. Market cap is $40.62B with an enterprise value of $69.25B — the gap reflects the warehouse and servicing-related debt that comes with owning a $2.1 trillion combined loan-servicing book. Sector: Financials. Industry: Mortgage Finance.
💰 The Option Flow Breakdown
📊 What Just Happened
One package, three legs, printed in the same second — 11:36:16 ET — with RKT trading at $14.27. All three legs are multi-leg block crosses (a pre-arranged, negotiated trade with a known counterparty on the other side, not an open-book sweep), and all three filled right at the bid.
| Time | Buy/Sell | Call/Put | Expiration | Strike | Option Price | Premium | Day Volume | Prior OI | Size | Spot | Option Symbol |
|---|---|---|---|---|---|---|---|---|---|---|---|
| 11:36:16 | SELL | CALL | 2026-10-16 | $16 | $0.97 | $1,309,500 | 14,000 | 4,024 | 13,500 | $14.27 | RKT20261016C16 |
| 11:36:16 | SELL | CALL | 2026-11-20 | $17 | $1.08 | $1,166,400 | 11,000 | 635 | 10,800 | $14.27 | RKT20261120C17 |
| 11:36:16 | SELL | CALL | 2027-06-17 | $20 | $1.66 | $1,792,800 | 11,000 | 625 | 10,800 | $14.27 | RKT20270617C20 |
🤝 Flow type: BLOCK CROSS (multi-leg). This is not a sweep — it's a broker-facilitated block where a buyer and seller already agreed on price off the open book. All three legs printed at 0% across the NBBO (right at the bid), consistent with a negotiated fill, not urgent aggression.
Net premium: $4,268,700 CREDIT. Package delta is −1,369,386 shares (≈$19.5M of short-delta exposure on a $14.27 stock) — computed from each leg's option delta (0.4006 / 0.3776 / 0.3896) times contract size:
- $16C: 13,500 × 100 × 0.4006 ≈ 540,810 shares
- $17C: 10,800 × 100 × 0.3776 ≈ 407,808 shares
- $20C: 10,800 × 100 × 0.3896 ≈ 420,768 shares
All three legs are proven opens. Size cleared prior open interest on every strike:
- $16C: 13,500 vs prior OI 4,024
- $17C: 10,800 vs prior OI 635
- $20C: 10,800 vs prior OI 625
That's genuinely new short-call risk being put on — not a roll, not a close.
✅ RESOLVED — All Three Legs Opened, Essentially One-for-One
Updated 2026-08-05 pre-market. The ≈06:30 ET OPRA snapshot (reflecting the August 4 close) has published. This is as clean a set of numbers as this check ever produces.
| Leg | Baseline OI (Aug-4 snap) | Resolving OI (Aug-5 snap) | Δ | Print size | Δ as % of print | Verdict |
|---|---|---|---|---|---|---|
| Oct-16-2026 $16 C (sold) | 4,024 | 17,549 | +13,525 | 13,500 | ≈100.2% | ✅ OPEN (STO) |
| Nov-20-2026 $17 C (sold) | 635 | 11,438 | +10,803 | 10,800 | ≈100.0% | ✅ OPEN (STO) |
| Jun-17-2027 $20 C (sold) | 625 | 11,426 | +10,801 | 10,800 | ≈100.0% | ✅ OPEN (STO) |
Predicted ≈17,500 / ≈11,400 / ≈11,400; actual 17,549 / 11,438 / 11,426. Every leg landed within a handful of contracts of a perfect one-for-one open — none of this size was absorbed by existing holders. The laddered short-call program is confirmed as entirely new short-call risk across all three expiries.
🤓 What This Actually Means — Plain English
STO = Sold To Open. On all three legs, this desk collected premium upfront in exchange for taking on an obligation: if RKT is above the strike at expiration, they either have to deliver 100 shares per contract at that strike, or buy back the call at a loss before then. That's the opposite of buying a call — they're the ones who get paid now and carry the risk later.
A laddered call-sale program, not one trade. Selling three different strikes across three different expirations in a single package doesn't look like a single directional bet on RKT going nowhere. It reads more like a systematic overwrite or premium-harvest program — a way to generate income against a position (or a view) across multiple time horizons at once, rather than one all-or-nothing wager.
The critical unknown: covered or naked. We can see the option side of this trade in full. We cannot see whether there's stock sitting behind it. If this desk owns (or is about to own) RKT shares against these calls, this is a classic covered call — capping upside in exchange for income, a conservative income strategy. If there's no stock behind it, this is a naked short call — and naked short calls carry theoretically unlimited loss if the stock keeps running, because there's no cap on how high a stock can go. The tape cannot tell us which one this is. Say that plainly rather than guessing.
What happens if RKT gaps up Thursday. Earnings hits after the close on August 6, inside every one of these three expiries. If the report (or the market's read of it) sends RKT sharply higher, the $16 strike — only 12% above spot — is the one most exposed. A seller without stock behind that leg would need to either buy back the call at a higher price than they sold it for, or let it be exercised and deliver shares they don't have. The $17 and $20 strikes have more room, but they're not immune, especially given how far out (June 2027) the $20 leg runs — plenty of time for a name with a 2.18 beta to get there.
📈 Technical Setup / Chart Check-Up
YTD Chart
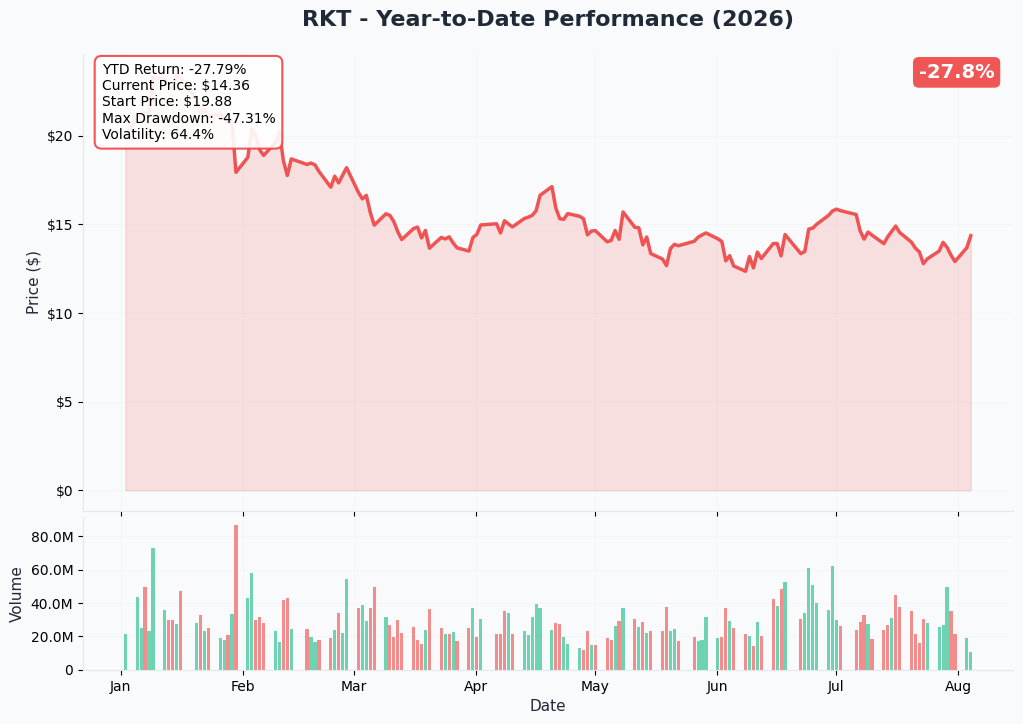
RKT is −27.8% over the trailing year, a downtrend that includes today's session sitting just above the 50-day moving average ($14.00) and well below the 200-day ($16.50). The stock is roughly 18% above its 52-week low ($12.17) and about 41% below its 52-week high ($24.36).
Gamma-Based Support & Resistance
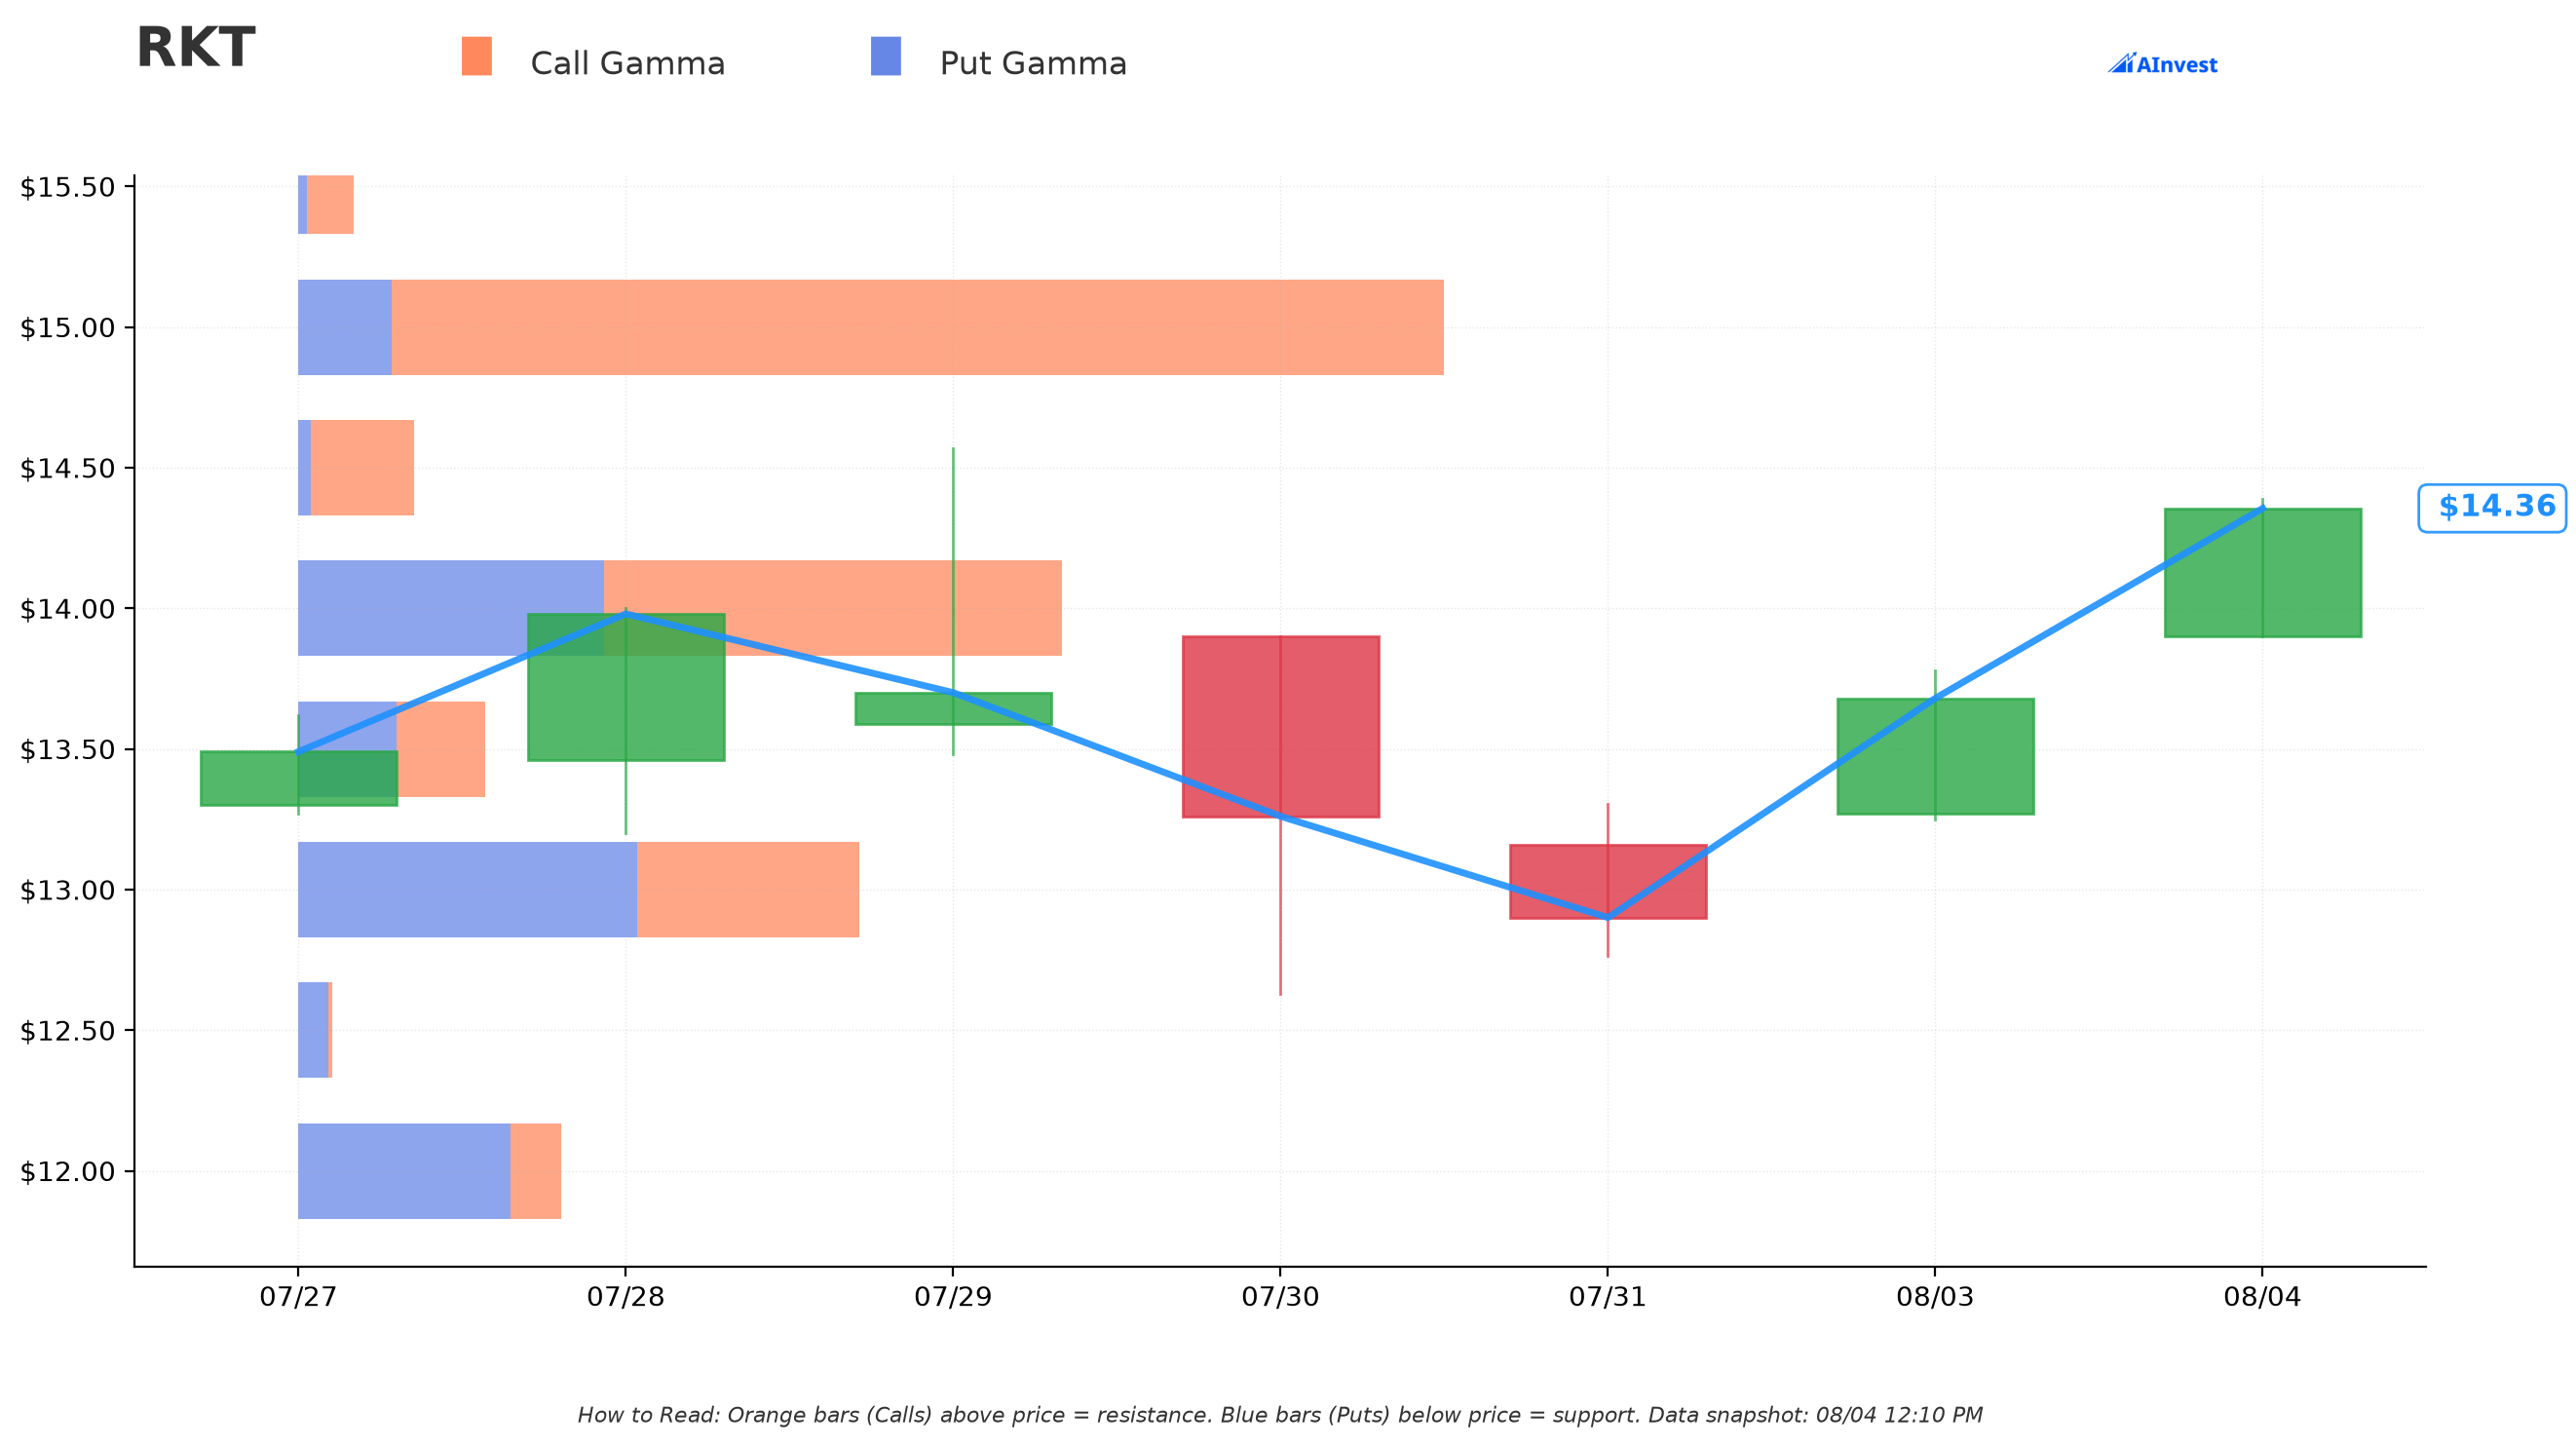
Reading the dealer gamma positioning off the chain (spot reference $14.37):
- 🔵 Support: $14.00 ("Strong" wall, ≈2.6% below spot) — the nearest floor.
- 🟠 Resistance: $15.00 ("Very Strong" wall, ≈4.4% above spot) — the biggest gamma concentration on the board, and the first real ceiling above today's price.
- 🟠 Resistance: $16.00 (≈11.3% above spot) — this is the exact strike of the Oct-16 short call sold today. There's already a real options-market wall sitting right where this desk chose to sell.
- 🟠 Resistance: $17.00 (≈18.3% above spot) — also the exact strike of the Nov-20 short call.
- 🟠 Resistance: $19.00 (≈32.2% above spot) — one strike below the Jun-2027 $20 short call, the third leg of the ladder.
In plain terms: this program sold calls at or just past levels where the options market already shows meaningful call-side interest. That's a sensible place to collect premium if you don't expect a breakout past those zones — but it also means real size is stacked at exactly the levels a squeeze would need to clear.
Implied Move
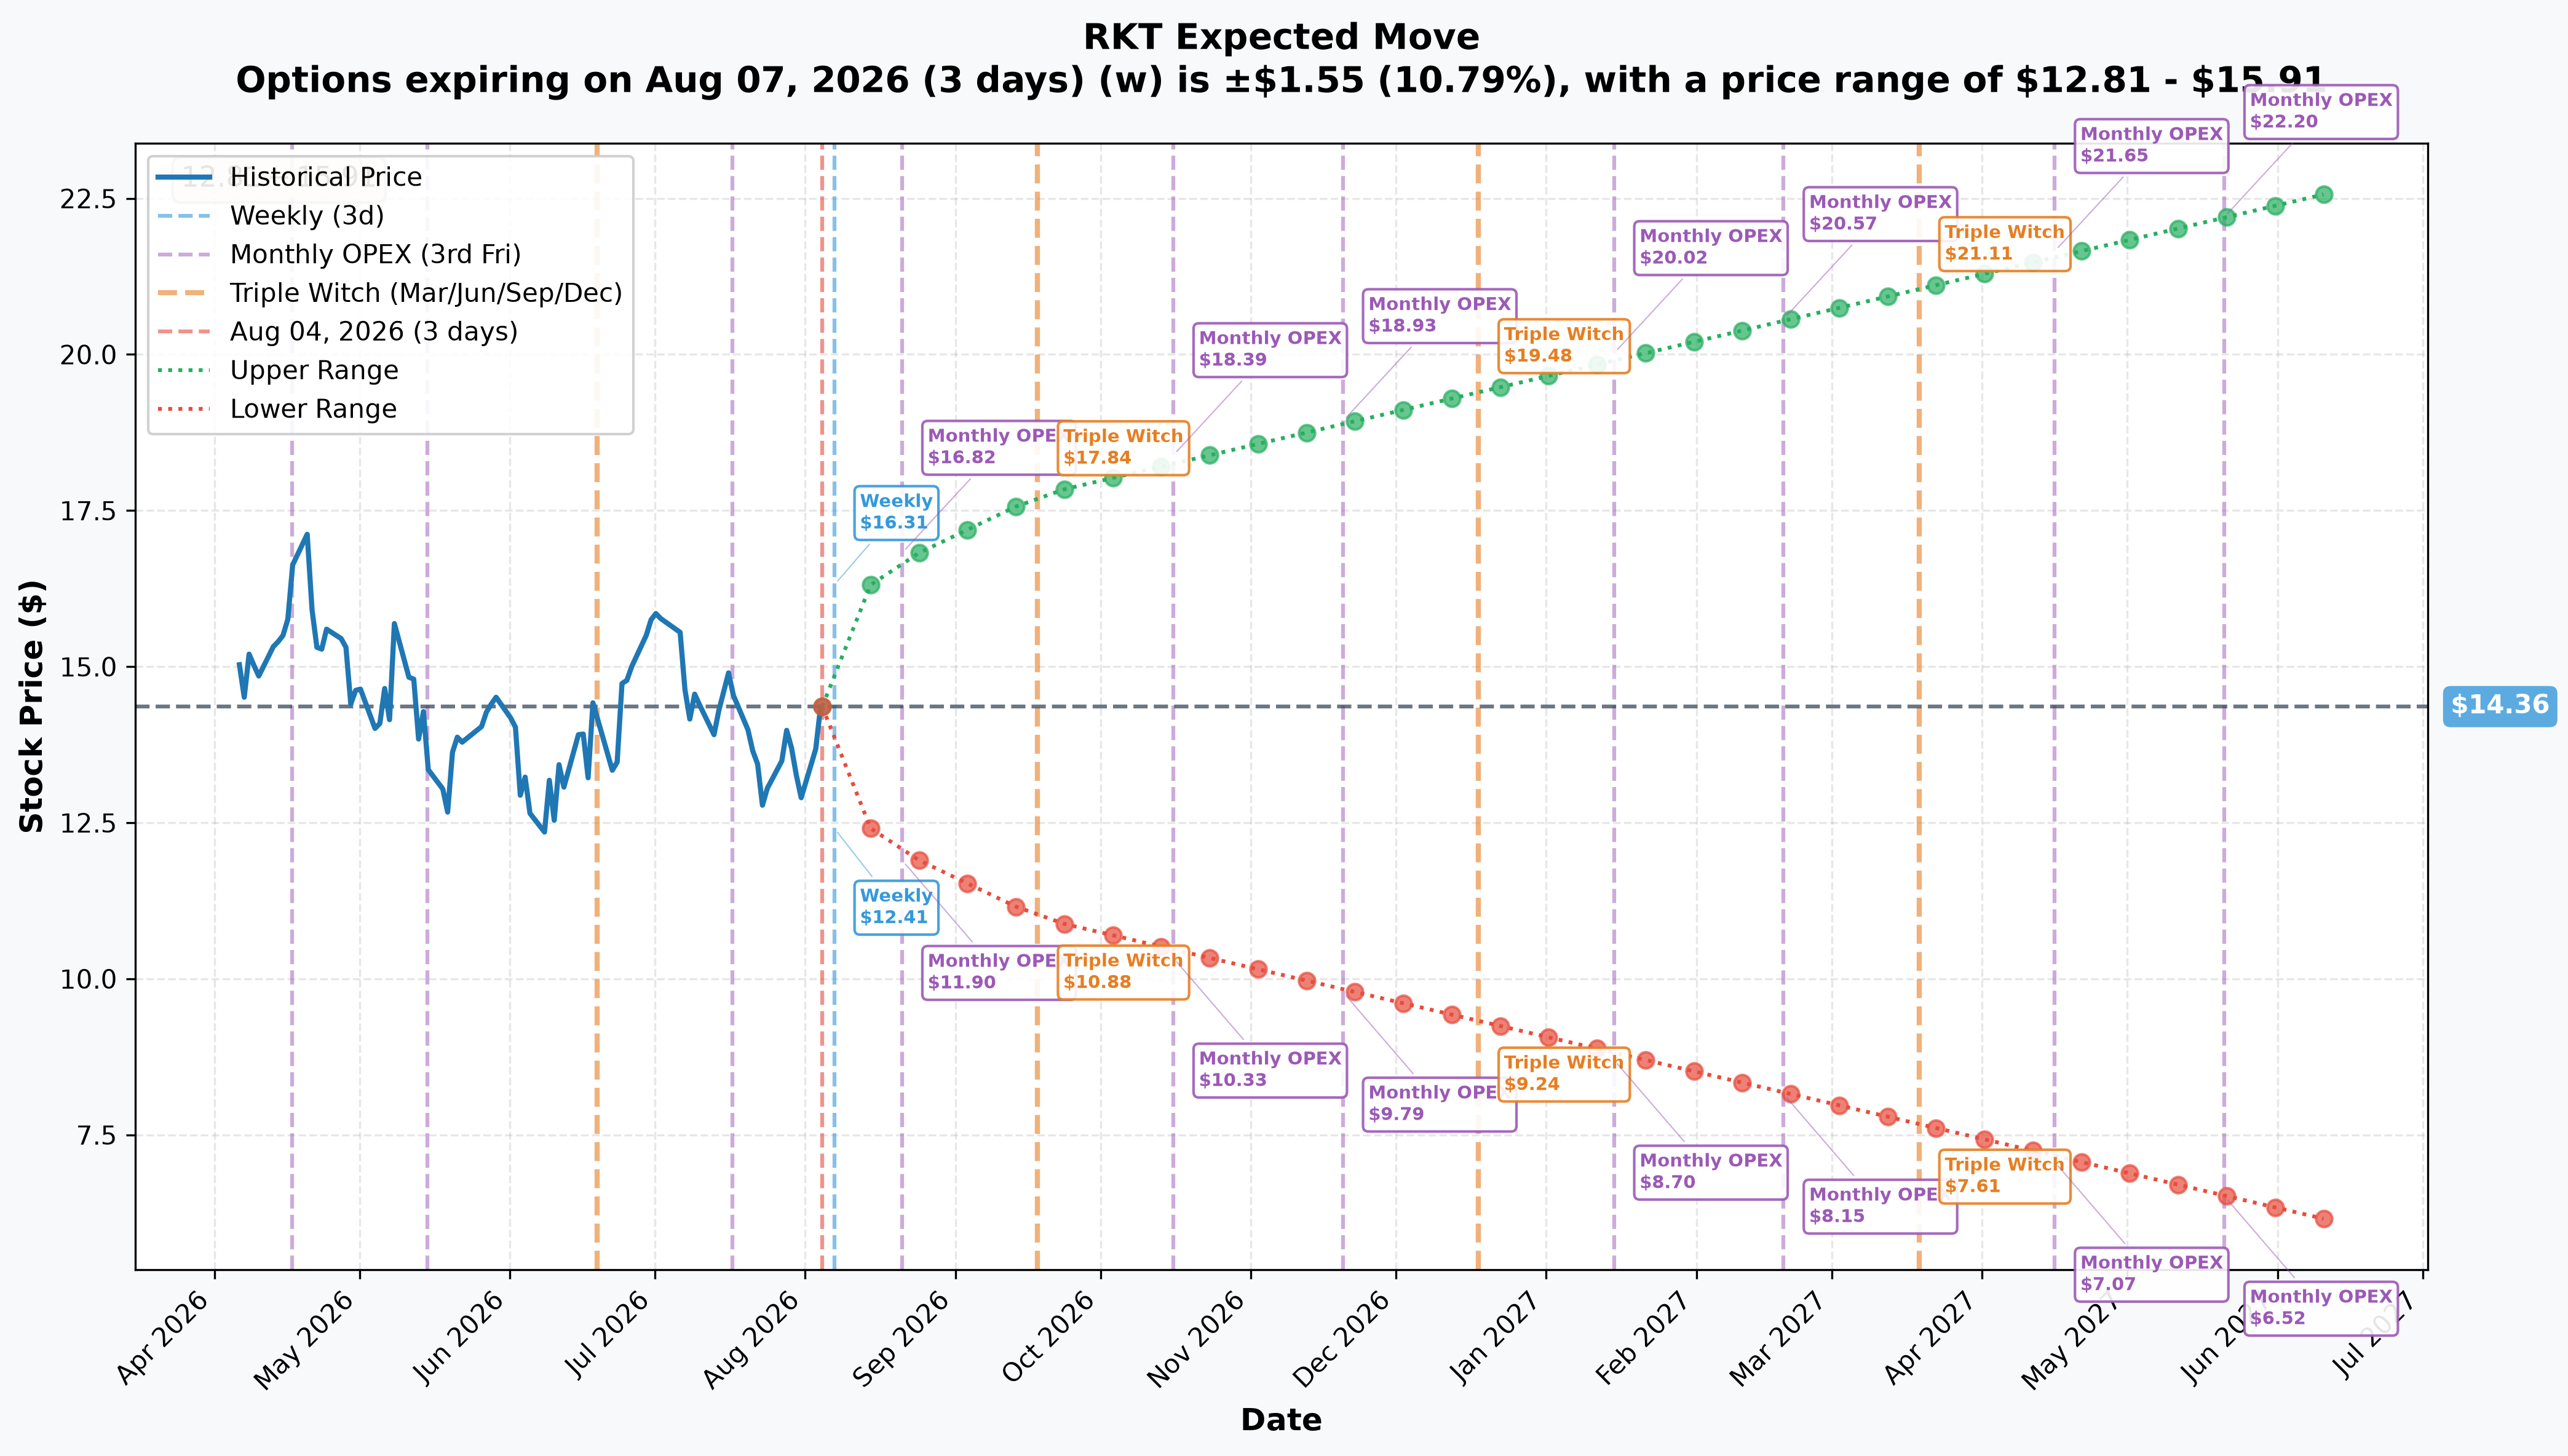
Pulling the chain-implied ranges at each relevant expiry (current price $14.36):
| Window | Expiry | Implied move | Range |
|---|---|---|---|
| Weekly (covers earnings) | 2026-08-07 | ±10.79% ($1.55) | $12.81 – $15.91 |
| Same date as the Oct-16 short call | 2026-10-16 | — | $10.33 – $18.39 |
| Same date as the Nov-20 short call | 2026-11-20 | — | $9.79 – $18.93 |
| Same date as the Jun-2027 short call | 2027-06-17 | ±58.04% ($8.33) | $6.03 – $22.69 |
Worth flagging directly: the options chain is pricing a bigger earnings-week swing (±10.79%, a $1.55 move to a $12.81–$15.91 range) than the ≈6.7% "expected move" figure circulating from outside analyst commentary. The chain and the outside estimate disagree, and the chain is the more current, market-derived number.
More important for this specific trade: at every one of the three sold strikes, the implied-move upper bound for that exact expiration already sits above the strike itself. The Oct-16 range tops out at $18.39 versus a $16 strike sold; the Nov-20 range tops out at $18.93 versus a $17 strike; the June-2027 range tops out at $22.69 versus a $20 strike. None of these calls were sold miles outside what the options market itself considers a plausible move — they were sold inside the envelope, which is the honest way to read the risk here.
🎪 Catalysts
Upcoming
- Q2 2026 earnings — Thursday, August 6, 2026, after market close, conference call 4:30 p.m. ET. This is company-confirmed: Rocket issued a July 23 press release naming the date. Note that MarketBeat's earnings page still labels the date "estimated" — that page is stale; the company's own release is the accurate source. Every strike sold today expires after this print.
- Management already guided Q2 revenue to $2.7–$2.9 billion, below the $3.0 billion consensus (MarketBeat earnings) — a guide-down that signals volume and margin pressure from the current rate environment heading into the print.
- 30-year fixed mortgage rate: 6.77% as of August 4, near the top of its 5.99%–6.85% 52-week range (Mortgage News Daily) — the dominant swing factor for this business, and the reason guidance came in soft.
- Three FOMC meetings remain in 2026: September 15–16, October 27–28, and December 8–9 (Federal Reserve FOMC calendar) — the September and December meetings carry updated economic projections that reset the rate path mortgage pricing keys off. All three sit inside the Nov-20 and Jun-2027 legs of this trade; two of the three sit inside the Oct-16 leg's window.
- Recurring housing-data releases (new residential construction and new home sales, via the Census Bureau calendar) land roughly monthly through year-end and have moved this stock on their own before.
Already happened
- RKT rose 11.0% on June 24, 2026 purely on housing-price data, with no company-specific news (Investing.com) — direct evidence that this is a high-beta macro name (5-year beta 2.18) as much as it is a company story.
- Morgan Stanley upgraded RKT to Overweight on July 16, 2026 (from Equal-weight, price target raised to $19.00), citing improved valuation (MarketBeat price-target history) — the same day RKT secured a new $2.5 billion revolving credit facility.
- Four separate price-target cuts since April — Wells Fargo (April 9), KBW (June 25), Barclays (July 7), and JPMorgan (July 13) — against that one upgrade and two initiations (MarketBeat price-target history). Notably, Barclays and KBW cut their targets while keeping Overweight/Outperform ratings — that's analysts marking down the rate-environment math without abandoning the underlying thesis.
- Mr. Cooper (announced March 2025, all-stock, delisted October 1, 2025) and Redfin (delisted July 1, 2025) are both now folded into Rocket's structure, driving the +167% year-over-year Q1 2026 revenue growth reported May 7 (MarketBeat earnings). That growth number is acquisition arithmetic, not organic — Q3 2026 is the first quarter with a clean year-over-year comparison including Mr. Cooper in both periods, which is when the growth optics get materially harder.
🎲 Price Targets & Probabilities
Using the gamma and implied-move levels above alongside the catalyst calendar:
- Base case: RKT continues to gravitate around the $14.00–$15.00 zone into Thursday's print — the strongest nearby gamma concentration on both sides. This is where the stock "wants" to sit absent a surprise.
- Bull case: a clearance of the $15.00 wall opens a path toward $16.00–$17.00, which is exactly where the first two sold call strikes live — both inside the chain's own implied-move envelope for their respective expiries. Above that, the $19.00–$20.00 zone (where the Jun-2027 leg sits) is a longer-dated target that a sustained rate-cut narrative could reach.
- Bear case: a soft print or a guidance cut on top of the already-below-consensus guide could send RKT back toward the $12.81 low end of the weekly implied-move range, or further given the stock's downtrend and 2.18 beta.
None of this is a prediction — it's a map of where the options market itself has concentrated interest and what range it's already pricing.
💡 Trading Ideas
🛡️ Conservative
If you already own RKT shares (or plan to going into the print), selling a single covered call at the $16 or $17 strike for the same expiries this desk chose is the retail version of what may be happening here — you cap upside past the strike in exchange for a modest credit, and you're never exposed past your own shares. Only do this if you're genuinely fine selling your stock at that price.
⚖️ Balanced
A bear call spread — sell the $16C and buy the $17C or $18C in the same October expiry — caps both the credit collected and the maximum loss, unlike a naked short call. It's a smaller, defined-risk way to express "I don't think RKT clears $16-$17 by mid-October" without unlimited downside if you're wrong.
🚀 Aggressive
Buying the weekly ($16C, Aug-7 expiry) or a similar near-strike call ahead of Thursday's report is a direct bet that earnings beats the below-consensus guide and the market rewards it. This is a binary, event-driven trade — the ±10.79% implied move means the premium already reflects a real chance of a big swing either way, so the option is priced for volatility, not cheap.
⚠️ Risk Factors
- This is a high-beta (2.18), heavily-shorted name with confirmed earnings inside every expiry sold today. RKT has moved double digits in a single session on housing data alone (June 24, +11.0%) with zero company news — a beat or miss Thursday, layered on top of macro sensitivity, can move this stock hard in either direction.
- Short interest is elevated and rising fast: 136.44 million shares short as of the July 15 settlement, up 31.17% in a single period, roughly $1.99 billion notional, and about 5 days to cover (MarketBeat short interest). Sources disagree on the percent of float — StockAnalysis puts it at 14.10% (which checks out arithmetically against its own stated float), MarketBeat at 11.39% (implying a larger float assumption). Either way, this is a name where a strong beat could run into short covering.
- We cannot see whether stock sits behind these short calls. Covered, this is income generation with capped upside. Naked, the loss on the $16 leg in particular is theoretically unlimited if RKT runs hard past its breakeven (roughly $16.97 on that leg alone, before considering the other two). The tape proves the option side only — nothing here proves a hedge exists.
- The analyst tape is quietly negative under a constructive surface. Zero Sell ratings and every price target above spot ($15.50–$25.00, average $20.73) — but four separate target cuts since April against one upgrade. Room for further downgrades exists even without a rating flip.
- The growth story gets harder to read starting next quarter. The headline +167% year-over-year revenue growth is Mr. Cooper and Redfin consolidation, not organic expansion. Q3 2026 is the first clean comparison — a deceleration in the growth rate at that point would be an optics problem even if the underlying business is fine.
- What the tape genuinely cannot prove: the counterparty's identity, whether this is one desk or several working together, whether stock or other options hedge this position, and the seller's actual intent (income program vs. a view that RKT stalls). Treat the "systematic overwrite" read as the most likely explanation given the laddered structure — not a certainty.
- Standard options-risk disclaimer: options trading involves substantial risk and is not suitable for all investors. Short/naked call positions in particular carry loss potential that can exceed the premium collected. This article is not personalized investment advice — verify your own risk tolerance and position sizing before acting on any of this.
🎯 The Bottom Line
Here's the deal: three call strikes, three expiries, one package, all proven opens, all sold at the bid as a negotiated block cross — $4.27M collected, $19.5M of short delta put on two days before a confirmed earnings report. The strikes line up almost exactly with real gamma resistance walls already visible in the chain, and every strike sits inside what the options market itself considers a plausible move by its own expiry. That's consistent with a disciplined, multi-horizon premium-selling program — but it is not proof of one, because the tape cannot show us whether stock backs any of it. If you're watching this name into Thursday: know your own breakeven, know whether you're covered or naked if you mirror this trade, and remember that RKT has already proven it can move 11% in a session on nothing but macro data. Mark your calendar for August 6 after the close, and check back for the next-morning OI update to see how much of today's size actually stuck as new open interest.
Last updated: 2026-08-05 — next-day OPRA open-interest resolution added: all three legs confirmed OPEN (STO), essentially one-for-one.