🏗️ ROCK $1.6M Put Buy — The One Trade Today With Zero Open-Interest Guesswork
📅 August 10, 2026 | 🔥 Unusual Activity Detected
🎯 The Quick Take
A single trader bought 4,500 September-18 $50 puts on Gibraltar Industries (ROCK) for ≈$1.60M at 11:47:53, paying $3.55 with the stock at $48.53. It printed as a manually negotiated floor block — a known counterparty, not an urgent sweep — and it's the cleanest open-interest read on the whole board today: prior OI was flat zero for weeks, so this is certainly a brand-new position, no ambiguity, no "could be a close" hedge needed. The put is also slightly in-the-money, and the stock just gave back its entire post-earnings pop. Let's break down what that actually means.
📊 Company Overview
Gibraltar Industries (ROCK) is a Buffalo, New York-based building-products manufacturer, listed on NASDAQ, in the Industrials / Building Products & Equipment sector.
⚠️ Important premise correction: Gibraltar fully exited its Renewables business on July 16, 2026, selling its solar racking and foundations operations to Unirac. Any old "solar policy" thesis on this name is out of date by roughly four weeks. The company now runs three segments:
- Residential (≈84% of continuing-ops sales) — roof/foundation ventilation, mail and package systems, roof edging, soffits, metal roofing, gutters, retractable awnings
- Agtech (≈11.5%) — controlled-environment agriculture, greenhouse structures, structural canopies
- Infrastructure (≈4.9%) — expansion joints, structural bearings, bridge cable protection
Market cap: ≈$1.45 billion. Price: ≈$48.85–$49.02.
⚠️ A genuine small cap — read this before trading the options
This is not a mega-cap name, and it matters for how you size and execute:
- Only four analysts cover ROCK, versus 40+ on a large-cap.
- 20-day average share volume is only ≈362,000 shares (≈$17–18M of daily dollar volume).
- Institutional ownership is 98.39% — the float is effectively controlled by funds.
- Short interest is ≈4.6% of float and rose ≈8.4% in the prior month.
- Expect a wide-strike, wide-spread option chain. Thin small-cap options can have wide bid/ask spreads — use limit orders, not market orders, and don't expect to fill size instantly.
💰 The Option Flow Breakdown
The Tape (August 10, 2026 @ 11:47:53):
| Time | Buy/Sell | Call/Put | Expiration | Premium | Strike | Volume | OI | Size | Spot | Option Price | Option Symbol | Order Type | Strategy |
|---|---|---|---|---|---|---|---|---|---|---|---|---|---|
| 11:47:53 | BUY | PUT | 2026-09-18 | $1.60M | $50 | 4,500 | 0 | 4,500 | $48.53 | $3.55 | ROCK20260918P50 | BTO | Long Put (slightly ITM) |
🤝 Mechanism: floor block. This printed as a manually negotiated block on the exchange floor — a known counterparty took the other side. No urgency verbs apply here; this wasn't someone slamming the offer on a lit screen, it was a desk positioning size.
✅ RESOLVED — Exactly 4,500, Exactly as Predicted
Updated 2026-08-11 pre-market. Resolving OPRA snapshot timestamped August 11 (reflects the August 10 close); baseline is the August 10 snapshot (reflects August 7 — before these prints).
| Leg | Baseline (Aug-10) | Resolving (Aug-11) | Δ | Print size | Δ as % | Day vol | Our published prediction | Verdict |
|---|---|---|---|---|---|---|---|---|
| Sep-18 $50 put (bought) | 0 | 4,500 | +4,500 | 4,500 | +100.0% | 4,500 | ≈4,500 | ✅ OPEN (BTO) — exact |
This is the one leg on the entire board that resolved to the contract. Open interest went from 0 to exactly 4,500 — matching the print size, the day's volume, and our published prediction perfectly. Every contract traded created a new open contract; nothing was closed, nothing transferred.
As flagged, there was never an open-versus-close question here — zero prior open interest makes the answer arithmetic rather than inference. The snapshot simply confirms it.
🤓 What This Actually Means — Plain English
Buying a put is a bet the stock goes down (or protection against a stock you own going down). But this isn't a cheap, far-out-of-the-money lottery ticket — read the strike carefully.
- Spot was $48.53. The strike is $50. That makes this put slightly in-the-money — it's already worth something if exercised today.
- Of the $3.55 paid per contract, ≈$1.47 is intrinsic value (the built-in $50 − $48.53 difference) and ≈$2.08 is time value — what the buyer is paying for ≈39 days of "the stock could keep falling" optionality.
- Total cost: $1.60M for 4,500 contracts (450,000 shares of exposure).
- Breakeven at expiration ≈$46.45 ($50 strike − $3.55 paid). Below that, the position profits dollar-for-dollar; above it, the buyer loses some or all of the premium; if ROCK is above $50 at expiry, the put expires worthless and the full $1.60M is lost.
- Because it's near-the-money rather than deep OTM, this behaves more like a directional stock-substitute with a floor on the loss than a pure speculative flyer — it moves close to 1-for-1 with the stock below $50 but caps the downside at the $1.60M premium paid, unlike shorting stock outright.
The order-type label is BTO (Buy to Open) with high confidence — the zero-OI history proves it, not just the classifier's default inference.
What's likely driving this: ROCK just gave back its entire +14.15% post-earnings pop in three trading days (August 5 spike to $54.86, now back to ≈$48.85). Guidance was only maintained, not raised, despite beating on both lines. Agtech backlog is down 34% year over year. Residential and Infrastructure margins each compressed ≈460 basis points. And the balance sheet carries ≈$1.2B of net debt against just $20.6M of quarterly interest expense headroom. A trader positioning for continued softness — or a holder hedging a long position through a housing-data-heavy September — both fit this print. The tape cannot tell us which; see Honest Limits below.
📈 Technical Setup / Chart Check-Up
YTD Chart
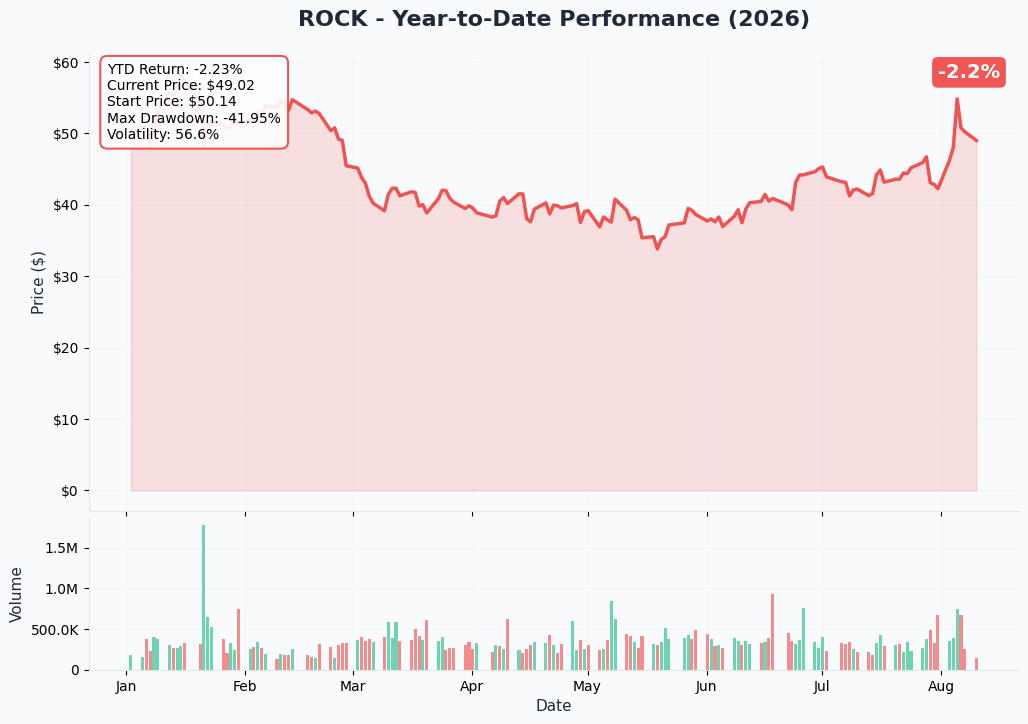
ROCK is basically flat on the year (started 2026 at $49.44, now ≈$48.85) but that hides a wild round trip: a slide toward a 52-week low of $33.56, a sharp rally into earnings (+9.86% June 24, +9.44% Aug 3, +14.15% Aug 5 to $54.86), and then a hard fade (−7.44% Aug 6, drifting to ≈$48.85 today). The stock sits above both its 50-day ($42.88) and 200-day ($46.52) moving averages, but it has now failed twice to hold above $50.
Gamma-Based Support & Resistance Analysis
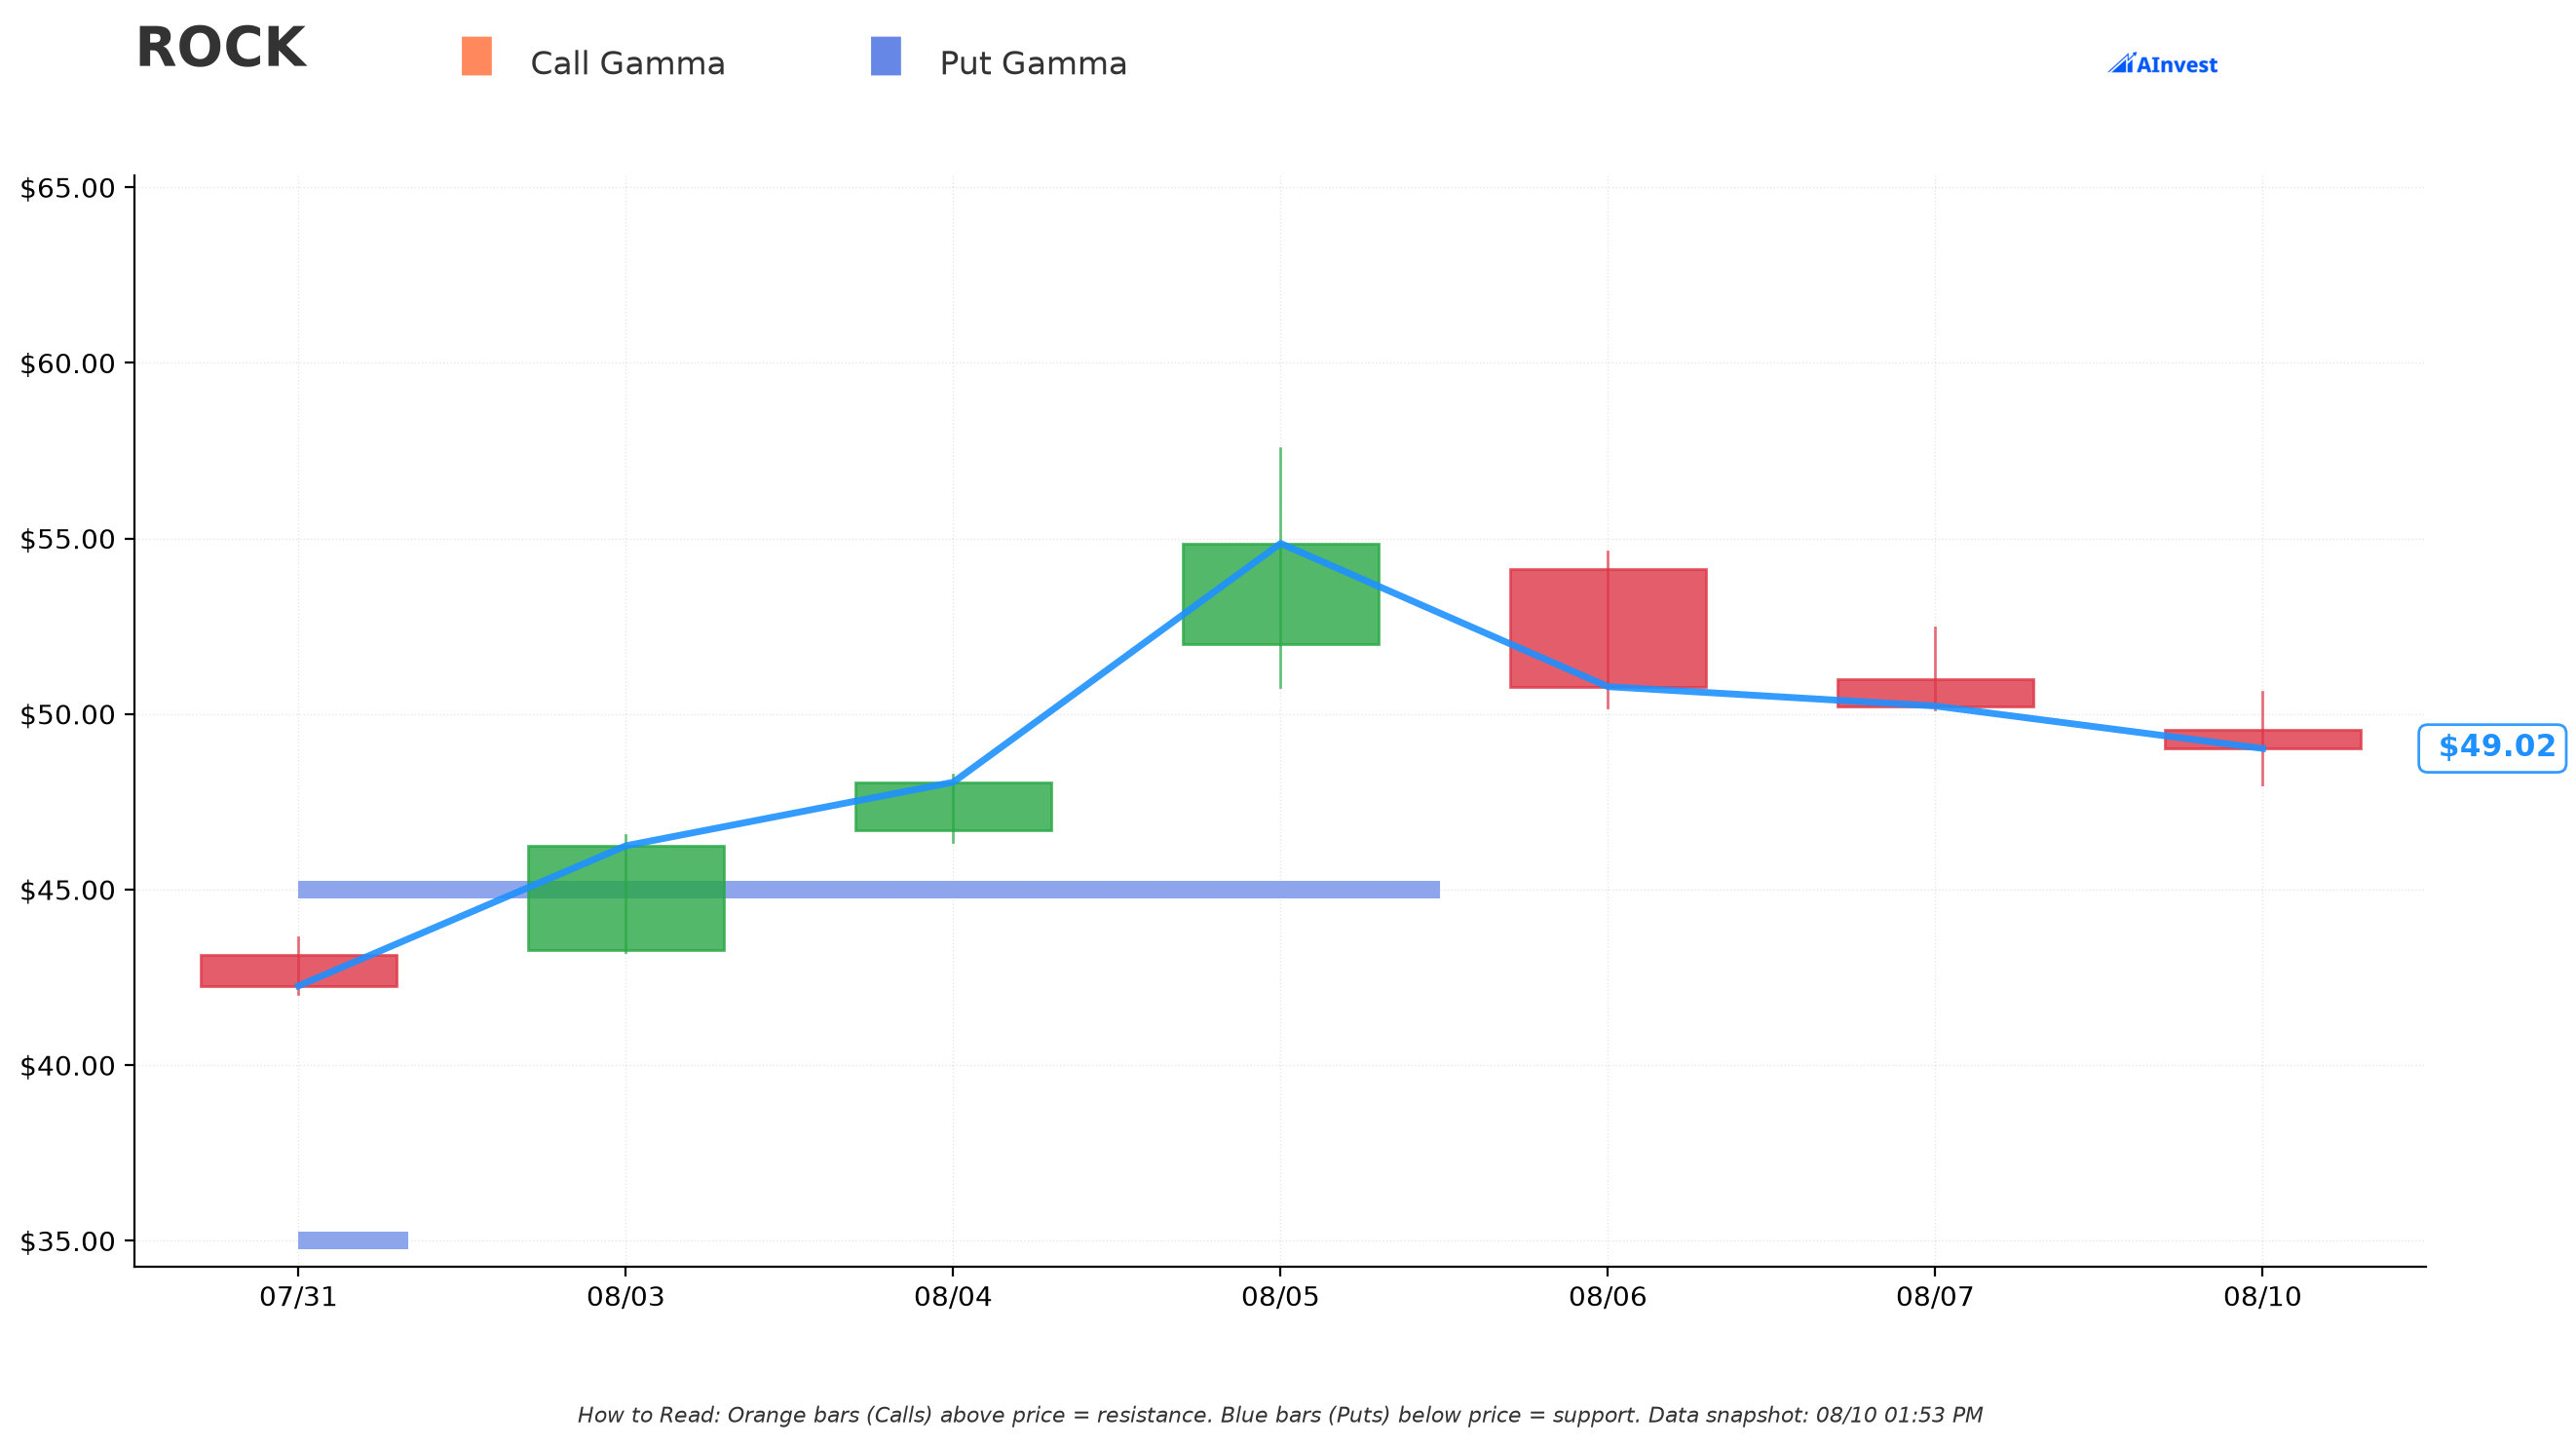
Be honest about this one: the data here is thin. ROCK's option chain only shows meaningful gamma exposure at two strikes — $35 (total gamma ≈0.13, almost entirely put-side) and $45 (total gamma ≈1.37, also almost entirely put-side). There is no identified call/put wall or hedge-wall level for this name in today's snapshot — the file returns empty support/resistance lists. That's a direct consequence of the thin options market described above: not enough open interest across the chain to build a reliable gamma map. Don't lean on gamma levels for ROCK today — the implied-move numbers below are the more trustworthy read.
Implied Move Analysis
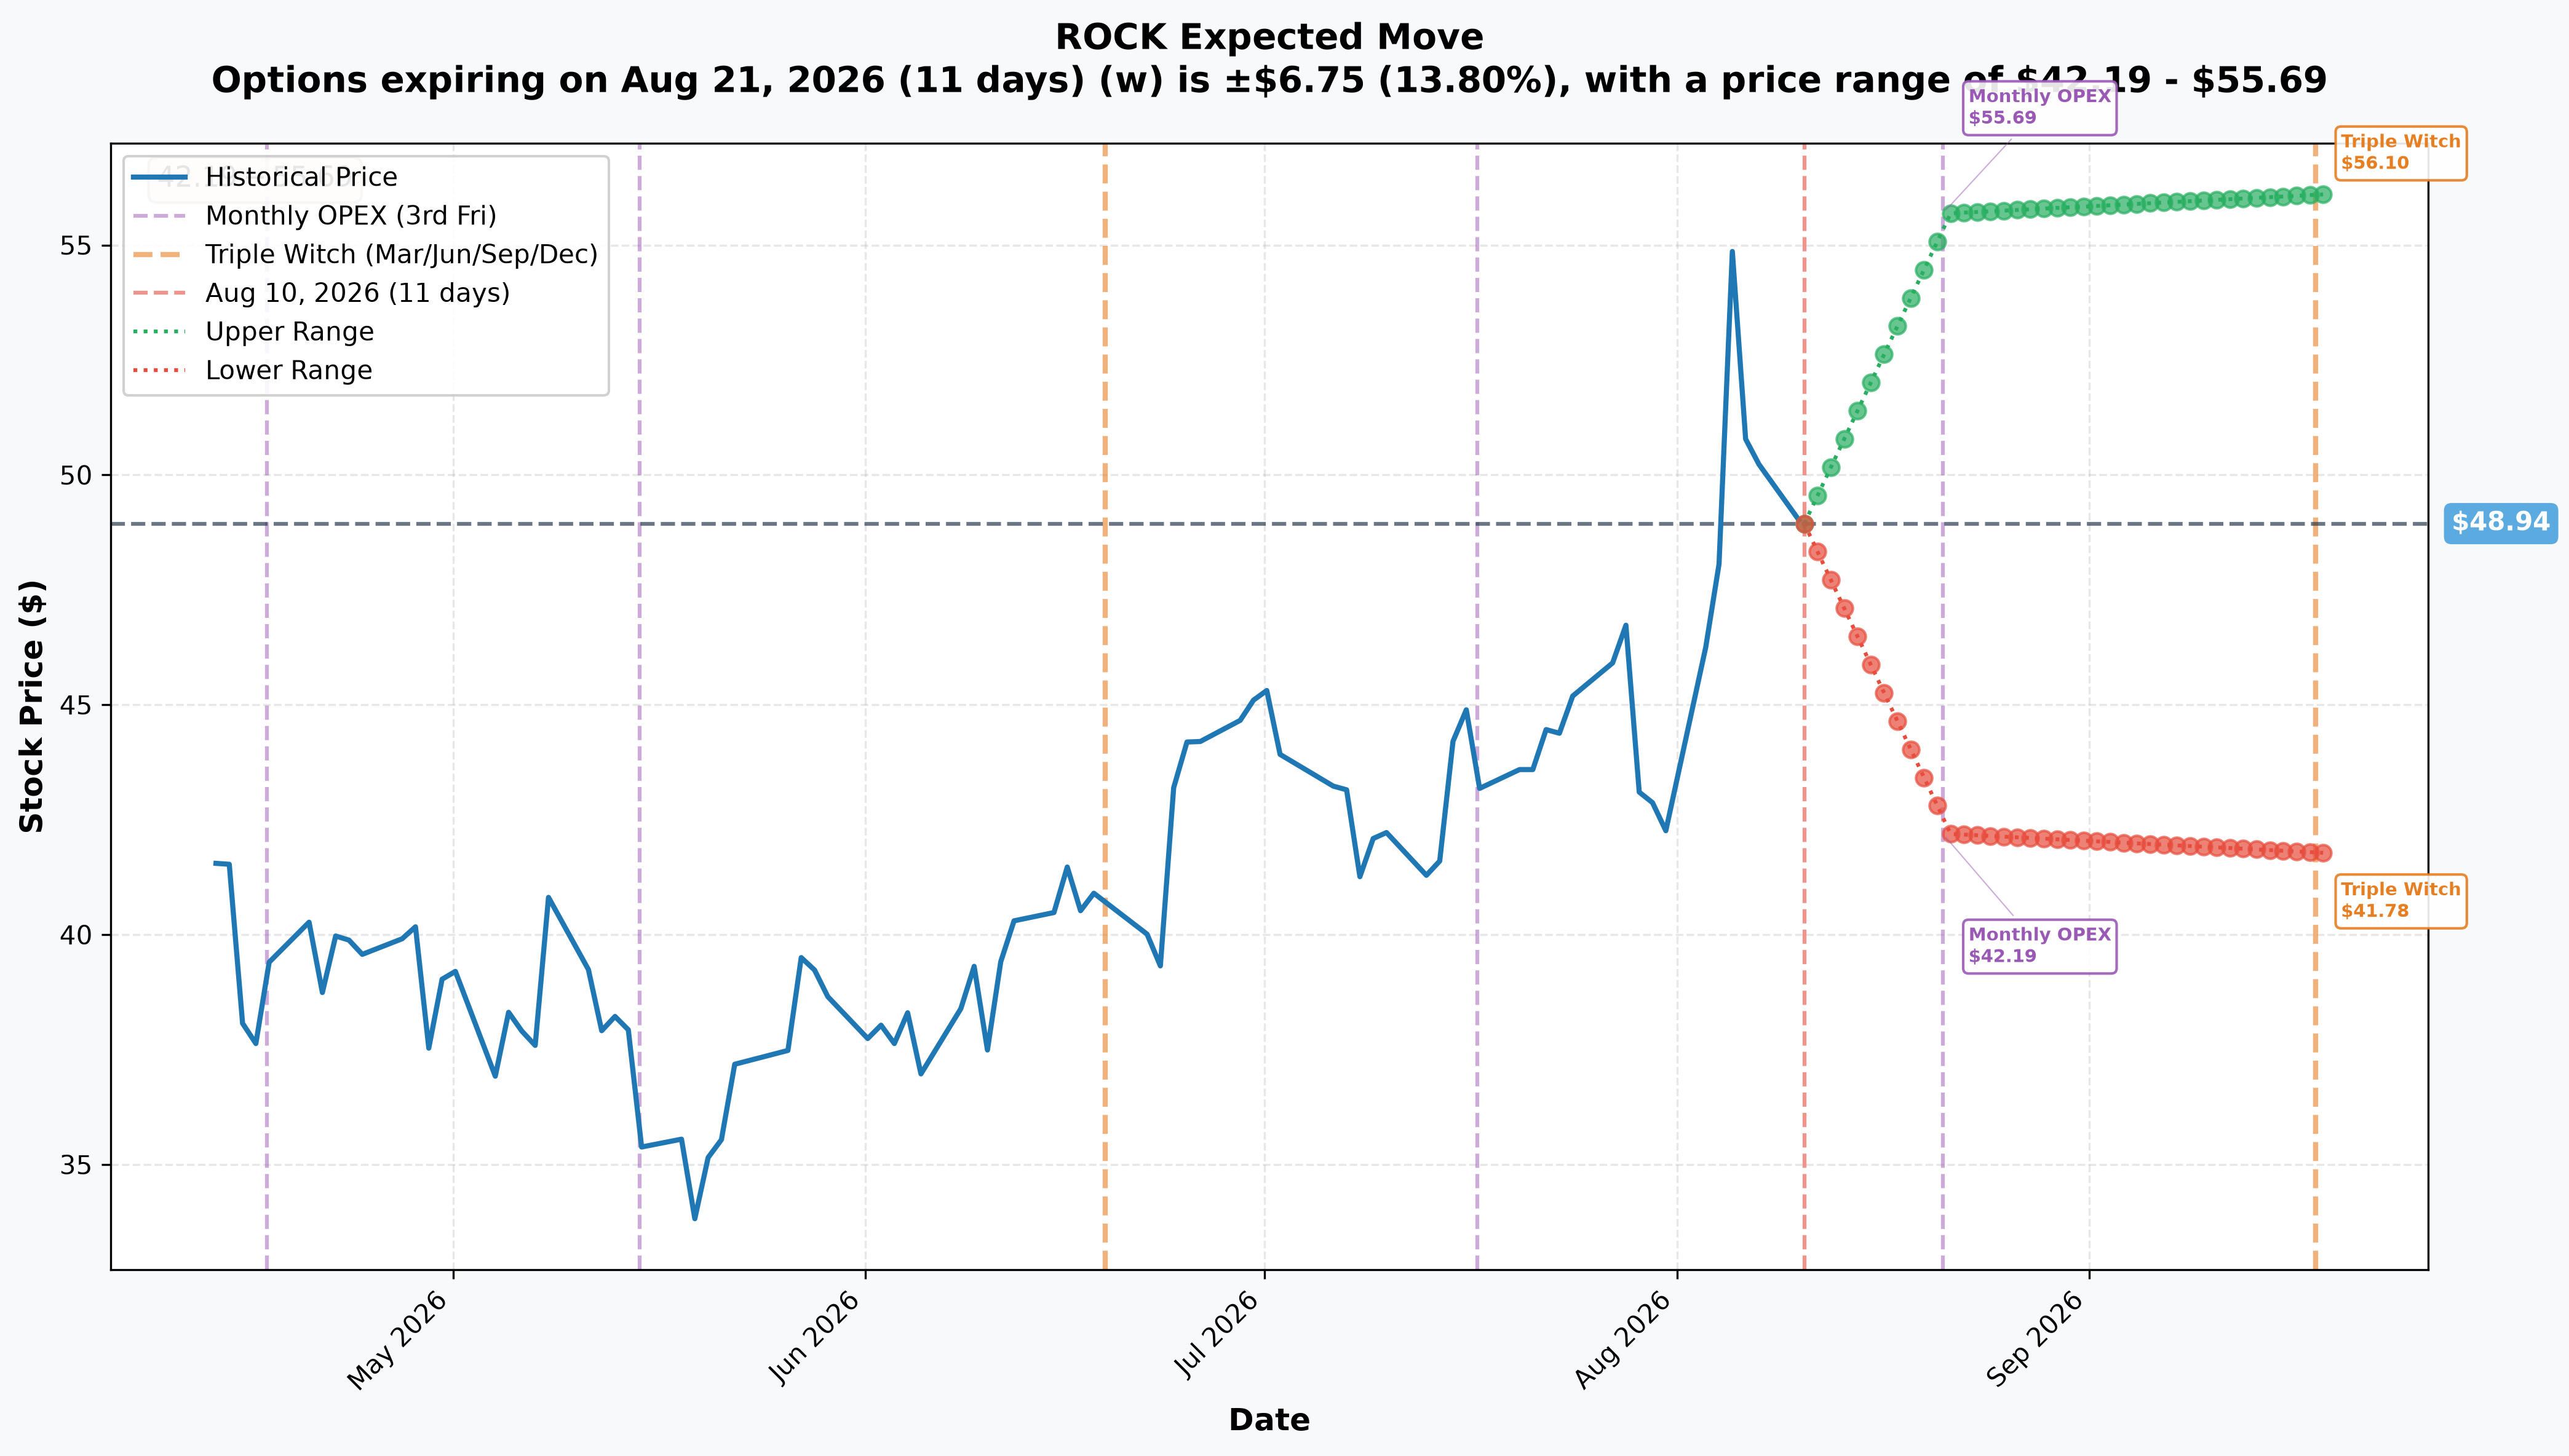
For the September 18, 2026 expiration — the same one this trade uses, 39 days out — the options market is pricing an implied move of ≈14.63%, or ≈$7.16, putting the expected range at roughly $41.78 to $56.10 around a ≈$48.94 current price. For context, the nearer August 21 monthly expiration (11 days out) prices a ≈13.8% move ($42.19–$55.69) — nearly as wide as the September number despite being a month shorter, a reflection of just how volatile this name has been recently.
What this means for the put: the $50 strike sits comfortably inside the priced-in range, and the $46.45 breakeven is well within the $41.78–$56.10 implied window — the market is already pricing moves large enough to make this trade profitable without requiring an outsized surprise.
🎪 Catalysts
🔴 The decisive fact: there is NO company catalyst inside this trade's 39-day window
Gibraltar reported Q2 2026 on August 5, 2026 — five days before this trade, and a genuine beat on both lines: revenue of $509.5M vs. $472.09M consensus, adjusted EPS of $1.11 vs. $1.02 consensus (per MarketBeat's earnings history). But full-year guidance was only reaffirmed, not raised (per the Q2 2026 results release), and the stock has since round-tripped its entire earnings pop.
The next quarterly report, Q3 2026, is estimated for ≈October 29, 2026 (per MarketBeat) — that is 41 days AFTER the September 18 expiration. Do not confuse a catalyst date with an expiration date here: this put expires in a genuine earnings-free gap.
🟢 What actually falls inside the window (all macro, no company events)
- September 15–16, 2026 — FOMC meeting with Summary of Economic Projections (Federal Reserve calendar). Rate expectations flow directly to mortgage rates, and Residential is now ≈84% of ROCK's business.
- September 17, 2026, 8:30 a.m. ET — Census New Residential Construction (housing starts + permits, August data), landing just one day before this option expires (Census release schedule). That's a notably tight fit if housing data is the actual trigger for this position.
- Housing sentiment backdrop is already soft: the NAHB/Wells Fargo Housing Market Index fell to 34 in July, with 37% of builders cutting prices and 63% using incentives — matching management's own "flat-to-down market" language from the Q2 release.
🔴 Outside the window (excluded from this expiry)
New Residential Sales (Sep 24), the next housing-starts print (Oct 20), the October 27–28 FOMC meeting, Q3 earnings (≈Oct 29), and further housing data through year-end all fall after September 18. If someone wanted earnings exposure, they would have bought a later expiration — choosing September 18 specifically excludes the next print, which is informative about intent even if not proof of it.
Background: why the balance sheet matters right now
Q2's revenue and EPS beat came with Residential and Infrastructure margins each compressing ≈460 basis points, and Agtech backlog down 34% year over year — the clearest forward-looking negative in the quarter (Q2 release). Net debt sits at ≈$1.2B against $20.6M of quarterly interest expense — leverage from the OmniMax acquisition that closed February 2, 2026. On this balance sheet, a housing slowdown gets amplified, not absorbed.
🎲 Price Targets & Read-Through
Because the gamma map is empty for ROCK, the implied-move range is the more reliable framework here:
- Bear case / put profit zone: below $46.45 breakeven, moving toward the implied-move floor of ≈$41.78. A revisit of housing-data-driven weakness or a continued fade from the earnings spike gets there.
- Base case: ROCK chops in the $45–$52 area between now and expiration — inside the implied range but above breakeven, where the put loses partial-to-full value.
- Bull case: a bounce back toward or above the $55–$56 area (near the implied-move ceiling and the post-earnings spike high of $54.86) — the put would expire worthless.
💡 Reader Interpretation — Four Angles
🎰 YOLO Trader
You're looking at a stock-substitute put, not a lottery ticket — it's slightly ITM, so it moves close to dollar-for-dollar with the stock below $50, with a hard-capped loss (unlike shorting shares outright). If you want to mirror this exact trade, the September $50 put costs roughly $3.55/contract at today's print — expect a wider spread given ROCK's thin options market, so use a limit order. Understand you need the stock below ≈$46.45 by September 18 just to break even, and there's no earnings catalyst to force the move — this is a bet on macro housing data and continued mean-reversion, nothing more.
🌊 Swing Trader
The setup is coherent for a housing-data or technical-fade thesis: ROCK is above its 50-day average by a wide margin, has failed twice at $50, and the only scheduled events before expiry are the September 15–16 FOMC and the September 17 housing-starts release one day before expiration. If you're playing this directionally, consider a defined-risk put spread (e.g., buy the $50 put, sell a $45 put) rather than the outright long put — it lowers your cost and breakeven while still expressing the same view, and softens the impact of ROCK's wide bid/ask spreads.
💰 Premium Collector
Selling premium against a name with only two strikes showing meaningful gamma and a thin, wide-spread chain is risky — you're being compensated less than the true tail risk given how volatile ROCK has been (four separate ±7%+ single-day moves in the last six weeks). If you want to collect premium here, do it in small size and demand extra credit for the illiquidity; this is not a name to run a mechanical wheel or iron condor strategy on casually.
🌱 Beginner
Skip this one, or paper-trade it first. Three reasons: (1) ROCK's options market is thin — wide spreads mean you can lose money just entering and exiting, even if you're right on direction; (2) there is no earnings catalyst in this window, so the "why now" is entirely a macro housing bet, which is harder to have an edge on than a company-specific event; (3) a $1.60M institutional trade doesn't mean the buyer is right — it just means someone with size has a view. Watch how ROCK trades around the September 15–16 FOMC and the September 17 housing-starts data before committing real capital.
⚠️ Honest Limits — What the Tape Cannot Prove
- Motive is unknown. The tape proves size, price, mechanism (floor block), and — uniquely for this trade — a certain open. It cannot tell us whether this is a directional bearish bet, a hedge against an existing long stock or call position, or a housing-sector macro trade unrelated to a fundamental view on Gibraltar specifically.
- No paired stock or option leg was found. This printed as a single-leg structure; if the buyer is also long stock or calls elsewhere, that hedge is invisible to this tape.
- Broker/counterparty identity, customer type, and order intent are not disclosed by OPRA — we cannot say if this is a hedge fund, a corporate insider-adjacent hedge, or a directional speculator.
- Thin coverage compounds the uncertainty. Only four analysts cover ROCK, targets range from $55 to $86 (a 56% spread), and the average $75.25 target is built on just three published numbers — treat any consensus view on this name skeptically.
- Thin options data: the gamma exposure file shows meaningful open interest at only two strikes with no identified support/resistance walls — we are not going to invent gamma levels that the data doesn't support. Combined with ≈$17–18M of daily share-dollar volume, expect wide bid/ask spreads on this chain; slippage on entry and exit can meaningfully affect real-world returns versus the theoretical numbers above.
Disclaimer: Options trading involves substantial risk of loss and may not be suitable for all investors. This analysis is for educational purposes only and is not financial advice. A single institutional trade — even one with a certain open-interest read — does not predict future price movement. ROCK's thin analyst coverage, thin share volume, and thin options market all argue for smaller position sizing and patient, limit-order execution. Always do your own research and consider consulting a licensed financial advisor before trading.
Last updated: 2026-08-11 (pre-market) — the next-day OPRA open-interest snapshot resolved this session's provisional flags. Sep-18 $50P 0 → 4,500 (+4,500): OPEN (BTO) — exact to the contract, matching print size, day volume and the published prediction. The ⏳ callout was replaced with the ✅ RESOLVED box.