🔄 RTX's $139.9M Call Roll That Actually Cost ≈$486K — A Desk Buys Two Extra Months of the Same Deep-ITM Exposure
📅 2026-08-11 | 🤝 Floor Block Detected
🔄 Updated 2026-08-12 pre-market — the next-day OPRA open interest confirmed the roll on both legs. The February 2027 $125 calls opened from a standing start (0 → 6,952, three contracts above the 6,949-lot print), and the December $125 calls closed (7,074 → 2,021, −5,053). Both branches landed on the side we published. The roll is real: December exposure retired, February exposure created, same strike, two extra months. One nuance — the December close covered 73% of the print rather than the ≈125 residual a full close implies, so ≈1,896 more December contracts survive than a clean 1-for-1 unwind would leave. See the ✅ RESOLVED box.
🎯 The Quick Take
At 10:06:05 ET, a desk in RTX crossed ≈$139.9 million of gross options premium in one negotiated package — selling 6,949 December-2026 $125 calls and simultaneously buying 6,949 February-2027 $125 calls, same strike, same size, two different expirations.
That is a textbook calendar roll: keep the exact same deep-in-the-money exposure, just push it two months further out. Because both legs are ≈$99 in the money, almost all of that $139.9M was intrinsic value moving hands — the net cost of extending the position was only ≈$486,430, or roughly 70 cents a share. This trade tells us almost nothing about direction and everything about time horizon.
🏢 Company Overview
RTX Corporation (NYSE: RTX), formerly Raytheon Technologies, is an aerospace and defense company providing systems and services across commercial, military and government sectors, operating through the Collins Aerospace, Pratt & Whitney and Raytheon divisions. It sits in the Industrials sector, Aerospace & Defense industry.
- Market cap: ≈$301.7 billion (statistics page shows $301.66B, quote page $301.45B, a secondary source $301.84B) — statistics · second source
- Collins Aerospace: Q2 2026 sales $8.2B, +8%, commercial OE +26% / commercial aftermarket +10%
- Pratt & Whitney: Q2 2026 sales $8.9B, +16%, commercial aftermarket +25% (commercial OE −8% on mix)
- Raytheon: Q2 2026 sales $8.3B, +18%, adjusted operating profit +29% on Patriot and Standard Missile demand
All segment figures from the Q2 2026 results release. Backlog stood at $289 billion ($170B commercial / $119B defense), up from $271 billion at Q1 2026. The stock closed $224.00 on August 11, 2026 against a 52-week range of $150.61–$226.88 — it is pressing a fresh high, up ≈44.8% over the trailing year.
💰 What Just Happened
📊 The Trade, in Plain English
One package, one timestamp, two legs:
- 🔴 SOLD 6,949 December 18, 2026 $125 calls at $100.33 — ≈$69.72M collected
- 🟢 BOUGHT 6,949 February 19, 2027 $125 calls at $101.03 — ≈$70.21M paid
Same underlying strike ($125), same size (6,949 contracts), same moment (10:06:05 ET). The desk didn't change its bet on RTX at all — it just traded out of the near-dated contract and into the same exposure two months later. That's a calendar roll, and it printed as a 🤝 floor block — a manually negotiated trade worked between brokers on the exchange floor with a known counterparty, not a lit-market sweep. No urgency signal belongs anywhere near this trade.
📋 Full Trade Details
| Time | Buy/Sell | Call/Put | Expiration | Premium | Strike | Volume | OI | Size | Spot | Option Price | Option Symbol | Order Type | Strategy |
|---|---|---|---|---|---|---|---|---|---|---|---|---|---|
| 10:06:05 ET | SELL | CALL | 2026-12-18 | ≈$69.72M | $125 | 6,900 | 7,074 | 6,949 | $224.42 | $100.33 | RTX20261218C125 | ✅ STC — close confirmed 2026-08-12 (OI 7,074 → 2,021) | Same-Strike Calendar Roll Out (Dec → Feb) |
| 10:06:05 ET | BUY | CALL | 2027-02-19 | ≈$70.21M | $125 | 6,900 | 0 | 6,949 | $224.42 | $101.03 | RTX20270219C125 | BTO (confirmed open) | Same-Strike Calendar Roll Out (Dec → Feb) |
Gross premium traded: ≈$139.9M. Net debit: ≈$486,430 (≈$0.49M) — that net figure, not the $139.9M gross, is the real headline number and the one that should anchor any dollar comparison for this trade.
✅ RESOLVED — The Roll Is Confirmed on Both Legs
Updated 2026-08-12 pre-market. Resolving OPRA snapshot timestamped August 12 (reflects the August 11 close, after this print); baseline is the August 11 snapshot (reflects the August 10 close, before this print).
| Leg | Baseline (Aug-11) | Resolving (Aug-12) | Δ | Print size | What we published | Verdict |
|---|---|---|---|---|---|---|
| Feb-19-2027 $125 call (bought) | 0 | 6,952 | +6,952 | 6,949 | "jump from 0 to somewhere near 6,949" | ✅ OPEN (BTO) — +3 above the print |
| Dec-18 $125 call (sold) | 7,074 | 2,021 | −5,053 | 6,949 | "falls toward or near ≈125 … confirms a close riding alongside the new February open" | ✅ CLOSE (STC) — 73% of size |
Both branches resolved the way the roll thesis required, which is the strongest form of confirmation this check produces. The February leg opened from literal zero — there was no pre-existing position for it to close against, and open interest now matches the print to within three contracts. The December leg fell, which rules out the alternative we named ("if OI instead stays roughly flat or rises, that would mean today's sale opened a new short call position instead — a different and more aggressive trade"). It did not stay flat. This was a genuine same-strike calendar roll out.
One honest refinement on magnitude. We predicted December open interest would fall "toward or near ≈125 contracts" — a clean 1-for-1 unwind of the entire strike. It landed at 2,021. So 5,053 contracts retired and roughly 1,896 of the sale transferred to a buyer who was opening rather than closing. The practical consequence is small but worth stating: December $125 open interest was not emptied out, and ≈2,021 contracts still sit at that strike into the December expiration. The roll itself is unaffected — what changes is only how much of the old line disappeared.
Nothing in the direction, cost or thesis below needs revision.
🤓 What This Actually Means — Plain English
A calendar roll is "same bet, new expiration date." Picture someone who already owns a position that behaves almost exactly like 694,900 shares of RTX stock (6,949 contracts × 100 shares, at a call this deep in the money). They're not selling because they think RTX is going down, and they're not buying more because they suddenly turned more bullish. They're doing something much more boring: swapping a December ticket for a February ticket on the identical position, because they want that same exposure to last two extra months.
Why did it cost almost nothing? This is the best number in the whole trade. With spot at $224.42 and the strike at $125, every one of these calls carries $99.42 of intrinsic value — pure "money already made if exercised today," with zero speculation baked in. The December call priced at $100.33, meaning it carried only $0.91 of extra "time value" above intrinsic. The February call, with two extra months of time until expiration, priced at $101.03 — only $1.61 of time value. The entire roll cost was the difference between those two thin time-value slivers: ≈70 cents per share, ≈$486,430 total, on $139.9M of gross trading. A call this deep in the money is a stock substitute — it moves almost dollar-for-dollar with the shares, without tying up the capital of actually owning 694,900 shares outright.
Buying more time is not the same as buying more direction. Nothing here signals a new bullish (or bearish) view on RTX. What it does signal is that whoever holds this position wanted it to survive past December 18, 2026 and into February 19, 2027 — which, as the catalyst section below lays out, is a specific and identifiable stretch of calendar. Rolls like this are typically about avoiding a near-dated expiration wiping out a long-held, deep-ITM position (financing, tax, or simply "I'm not ready to be flat yet"), not about placing a fresh directional wager.
📈 Technical Setup — Where RTX Sits Right Now
YTD Chart
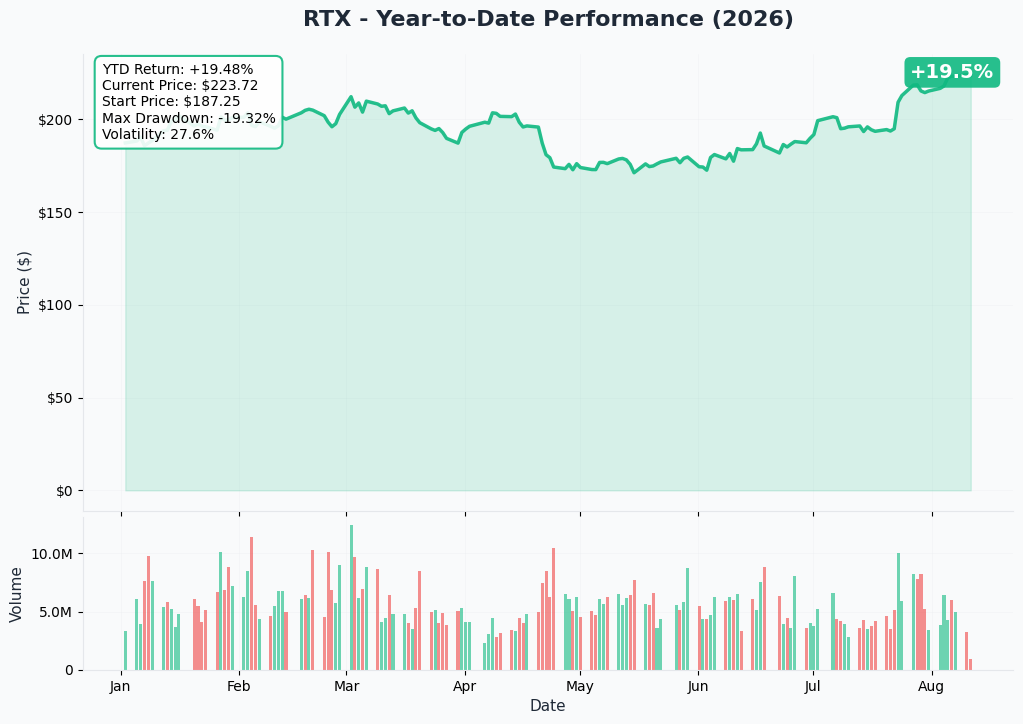
RTX has run from $174.41 on June 1, 2026 to $224.00 on August 11, 2026 — ≈+28.4% in about ten weeks, with roughly half of that move concentrated around the July 23, 2026 Q2 earnings beat (+7.3% in a single session, $194.88 → $209.16). The stock is now trading just below its 52-week high of $226.88.
🔵🟠 Gamma-Based Support & Resistance
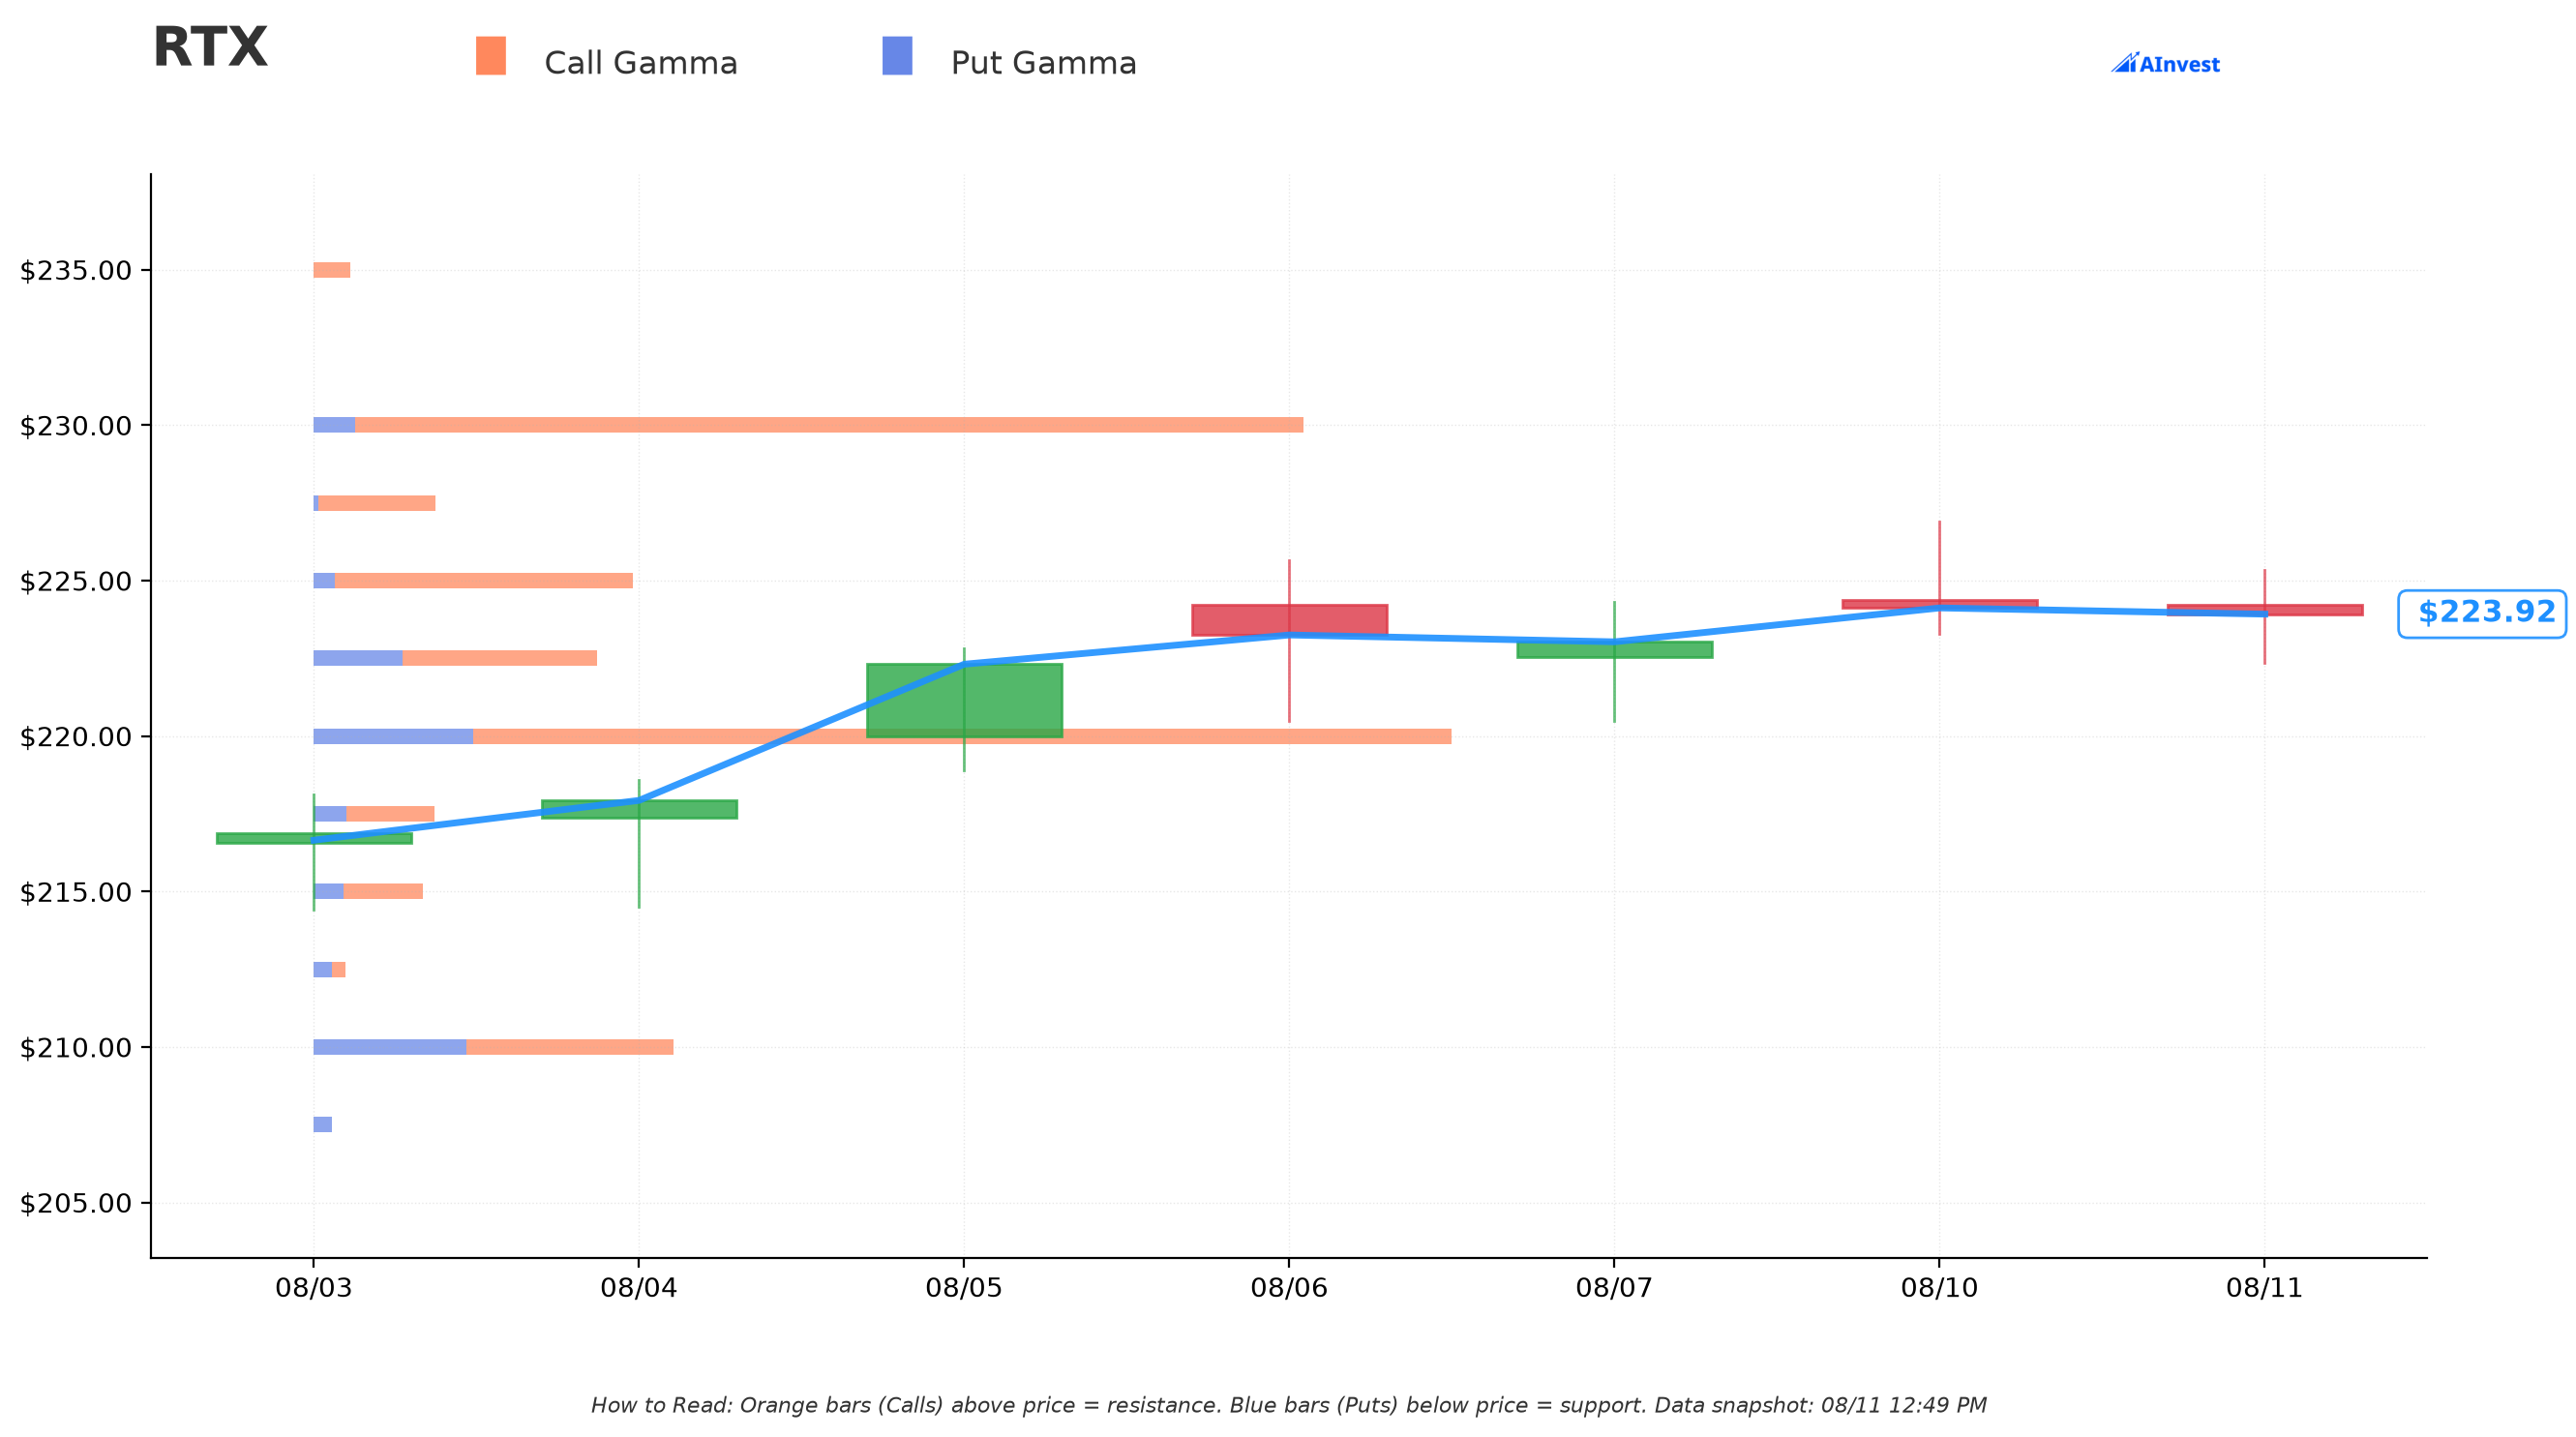
With spot at $223.93, the options market shows two well-defined walls:
- 🔵 Support: $220 (Strong) — ≈1.8% below spot, total gamma exposure 7.32, mostly call-side (6.29 call vs 1.03 put)
- 🟠 Resistance: $230 (Strong) — ≈2.7% above spot, total gamma exposure 6.37 (6.10 call vs 0.26 put)
- 🟠 Secondary resistance: $240 (Moderate) — ≈7.2% above spot, total gamma exposure 2.15
Read these levels with a grain of salt for this specific trade. A $125 call this deep in the money has a delta near 1.0 — it trades almost like the stock itself. Gamma walls built around dealer hedging at $220/$230/$240 matter enormously for short-dated, near-the-money traders, but they have little bearing on how this particular deep-ITM roll behaves. We're including them here as the standard technical backdrop for RTX shares, not as a read on this trade.
🎯 Implied Move
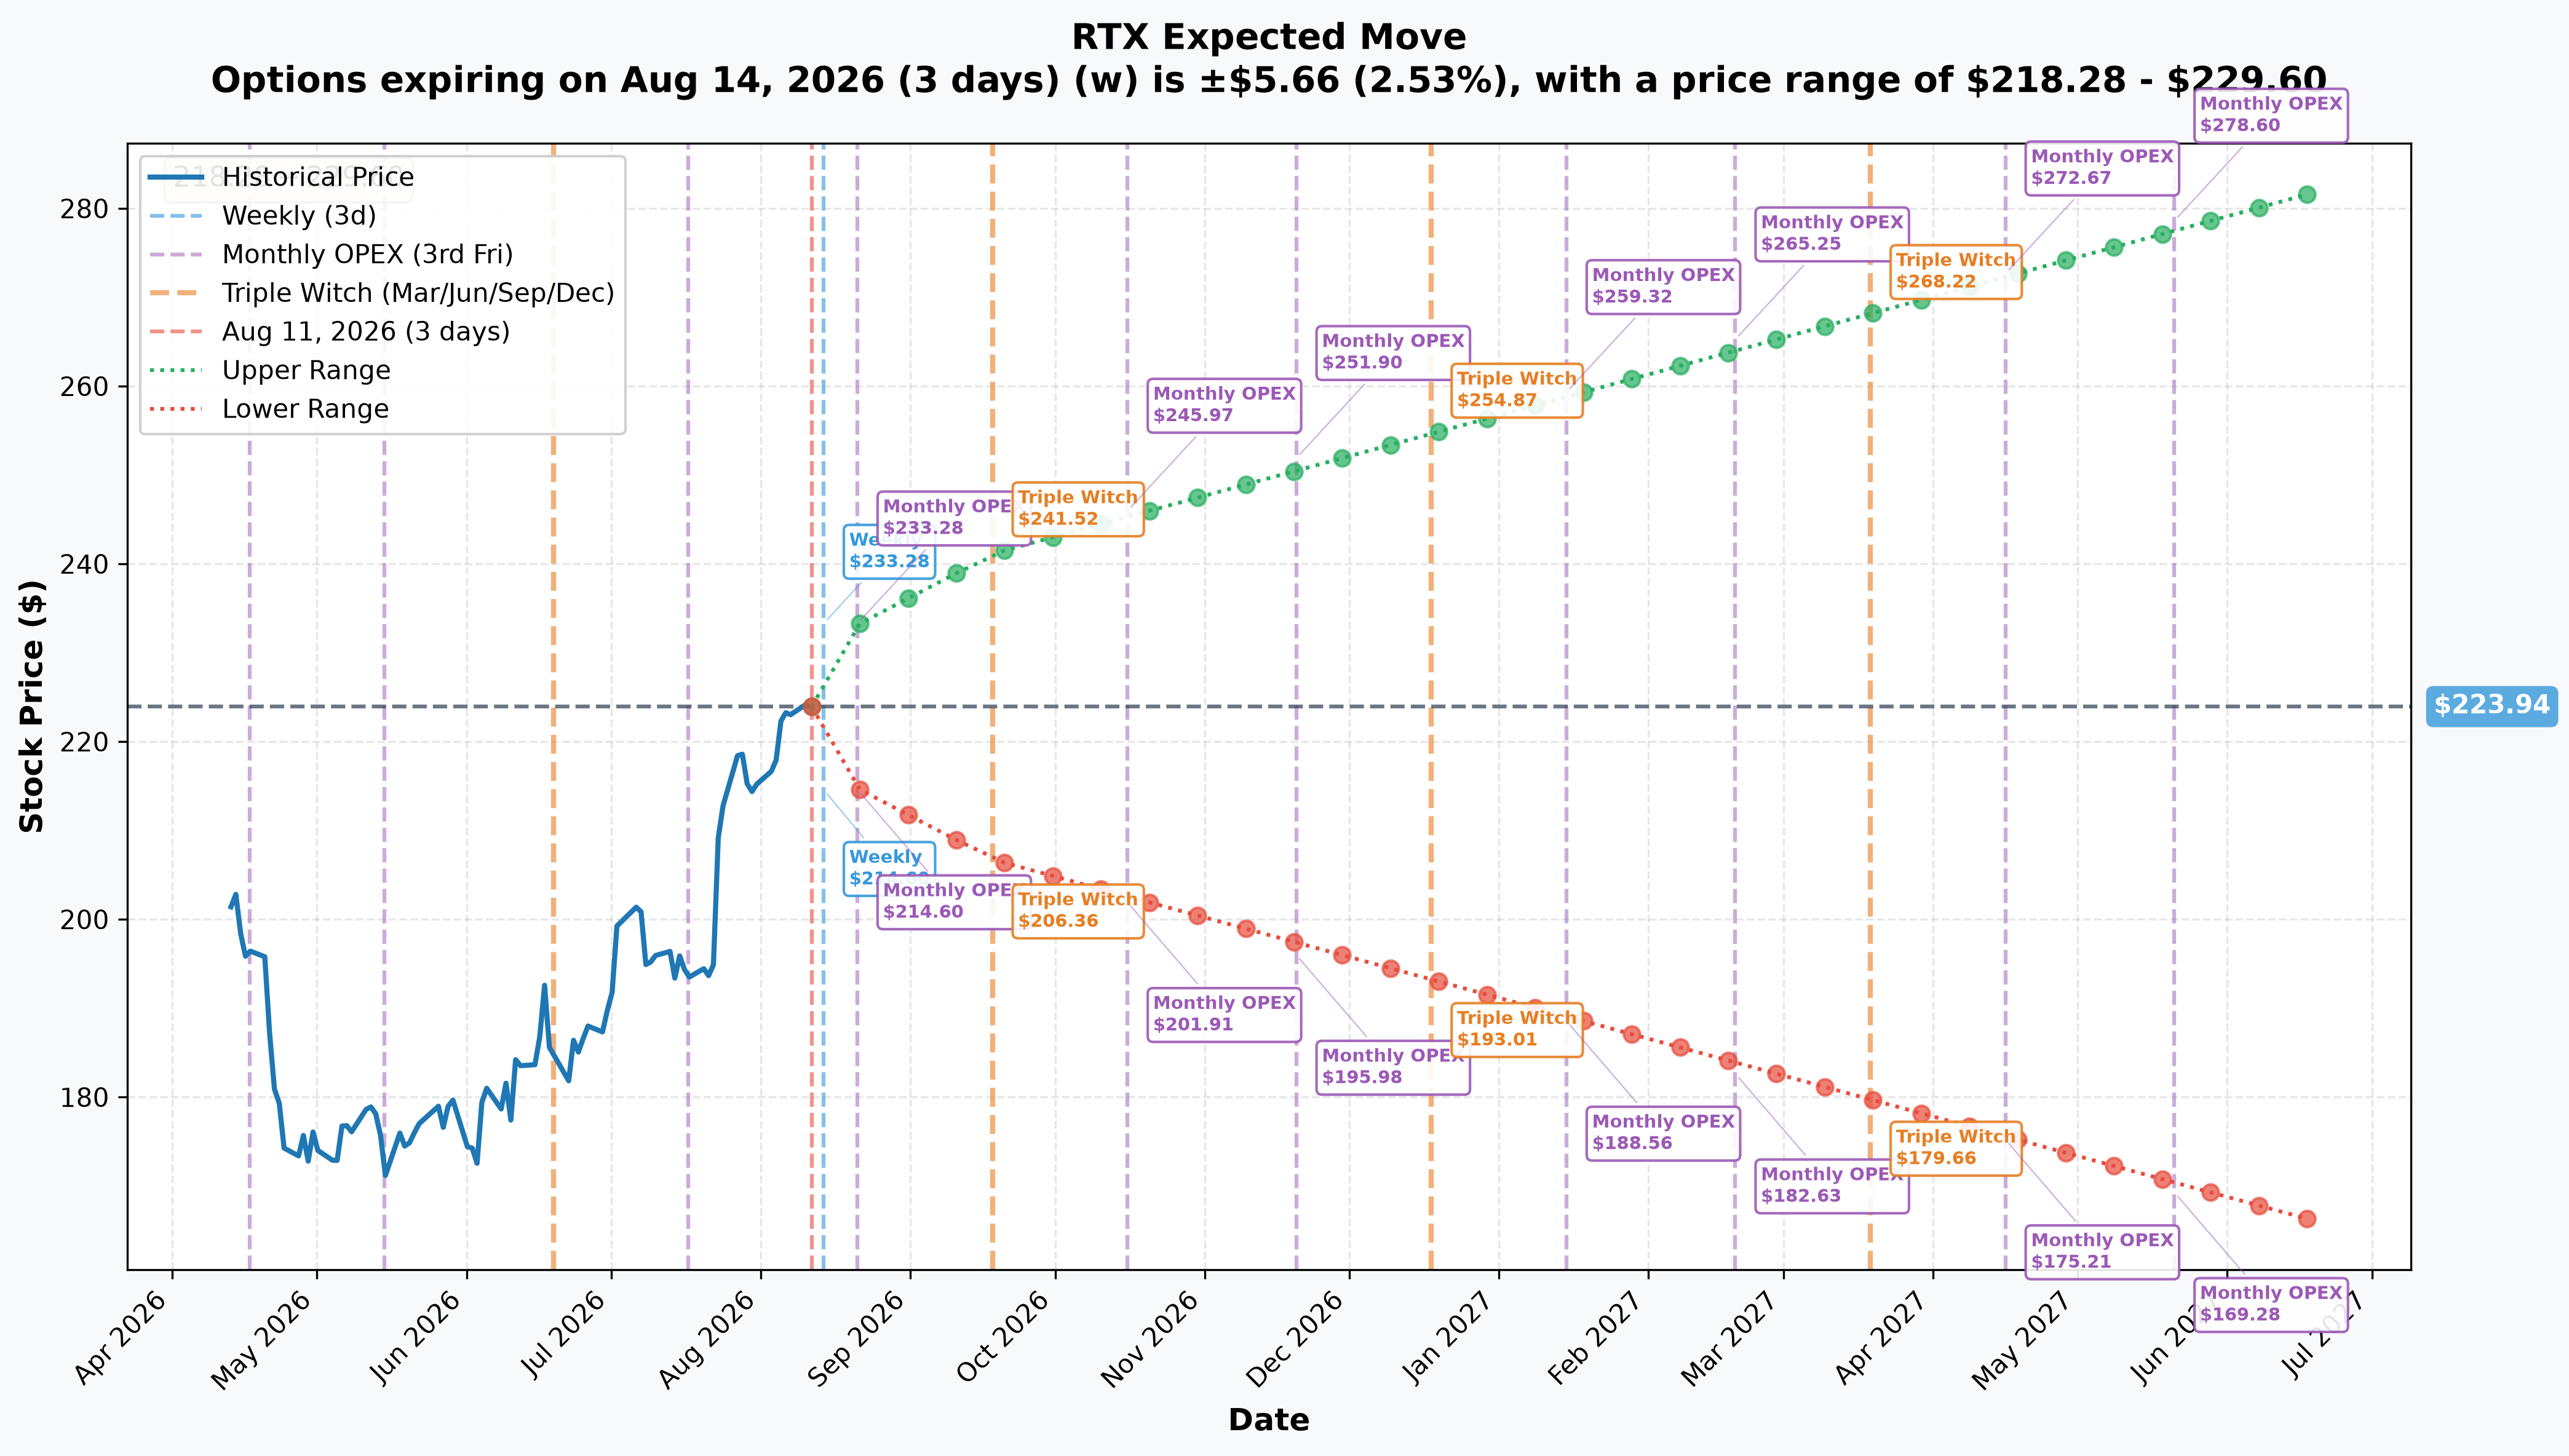
Standard-horizon implied moves off the current $223.94 spot:
| Horizon | Expiry | Days | Implied Move | Range |
|---|---|---|---|---|
| Weekly | 2026-08-14 | 3 | ±2.53% ($5.66) | $218.28 – $229.60 |
| Monthly OPEX | 2026-08-21 | 10 | ±4.17% ($9.34) | $214.60 – $233.28 |
| Quarterly (Triple Witch) | 2026-09-18 | 38 | ±7.72% ($17.28) | $206.66 – $241.22 |
| LEAPS | 2027-06-17 | 310 | ±25.74% ($57.63) | $166.31 – $281.57 |
Zooming into the two expirations this specific trade actually uses: the options market prices a $193.01 – $254.87 range by December 18, 2026, and a $182.63 – $265.25 range by February 19, 2027. Both ranges sit comfortably above the $125 strike — this position is not going anywhere near being at-the-money under any modeled scenario, which is exactly consistent with it being a stock-substitute position rather than a leveraged directional bet.
🎪 Catalysts — What Falls Inside the Extra Two Months
The roll's entire economic purpose is time: it trades a December 18, 2026 expiration for a February 19, 2027 one. Here is what sits where, with each date's confirmation status.
✅ Already Happened (last three months)
- Q2 2026 results, July 23, 2026: $24.7B sales (+14% reported, +16% organic), adjusted EPS $1.89 (+21%), full-year guidance raised to $95.0–$96.0B sales / $7.10–$7.25 adjusted EPS. Stock +7.3% same day.
- Three consecutive earnings beats: +$0.23 (Q2), +$0.26 (Q1), +$0.08 (Q4 2025) against consensus.
- A wave of contract awards over the summer, including a $1.8B SPY-6 radar extension, ≈$1.3B F135 sustainment award covering 42 bases, $1.1B AIM-9X missile production, and a £2B British Army training contract.
- Sell-side has moved decisively higher post-earnings: RBC to $250, Susquehanna to $245, TD Cowen to $240, Morgan Stanley reiterated $240, against a consensus target of $232.27 (23 analysts, Buy consensus).
📅 Inside Window A — now through Dec 18, 2026 (what the December leg still covered)
- Aug 14, 2026 — ex-dividend, $0.730 — company-confirmed.
- ≈Oct 20, 2026 — Q3 2026 earnings, before open — ESTIMATED, not company-confirmed. The source explicitly states RTX has not officially confirmed this date; it's inferred from historical cadence.
- Oct 1, 2026 — FY2027 begins, with a continuing resolution the expected bridge (confirmed statutory date; CR outcome is estimated).
- November 2026 — U.S. mid-term elections (confirmed statutory date).
📅 Inside Window B — Dec 18, 2026 through Feb 19, 2027 (the window the roll adds)
This is the whole point of the trade — the incremental two months buy exposure through:
- The Q4/FY2026 earnings report carrying initial FY2027 guidance — ESTIMATED for late January 2027, not company-confirmed. This is the single highest-information event in the entire window, since it's the first formal look at 2027 (current sell-side model: $103.14B revenue, $7.85 EPS).
- The likely landing zone for final FY2027 defense appropriations. Draft continuing resolutions imply passage only after the mid-term elections — putting the resolution of $10.9B Patriot, $10.5B THAAD, and $17.1B Golden Dome reconciliation funding squarely inside the February contract and outside the December one. As of August 10, 2026, three of four defense committees had endorsed the $1.1 trillion topline, but the Senate Appropriations Committee markup had not yet been released.
- An estimated ≈February 19, 2027 ex-dividend, extrapolated from the February 20, 2026 ex-date — falling essentially on the February expiration itself, and a standard early-exercise pressure point on any deep-ITM long call.
Bottom line on the roll's purpose: the only two incremental scheduled catalysts the extra two months buy are one unconfirmed earnings print with first FY2027 guidance, and one unscheduled binary appropriations outcome. Neither date is locked down. We can source what sits in the window; we cannot source — and won't guess at — why this specific holder wanted to own it.
👀 Four Ways to Read This Trade
🎰 YOLO Trader
There isn't much here for you, honestly. A 99-delta calendar roll on a $125 strike that's $99 in the money is about as far from a lottery ticket as options get — it's a stock substitute, not a lever. If you want convexity on RTX, this print isn't showing it to you; look at strikes closer to the money and shorter-dated if you want real leverage, and size it small given RTX just ran ≈28% in ten weeks.
📈 Swing Trader
The informational value here is the calendar, not the direction. Whoever holds this wanted exposure through the Q4/FY2026 print with first FY2027 guidance and through the FY2027 appropriations resolution — both landing in the December-to-February window. If you already have a swing thesis on RTX, this tells you which stretch of catalyst the "smart money" (or at least, one large position) decided was worth extending into. It does not tell you which way they think it resolves.
💰 Premium Collector
Nothing to harvest directly from this specific package — both legs are deep ITM with almost no extrinsic value left to sell (December had $0.91 of time value, February $1.61), so there's no fat premium sitting in these strikes for you to collect. If you're a premium seller on RTX, this print is more useful as a reminder that the options market is pricing very little time value into deep-ITM RTX calls right now, which tells you where NOT to sell covered calls if you want meaningful yield.
🌱 Beginner
This is a great real-world example of two concepts worth learning: intrinsic value (what an option is worth if you exercised it right now — here, $99.42) and time value (the extra sliver you pay for the chance something changes before expiration — here, less than $2 on a $224 stock). When someone "rolls" a position, they're not making a new bet; they're extending an old one. The lesson: a huge dollar figure in options flow ($139.9M here) can be almost entirely optical — the real capital commitment was under half a million dollars.
⚠️ Honest Limits — What We Actually Know vs. What We're Inferring
- Proven from the tape: the size, strike, price, and timestamp of both legs; that this printed as a negotiated floor block, not a lit sweep; that the February $125 call had zero prior open interest.
- Not provable from today's tape: whether the December $125 call sale opened a new short or closed an existing long. Size (6,949) sits below prior OI (7,074) — tomorrow's ≈06:30 ET OI snapshot is the definitive test, and we've stated our prediction above.
- Unknowable from any public source: who holds this position, their cost basis, or whether there's an offsetting stock or futures hedge attached to it. Deep-ITM calls near a dividend date are a classic setup for early-exercise and financing considerations that the public tape simply cannot see.
- Not a directional signal. Nothing about this trade should be read as bullish or bearish conviction on RTX. It is a time-horizon decision on an already-existing position, priced almost entirely off intrinsic value.
Options trading involves substantial risk and may not be suitable for all investors. This analysis is for informational purposes and is not a recommendation to buy or sell any security.
Last updated: 2026-08-12 (pre-market) — the next-day OPRA open-interest snapshot confirmed the roll on both legs. Feb-19-2027 $125C 0 → 6,952 (+6,952 against a 6,949-lot buy): OPEN (BTO). Dec-18 $125C 7,074 → 2,021 (−5,053 against a 6,949-lot sale): CLOSE (STC), 73% of the print — the provisional STC label is now confirmed. Refinement: the published prediction of a fall toward ≈125 was too aggressive; ≈1,896 contracts transferred rather than retired, leaving 2,021 December contracts outstanding. No thesis, title or tone changes were required; the order-type cell was confirmed and the ⏳ callout was replaced with the ✅ RESOLVED box.