🛡️ S — A Bearish Synthetic on SentinelOne, Expiring in 2028, On a Strike With Zero Prior Interest
✅ Updated 2026-08-07 pre-market — a textbook confirmation on both legs. The December-2028 $30 put went 0 → 4,500 — exactly the print size, from an empty strike — and the $35 call 64 → 4,517 (+4,453, 98.9%). The bearish synthetic is a proven new position. See the ✅ RESOLVED box below.
SentinelOne provides AI-driven endpoint and cloud security software. Sector: Technology / Software — Infrastructure. Market cap $7.02B, stock at $20.48, down 2.50% (StockAnalysis). The ticker is the single letter S on the NYSE. Follow it on the SentinelOne ticker page.
The Trade in Plain English
At 10:41:50, with the stock at $20.78, one package printed as a multi-leg floor trade — negotiated on the exchange floor, both legs together:
Buy 4,500 December-2028 $30 puts at $13.75, and sell 4,500 December-2028 $35 calls at $4.10.
| Time | Buy/Sell | C/P | Expiration | Strike | Size | Volume | OI (prior) | Option Price | Premium | Spot | Option Symbol |
|---|---|---|---|---|---|---|---|---|---|---|---|
| 10:41:50 | BUY | PUT | 2028-12-15 | $30 | 4,500 | 4,500 | 0 | $13.75 | $6,187,500 | $20.78 | S20281215P30 |
| 10:41:50 | SELL | CALL | 2028-12-15 | $35 | 4,500 | 4,501 | 64 | $4.10 | $1,845,000 | $20.78 | S20281215C35 |
Net: a $4,342,500 DEBIT. Package delta −411,390 shares.
Both legs are proven opens, and the put leg is as clean as it gets: prior open interest at the $30 strike was literally zero. That contract did not exist before today.
🤓 What This Actually Means — Plain English
Buying a put and selling a call at the same time is a synthetic short — the combination behaves much like being short the stock, without borrowing shares.
The two strikes are different here, which softens it slightly: the $30 put is deep in the money on a $20.48 stock, so it already carries about $9.50 of intrinsic value and moves closely with the shares. The $35 call is far out of the money, so selling it collects premium while giving away only a large upside.
Put together, the delta is −411,390 shares — a meaningful bearish position on a $7.02B company, running for more than two years.
Why buy a deep in-the-money put rather than short the stock? Defined maximum loss, no borrow cost, and no risk of being called away on the loan. The cost is the time value embedded in the option and the capital tied up.
Two readings we cannot separate: this may be a hedge protecting a large existing shareholding, or a standalone bearish bet. A multi-leg options package carries no stock leg on the tape, so nothing in the data tells us which. That is a real limit, and it changes the meaning completely.
✅ RESOLVED — A Textbook Confirmation on Both Legs
Updated 2026-08-07 pre-market. The ≈06:30 ET OPRA snapshot (which reflects the August 6 close) has published, and both provisional legs are settled.
| Leg | Baseline OI (Aug-6 snap) | Predicted | Actual (Aug-7 snap) | Δ | Print size | Δ as % of print | Day vol | Verdict |
|---|---|---|---|---|---|---|---|---|
| Dec-15-2028 $30 P (bought 4,500) | 0 | ≈4,500 | 4,500 | +4,500 | 4,500 | 100.0% | 4,500 | ✅ OPEN (BTO) |
| Dec-15-2028 $35 C (sold 4,500) | 64 | ≈4,560 | 4,517 | +4,453 | 4,500 | ≈98.9% | 4,501 | ✅ OPEN (STO) |
The put leg is as clean as the open-interest record gets: a strike that held zero contracts the day before now holds exactly 4,500 — every single contract of the print, and nothing else. The call leg confirmed at 98.9%.
The bearish synthetic is a proven new position, opened near the 52-week high, expiring in December 2028.
What is still unknowable. Whether an offsetting long stock position sits behind the synthetic — which would make it a collar-like hedge rather than an outright bearish view. The options tape cannot see it.
📊 The Charts
One-Year Price Action
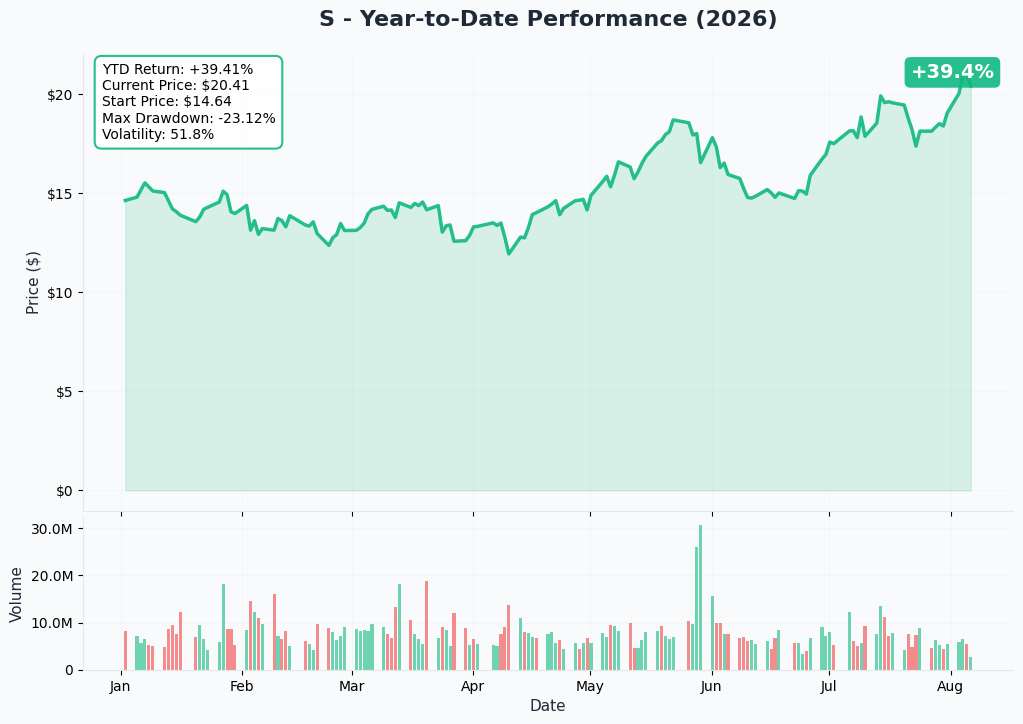
SentinelOne is up ≈39.4% over the past year and trades within about 4.5% of its 52-week high of $21.45, having roughly doubled off an $11.81 low (StockAnalysis).
That matters: this bearish position is being opened near the top of the stock's range, not after a decline.
Gamma Support and Resistance
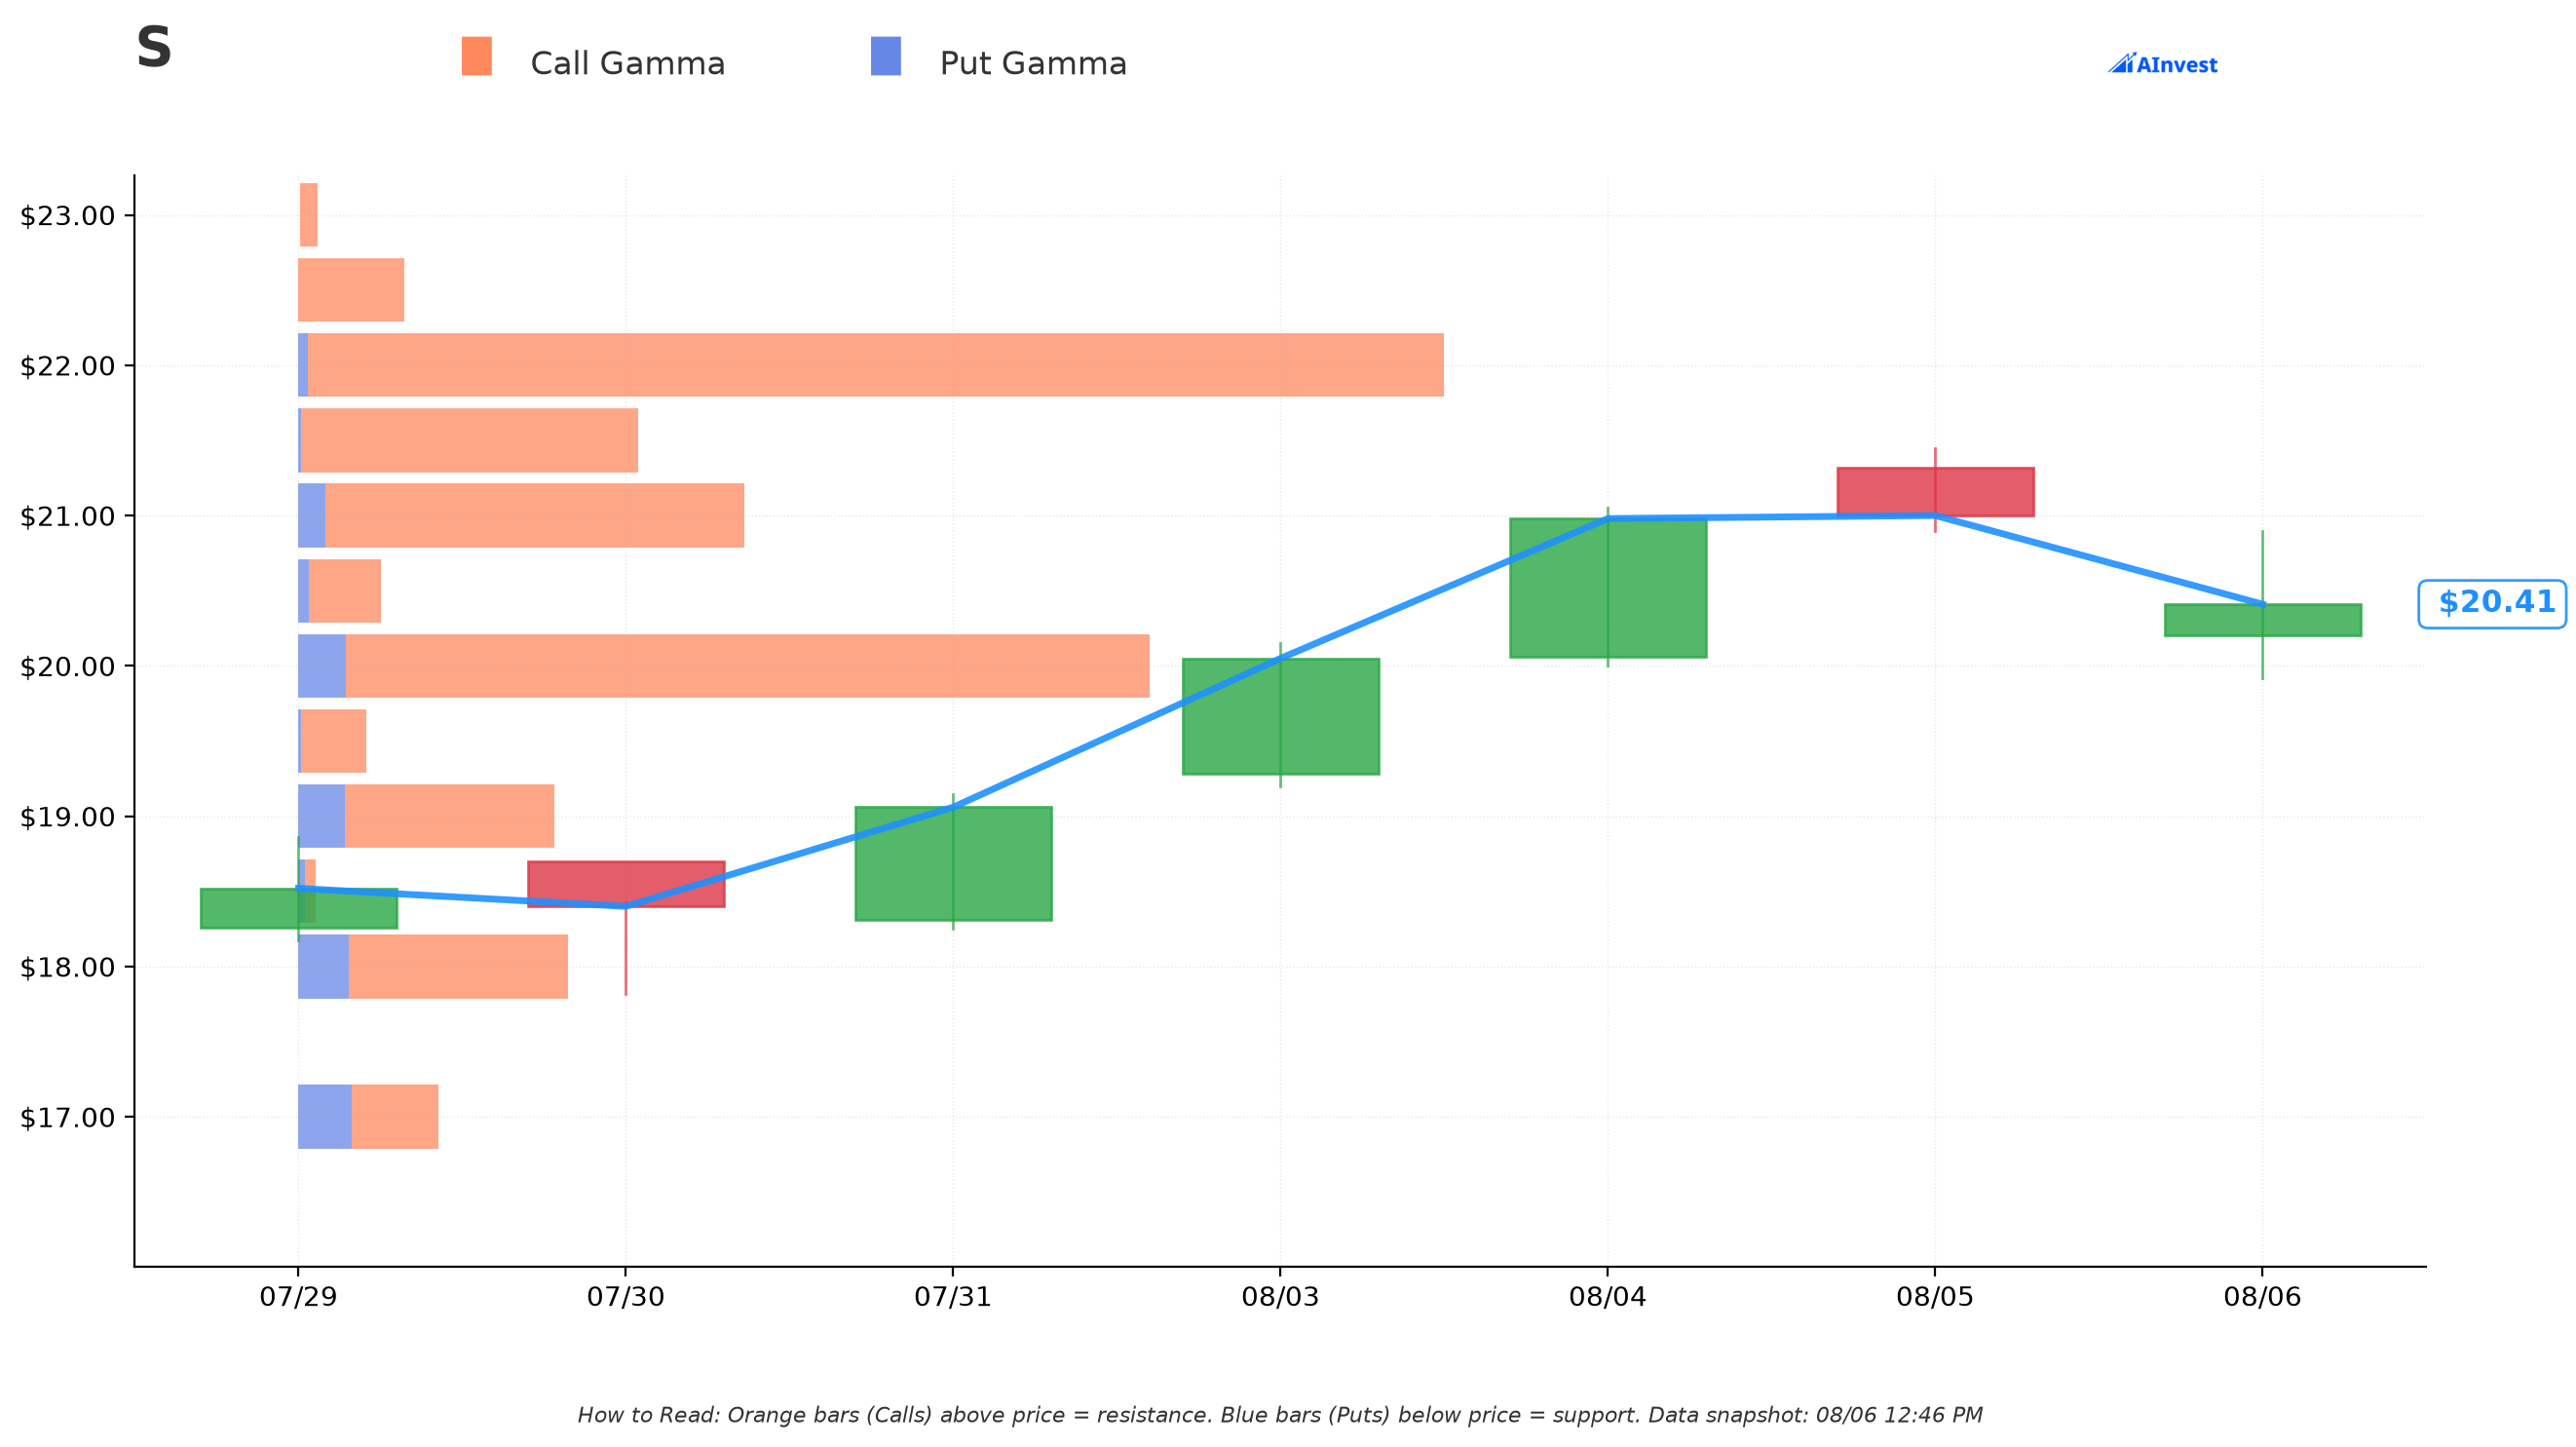
Dealer gamma is sparse in a name this size — the model identifies support at $20 and resistance at $22, both rated Strong, and little else. The stock is currently sitting right on that $20 support shelf. Below it there is no identified structure, which means less hedging friction if it breaks.
Implied Move
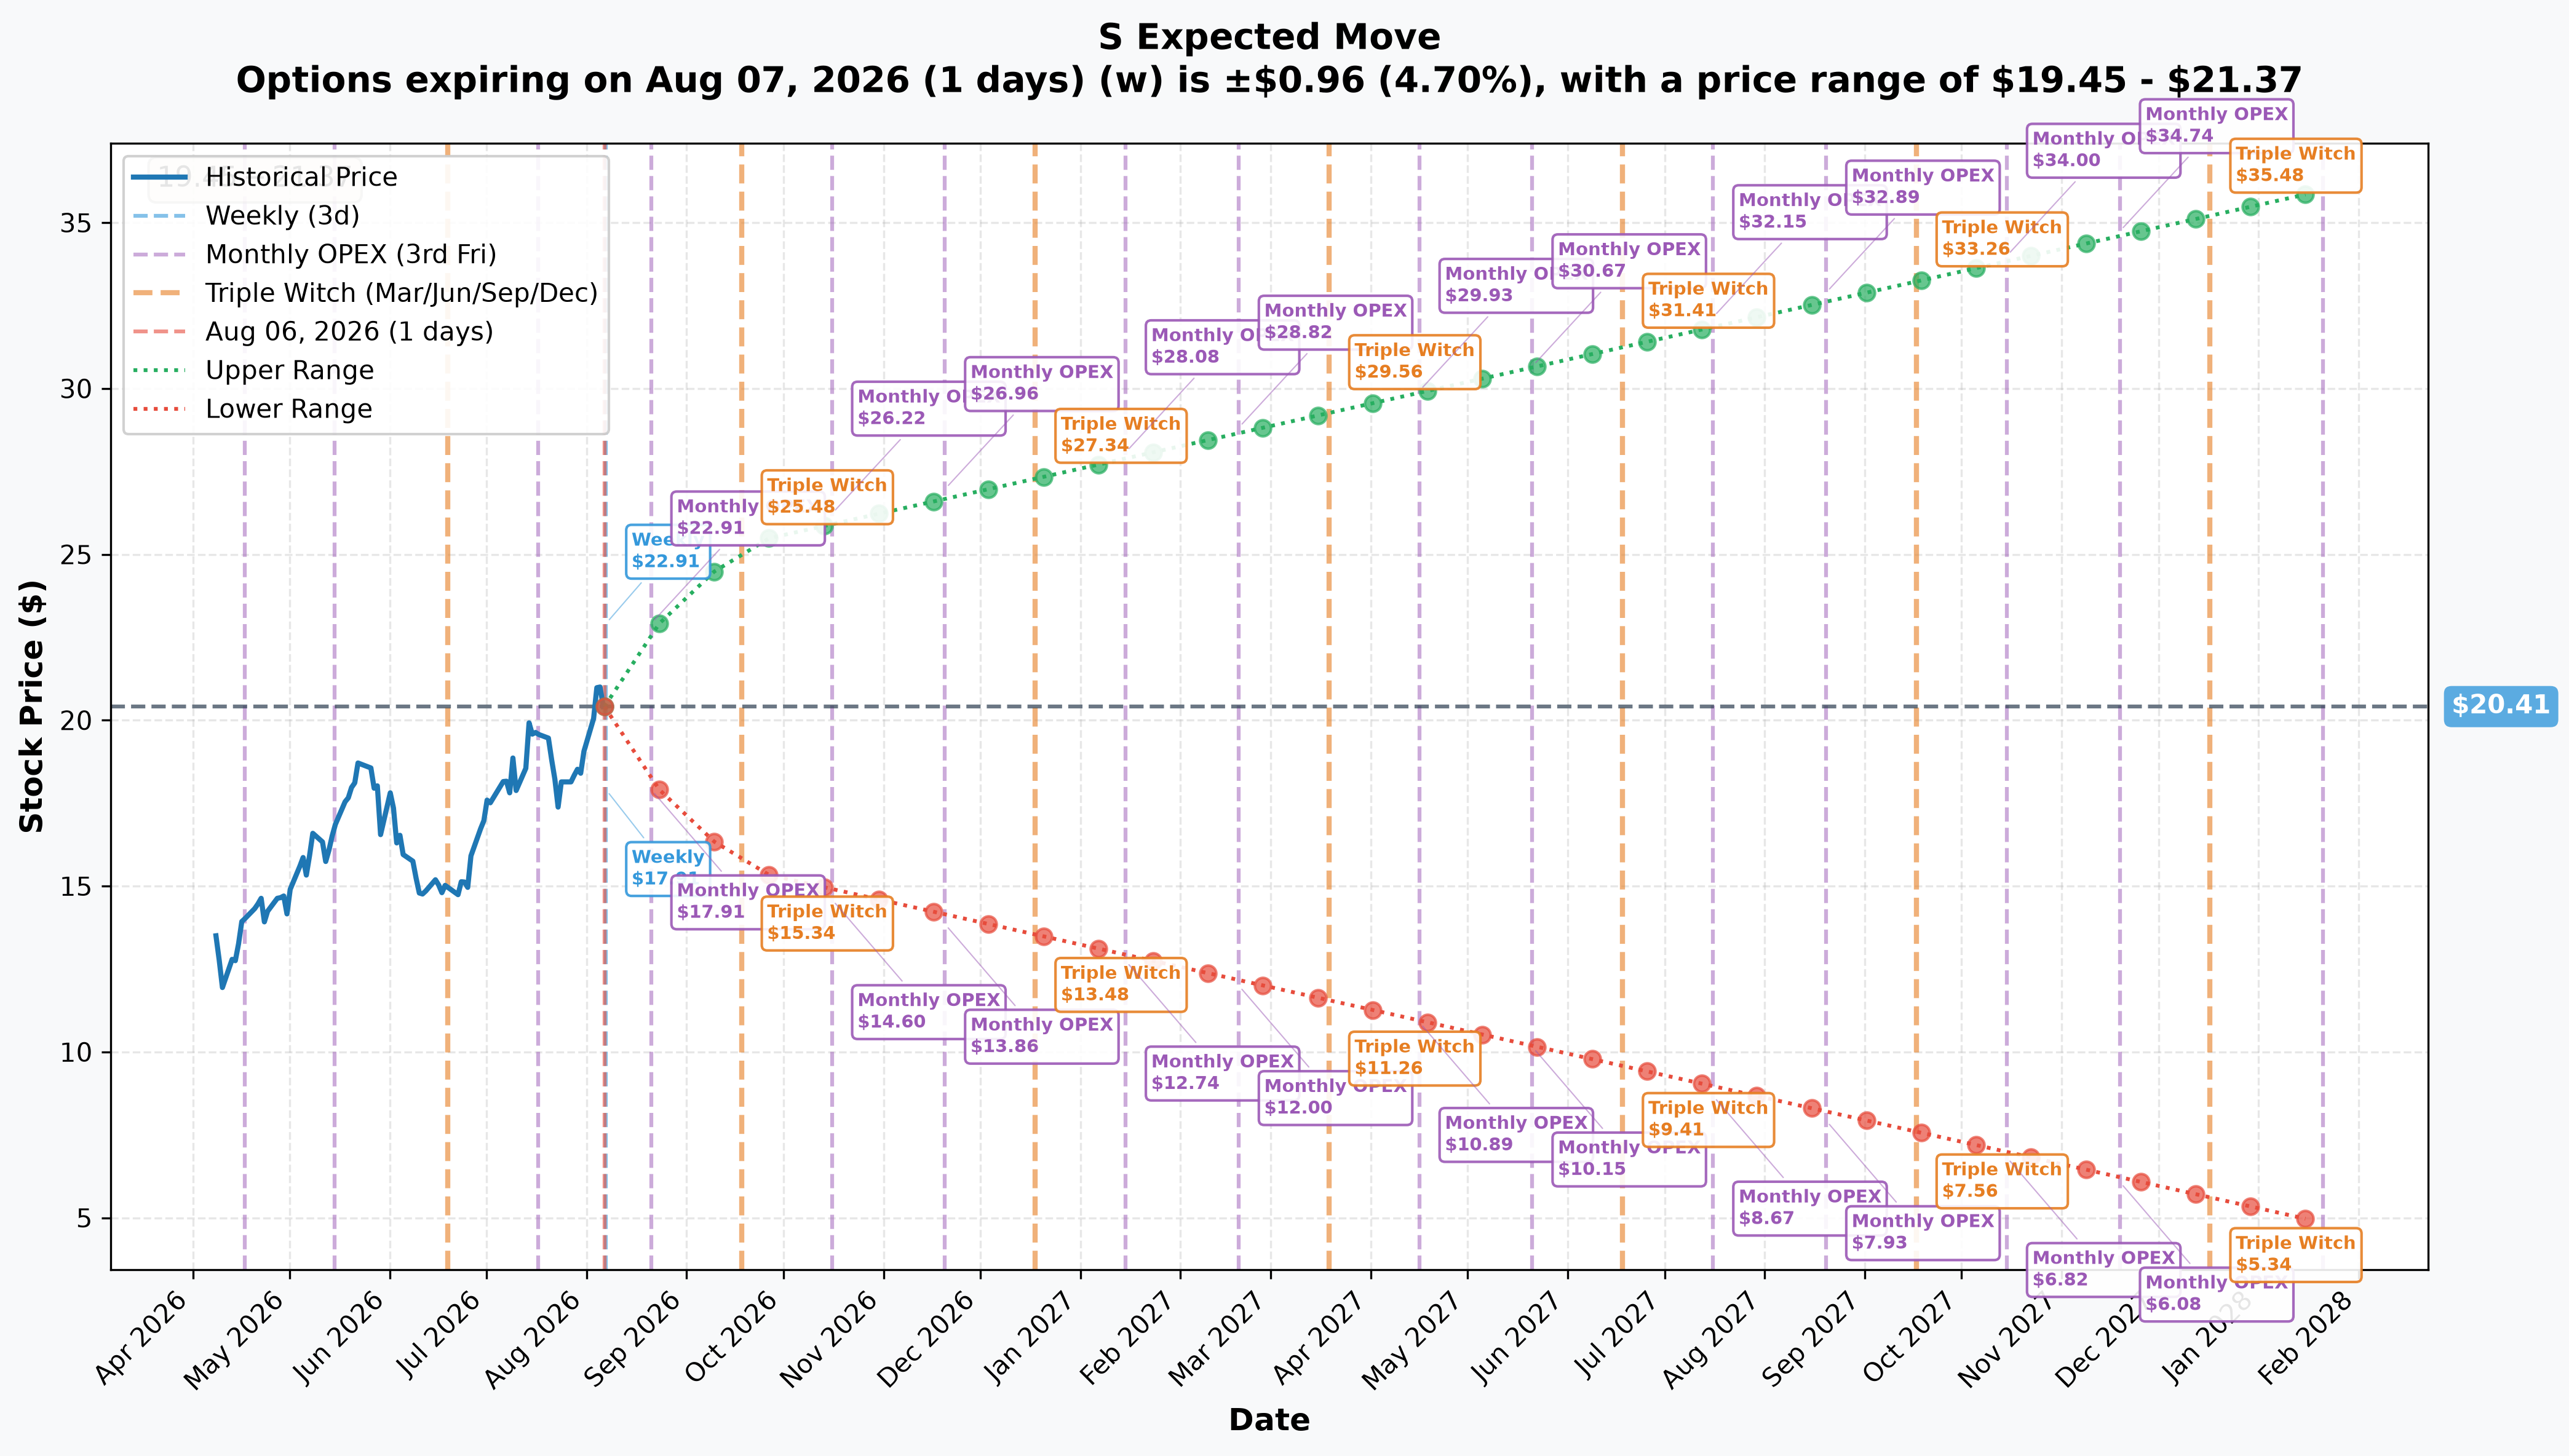
The chain prices ±4.7% by tomorrow ($19.45–$21.37), ±11.35% by August 21 ($18.09–$22.73), and ±23.99% by September 18 ($15.51–$25.31). Looking out to the January-2028 horizon, the range widens to ±76.28% ($4.84–$35.98).
That last band is the relevant one for a 2028 contract, and it is worth noting the $35 short call sits just inside its upper edge — the market considers $35 reachable over that horizon, if unlikely. The seller is not giving away something worthless.
📅 Catalysts
- Earnings: August 27, 2026 — confirmed (StockAnalysis). But keep the horizon in mind: a December-2028 position spans roughly ten subsequent reports, so no single print dominates it.
- Most recent quarter: Q1 FY2027, reported May 28, 2026 — "accelerated revenue and ARR growth, record net new ARR, and improved profitability" (StockAnalysis).
- ⭐ The most striking fact in the data: consensus is Buy, yet the average price target is $19.68 — below the $20.48 stock (StockAnalysis). Analysts rate it a buy while modelling it slightly lower. Whoever put on this bearish structure is siding with the target, not the rating.
- At $7.02B, this is a small-cap in a crowded endpoint-security market, which makes position sizing matter more than usual.
👥 Four Ways to Read This
🎲 The YOLO trader — a $13.75 deep in-the-money put is not a cheap directional punt. The interesting cheap side here is the $35 call somebody sold — but you would be selling, not buying, and that carries open-ended risk.
📈 The swing trader — the near-term markers are clean: $20 support, $22 resistance, with the stock sitting on the former. August 27 earnings is the first dated test.
💰 The premium collector — you are the counterparty on the call leg. Someone collected $4.10 for a strike 71% above spot on a two-year horizon, which the chain still treats as reachable. That is why it paid what it did.
🌱 The beginner — the transferable idea is the synthetic. A long put plus a short call behaves like a short stock position. Options are building blocks: combinations can replicate positions you might not otherwise be able to take, and recognising the shape matters more than the individual legs.
⚠️ Honest Risk and Limits — What the Tape Cannot Prove
- Hedge or outright bet is genuinely unknown. An options package shows no stock leg, so we cannot tell whether this protects a holding or expresses a view.
- We do not know the trader or their broader position.
- The short call has no capped loss. If SentinelOne runs well beyond $35 before December 2028, the loss on that leg keeps growing.
- A 2028 expiry is a long time to be wrong, and the position was opened near the 52-week high rather than after a run-up has broken.
Nothing here is investment advice.
Last updated: 2026-08-07 — next-day OPRA open interest resolved both provisional flags: both legs OPEN, $30 put 0 → 4,500 (a 100.0% match from an empty strike) and $35 call 64 → 4,517. A ✅ RESOLVED box replaced the ⏳ callout; the bearish-synthetic read is confirmed.