🎯 SKHY $46M Call Ratio Spread — A Bet That SK Hynix Rallies to $210, But Not Past $271
📅 August 3, 2026 | 🔥 Unusual Activity Detected
✅ UPDATE — August 4, 2026 pre-market: both legs confirmed OPEN — this is a brand-new ratio spread, not an adjustment. The $150 call rose 6,902 → 13,446 and the $210 call 24,672 → 37,485, both within ≈2% of our predicted full-open levels. See the ✅ RESOLVED box.
🎯 The Quick Take
Someone just put on a $46.2M gross / ≈$676K NET CREDIT call structure in SK hynix (SKHY): bought 6,761 Dec-18-2026 $150 calls and sold 13,522 of the $210 calls — an exact 1×2 ratio, crossed as one negotiated block at 14:13:29 with spot at $143.44. Because the desk sold twice as many calls as it bought, this looks almost free to put on, but it flips from "the best trade of the year" to "open-ended pain" if SK hynix rallies too hard. This is a bet the stock climbs toward $210 by December — but not much past ≈$271. 🤝 Tag it a BLOCK CROSS, not a sweep: a broker matched a known counterparty off the lit book.
📊 Company Overview
SK hynix Inc. (SKHY) is the US-listed American Depositary Share of one of the world's "Big Three" memory chipmakers, alongside Samsung and Micron, headquartered in Icheon, South Korea.
- Sector/Industry: Technology — Semiconductors & Semiconductor Equipment
- What they make: DRAM, NAND flash/SSDs, and — the current growth engine — High Bandwidth Memory (HBM) chips that feed Nvidia's AI accelerators, plus CMOS image sensors
- Major customers: Nvidia, Microsoft, Apple, Dell, HP, and other server/PC OEMs
- Market cap: reported figures diverge by source and FX — investing.com's ADR data shows ≈$798B, while broader coverage puts the parent company near $1 trillion+ after SK hynix overtook Samsung Electronics as Korea's most valuable listed company on June 22, 2026, ending Samsung's 25-year reign atop the KOSPI. Either way, this is one of Asia's largest companies.
- 52-week range: ≈$124.80 – $194.80
- ⚠️ Liquidity note — be precise about which market. The shares are not thin: the ADR trades ≈54.8 million ADS a day (≈$7.8B of notional), and four leveraged ETFs launched on it in July 2026. It is the options chain that is thin, and that is what matters here. Prior open interest was only 6,902 contracts on the $150 call and 24,672 on the $210 call, and the NBBO on both legs was wide (≈$2.00 wide on the $150C, ≈$1.70 on the $210C — roughly 6–10% of the option's own price). That's a real warning: this structure is not something a retail account can replicate cheaply, and the short leg in particular carries margin requirements most brokers won't extend to individual traders.
💰 The Option Flow Breakdown
📊 What Just Happened
🤝 BLOCK CROSS — negotiated multi-leg combo, 14:13:29, spot $143.44:
| Time | Buy/Sell | Type | Expiration | Strike | Size | Prior OI | Option Price | Premium | Option Symbol |
|---|---|---|---|---|---|---|---|---|---|
| 14:13:29 | BUY | CALL | 2026-12-18 | $150 | 6,761 | 6,902 | $33.70 | $22,784,570 | SKHY 150C |
| 14:13:29 | SELL | CALL | 2026-12-18 | $210 | 13,522 | 24,672 | $17.35 | $23,460,670 | SKHY 210C |
- Structure: a 1×2 CALL RATIO SPREAD — 6,761 long calls against exactly 13,522 short calls (2.000× — no rounding, this is a designed ratio, not a coincidence).
- Net premium: CREDIT $676,100 ($23,460,670 collected − $22,784,570 paid). Gross notional traded was ≈$46.2M, but the net cost to put this on was almost nothing.
- NBBO at print: $150C 32.40/34.40 (65% across); $210C 16.80/18.50 (32% across). Caveat: this printed as a MULTI_LEG_CROSS (a negotiated combo, not a lit sweep) — per-leg %-across is a weak aggressor signal on a cross like this; we're reporting the recorded Buy/Sell tags, not asserting the print "lifted the offer."
- Net package delta at the trade: ≈−105,201 shares (long leg +395,654 shares of delta, short leg −500,855). At inception the delta actually leans slightly negative — the position isn't a straightforward one-way bullish bet on tomorrow's tape. The real story is the payoff shape at expiration in December, not today's delta.
✅ RESOLVED — Next-Day OI Is In (August 4, 2026 pre-market)
The OPRA open-interest snapshot timestamped August 4, 2026 ≈06:30 ET reflects the close of business August 3 — the definitive open-vs-close test we flagged when this published. Here is what it says.
| Leg | Baseline OI (Aug-3 snap) | Resolving OI (Aug-4 snap) | Δ | Print size | Predicted (if opening) | Verdict |
|---|---|---|---|---|---|---|
| Dec-18-2026 $150 call (bought) | 6,902 | 13,446 | +6,544 | 6,761 | ≈13,663 | ✅ OPEN (BTO) — ≈97% |
| Dec-18-2026 $210 call (sold) | 24,672 | 37,485 | +12,813 | 13,522 | ≈38,194 | ✅ OPEN (STO) — ≈95% |
Verdict: the unproven case resolved cleanly — opening on both legs. When this published, neither leg could be called: both printed below their existing open interest, which left "brand-new position" and "adjustment of an existing ratio spread" equally consistent with the tape. The OI answer is decisive. Both strikes rose to within ≈2% of the levels we predicted for a full open (13,663 predicted vs. 13,446 actual; 38,194 predicted vs. 37,485 actual), and neither fell. BTO on the $150 call, STO on the two-for-one $210 calls — a genuinely fresh 1×2 call ratio spread.
Why this matters to a reader: an adjustment of an old position would tell you a desk was managing risk it already had. A fresh open tells you a desk chose, on August 3, to take on uncapped upside risk above ≈$271 in exchange for almost no net premium. The payoff table in this article is the live risk profile of a new position, not a leftover one.
🤓 What This Actually Means — Plain English
Let's translate the jargon. A 1×2 call ratio spread means: buy 1 call at a lower strike, sell 2 calls at a higher strike, same expiration. Here that's buy the $150 call, sell two $210 calls, for basically no net cost (they were actually paid a tiny $676,100 credit to do it).
Here's the order-type breakdown:
- BTO 6,761 × $150 call — paid $33.70/share to open a long call (if opening; ⏳ unproven).
- STO 13,522 × $210 call — collected $17.35/share to open (or add to) a short call position (if opening; ⏳ unproven).
Why does this make money as the stock rises — and then stop making money? Because the long call and the two short calls move in opposite directions once SKHY passes $210:
| SKHY Price at Dec-18-2026 expiry | What happens | Approx. total P&L (incl. $676K credit) |
|---|---|---|
| $143 (today's spot) | Both calls worthless | +$676,100 (just keep the credit) |
| $150 | Still both worthless (at the money) | +$676,100 |
| $180 | $150C worth $30, $210C worth $0 | +$20,959,100 |
| $210 | $150C worth $60, $210C worth $0 — MAX PROFIT | +$41,242,100 |
| $240 | $150C worth $90, but now BOTH $210 shorts are $30 ITM — the extra short bites | +$20,959,100 |
| ≈$271 | Long call gain is fully offset by the extra short call — upside breakeven | ≈$0 (roughly flat) |
| $300 | Extra short call now costs more than the long call gains | ≈−$19,606,900 |
The shape is a tent, not a ramp. Profit builds steadily as SKHY climbs from here toward $210 — the maximum-profit point (≈$41.2M) — because they own one call for every two calls they're short, and below $210 the short calls are worthless so only the long call matters.
But above $210, the second short call — the one with no matching long call underneath it — starts eating into gains. Every dollar SKHY rises past $210 costs the position $1 more than the long call earns, because they're short twice as many contracts as they're long. That erosion continues until roughly $271, where the gain from the long call is completely wiped out by losses on the naked extra short call. Above $271, this position loses money with no ceiling — for every $1 SKHY trades above $271, the position loses an additional ≈$676,100 (100 shares × 6,761 net-short contracts).
So the honest description is: a bet that SK hynix rallies substantially — but not too much. It is emphatically not a simple bullish call buy. The "free" credit is not free risk — it hides a genuinely unlimited-loss tail if the stock squeezes hard (SKHY has moved 15%+ in a week before, per the implied-move data below, so a run past $271 by December is not far-fetched). A retail trader looking at "somebody bought calls for a credit" without seeing the second leg would badly misread this trade.
📈 Technical Setup / Chart Check-Up
YTD Performance
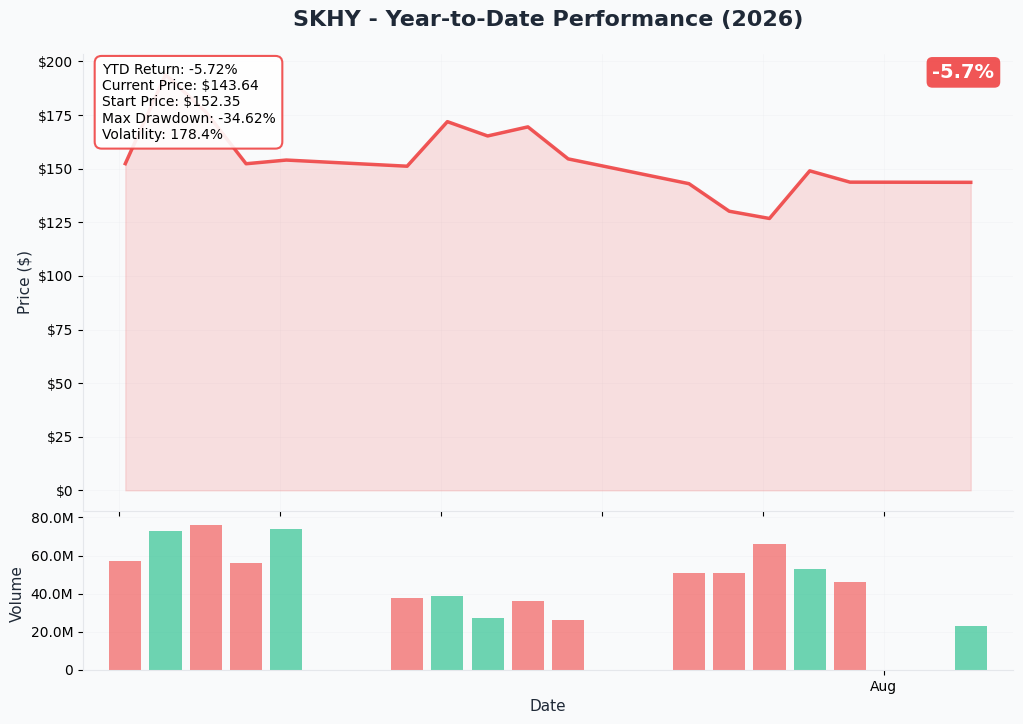
SKHY is down ≈5.7% year-to-date and has traded in a wide $124.80–$194.80 52-week band — a volatile ride reflecting both the AI-memory boom and this week's sharp Korea tech selloff (KOSPI fell 4–5% in the days before this trade, its worst month since 2008, per investing.com's SK hynix news feed).
Gamma-Based Support & Resistance
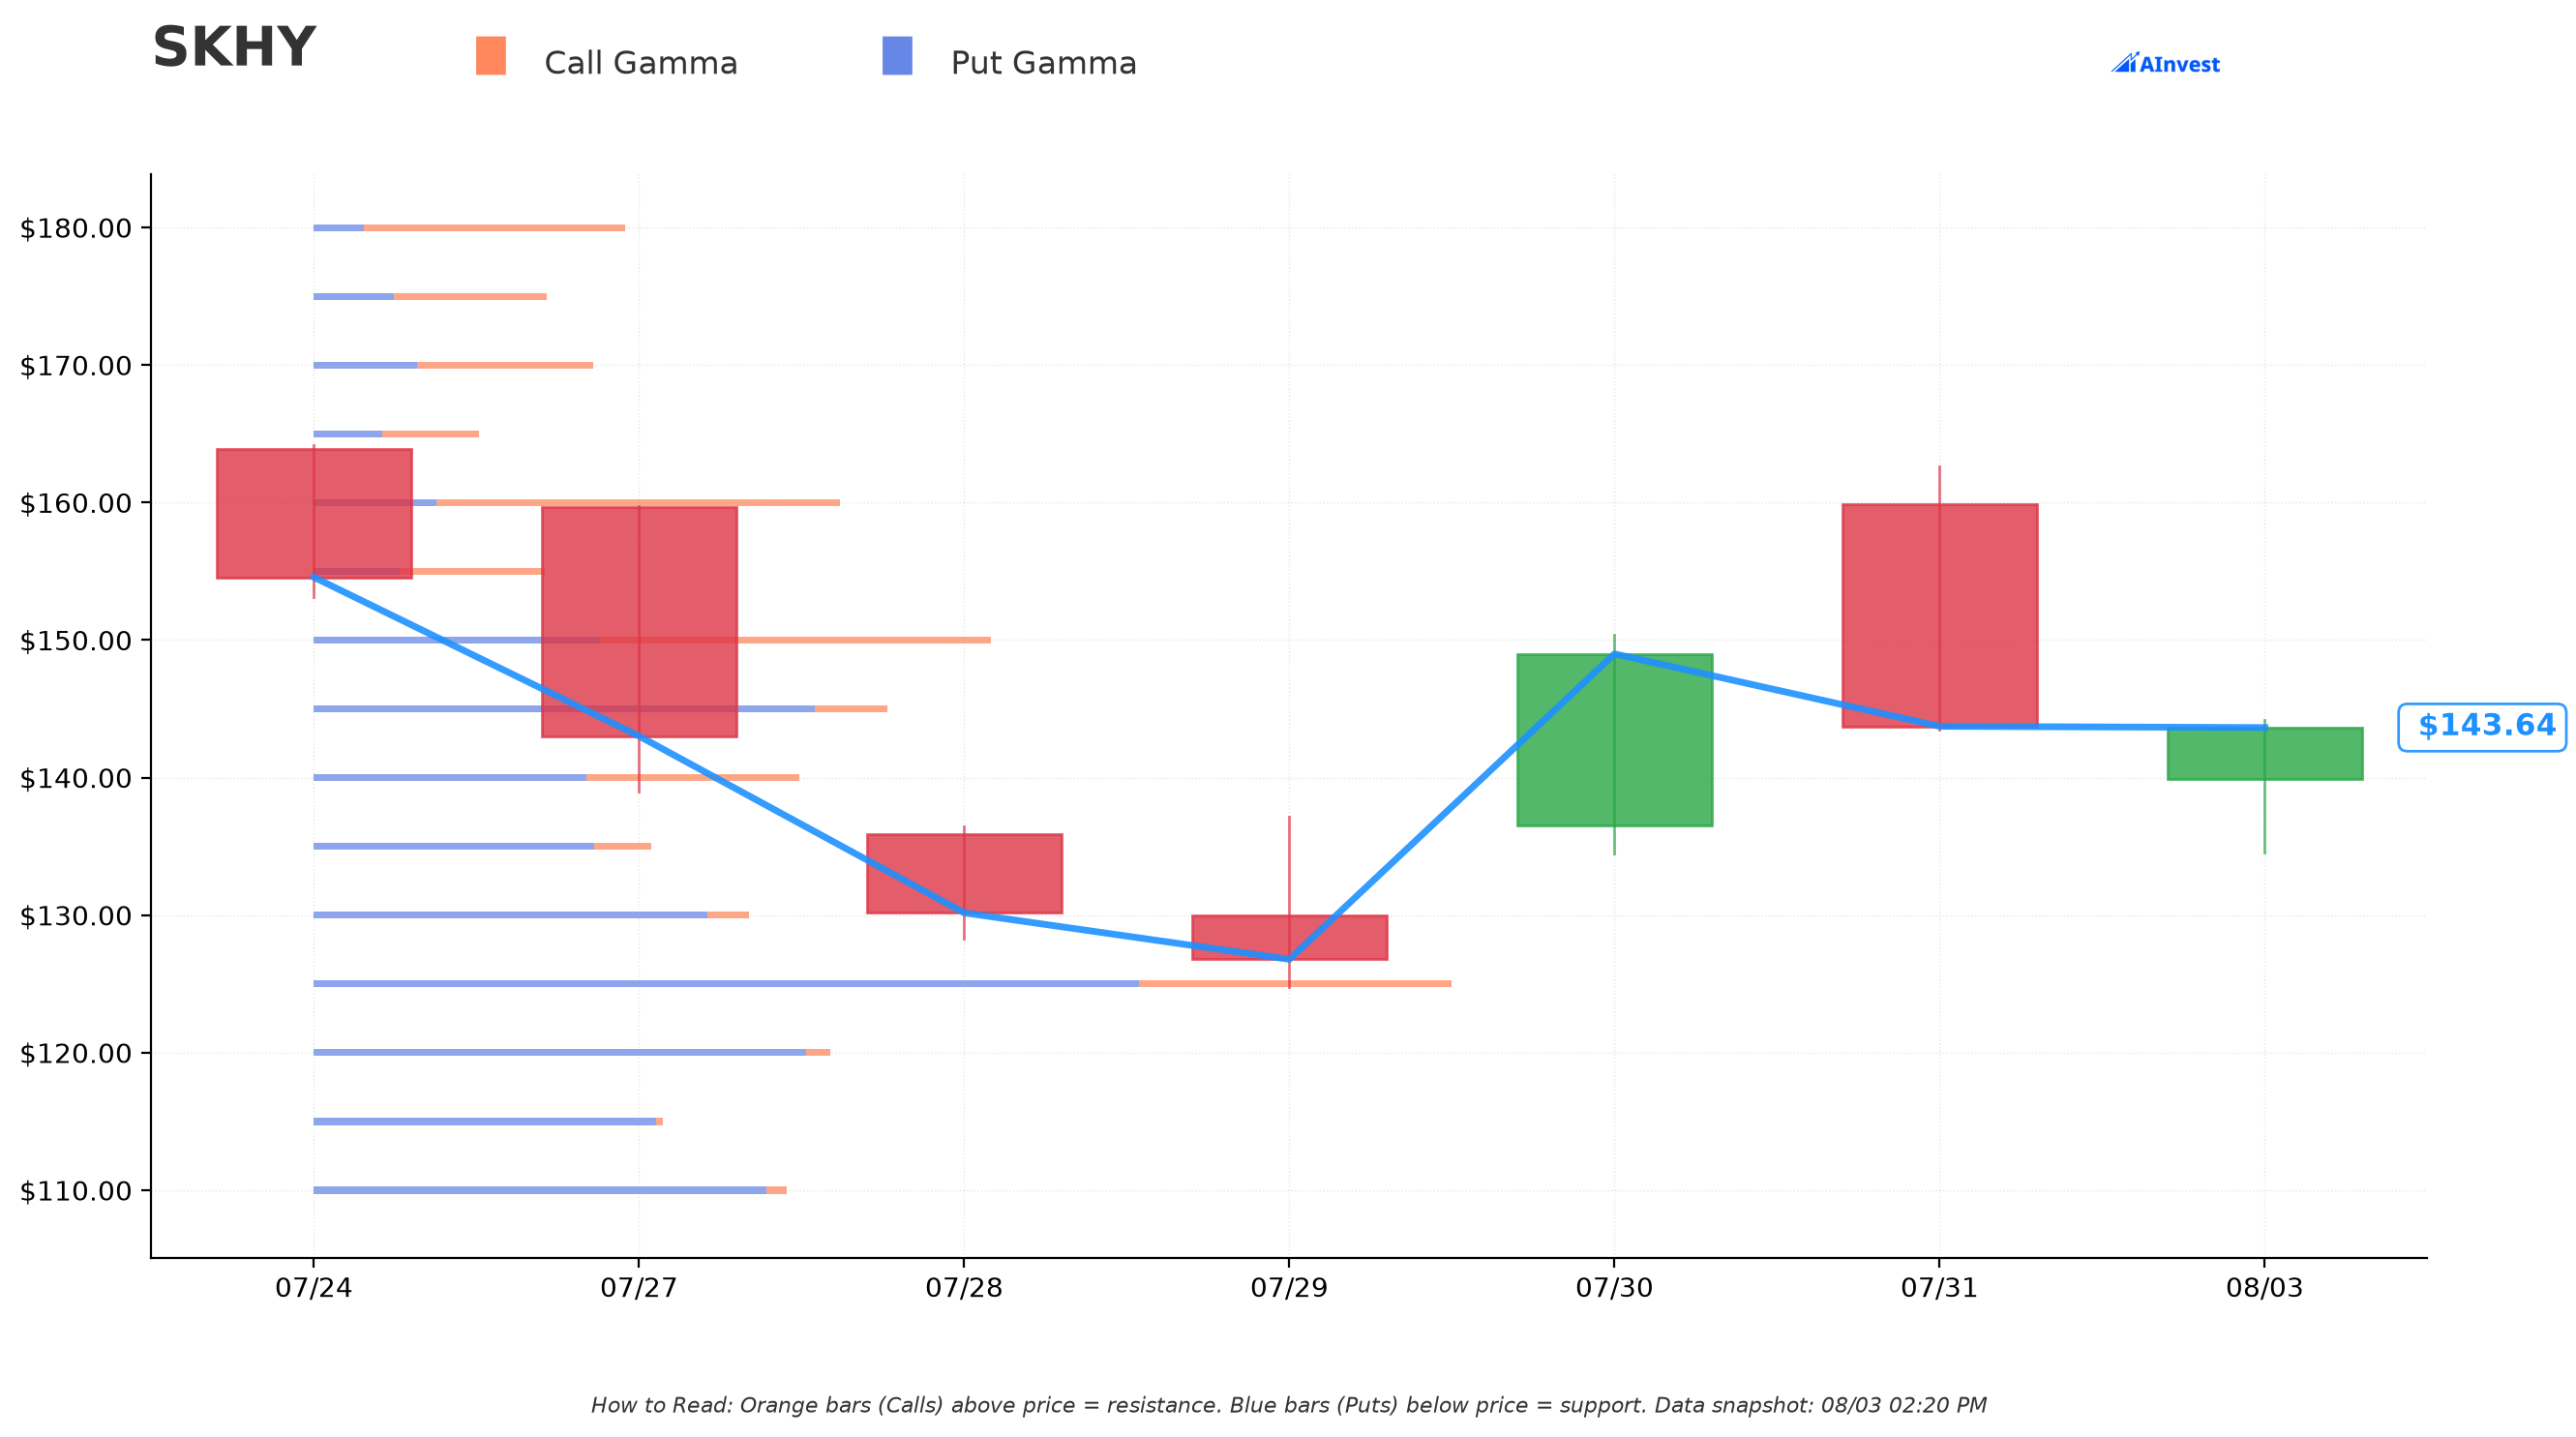
Current price: $143.44
- 🔵 Support wall at $125 (≈12.9% below spot) — the single largest gamma cluster on the board, dominated by put open interest (5.15 total gamma, mostly puts).
- 🔵 Secondary put-heavy clusters at $120, $130, $140, $145 — dealers are positioned defensively just below and around spot.
- 🟠 Resistance at $150 (≈4.6% above spot, "Moderate" strength, 3.06 total gamma) — this sits almost exactly at the ratio spread's long strike. Getting through $150 cleanly is the first test for this trade to become profitable beyond just keeping the credit.
- 🟠 Further out, $200 carries the single largest call-gamma concentration on the chain (4.69 total, net +4.66 — almost entirely calls), and $210 — the ratio spread's short strike — already shows meaningful net call gamma (+1.64). That means dealers are already leaning into calls at exactly the level where this trade's max profit sits, which can act as a magnet/pin zone as December approaches.
What this means for traders: the path of least resistance from here runs through $150 resistance toward the $200–$210 zone where both gamma and this trade's payoff peak coincide. A push much beyond that starts fighting against the same math that turns this specific trade unprofitable.
Implied Move Analysis
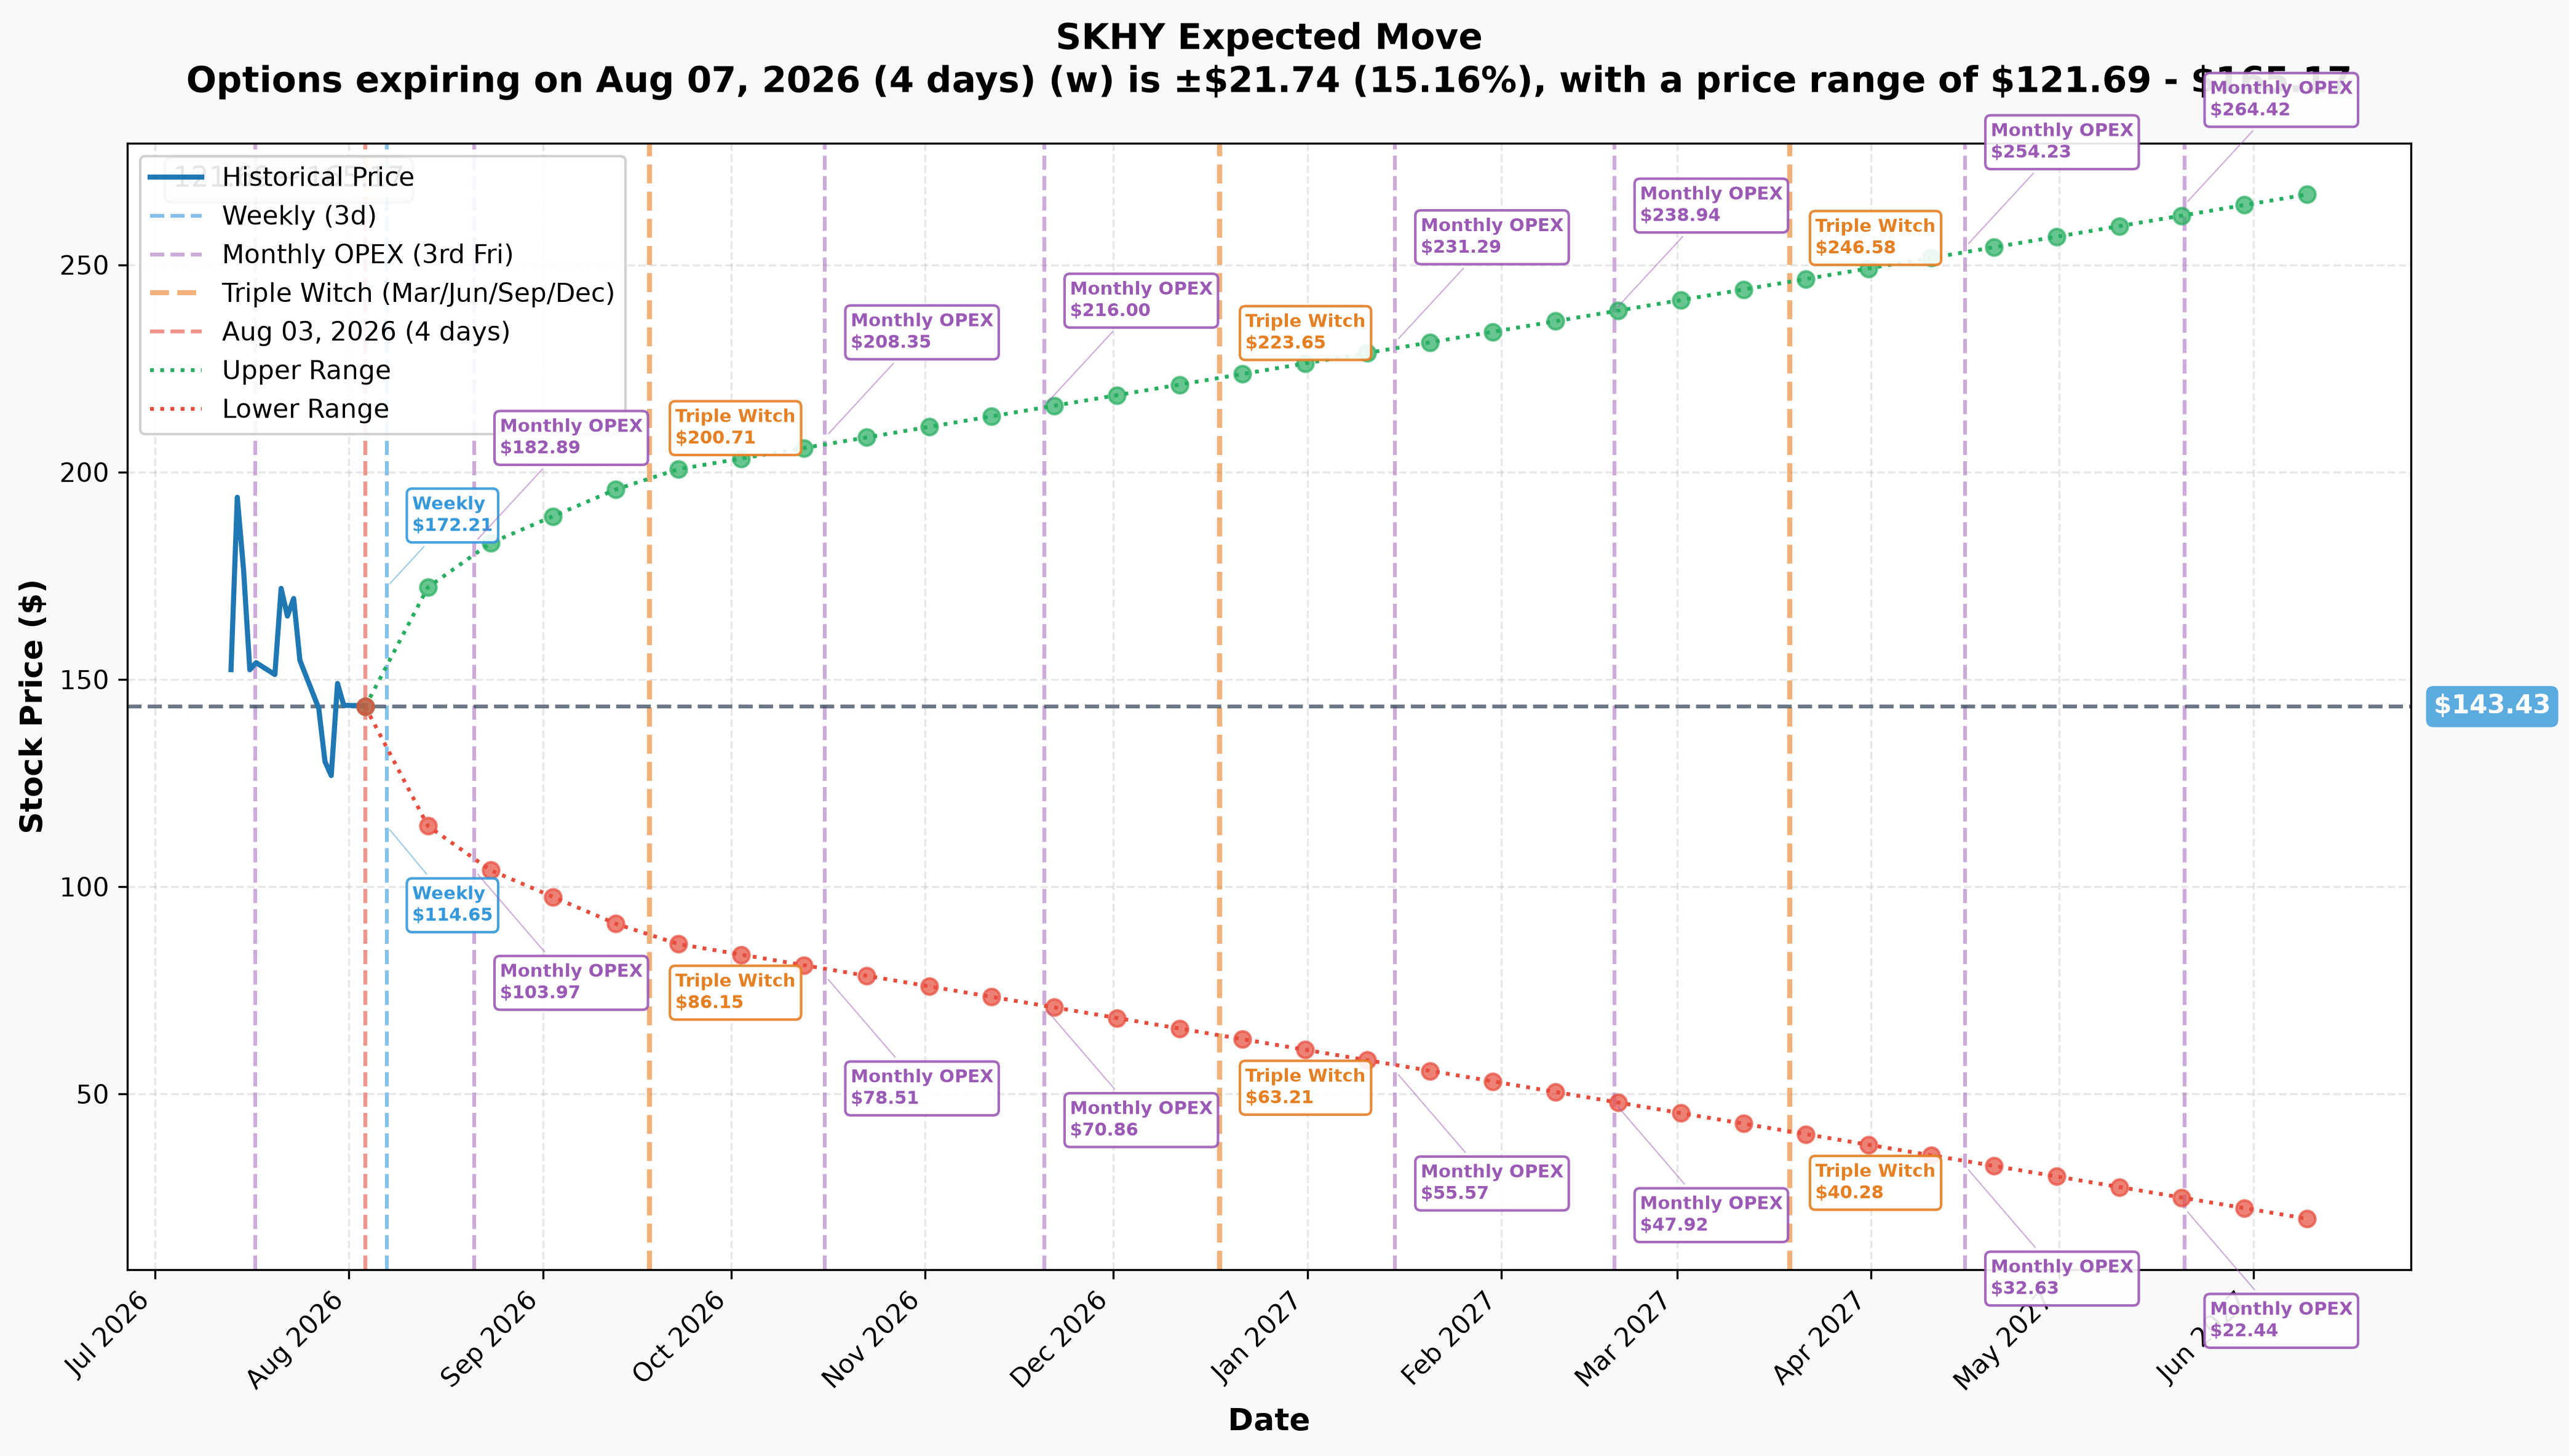
| Expiration | Days Out | Implied Move | Range |
|---|---|---|---|
| Weekly (2026-08-07) | 4 | ±15.2% (±$21.74) | $121.69 – $165.17 |
| Monthly OPEX (2026-08-21) | 18 | ±26.6% (±$38.17) | $105.26 – $181.60 |
| Quarterly Triple Witch (2026-09-18) | 46 | ±39.2% (±$56.26) | $87.17 – $199.69 |
| Yearly LEAPS (2027-06-17) | 318 | ±87.6% (±$125.58) | $17.85 – $269.01 |
The Dec-18-2026 expiration used by this trade (≈137 days out) sits between the quarterly and LEAPS data points above. Interpolating (not a direct engine output — treat as an estimate) puts the implied move somewhere around ±55–65%, or roughly a $60–$230-ish plausible range by December. That is a wide enough band that both the $210 short strike and the ≈$271 breakeven are well within one implied-move standard deviation — this is not a low-probability tail bet on either side. SKHY's own options market is already pricing exactly the kind of large move this trade needs (and needs to stop short of).
📌 One dated catalyst worth flagging up front: the ADR is less than a month old, and its IPO quiet period expires on 2026-08-19. Coverage today is only ≈4–6 analysts, so a syndicate initiation wave can reset consensus quickly — and it lands well inside the December expiry. Current targets already span $152 to $355 with no Sell ratings, which is the kind of dispersion that resolves violently in either direction.
🎪 Catalysts
✅ Already Happened (Past 2 Weeks)
Record Q2 2026 earnings, then an 8.98% post-earnings drop — SK hynix reported record Q2 2026 revenue of KRW 79.3 trillion with a 76% operating margin, driven by AI demand and tight supply: DRAM prices rose ≈30% and NAND surged in the mid-50% range. Despite the beat, shares fell ≈9% as investors weighed "pricing durability and elevated valuations" — a reminder that even blowout memory-chip earnings can trigger sell-the-news action once expectations run this hot.
A brutal Korea tech selloff. KOSPI fell 4–5% and posted its worst month since 2008 in the days leading into this trade, with retail investors dumping record amounts of Korean shares after July's volatility. SKHY's ≈−5.7% YTD partly reflects that broader wobble, not company-specific bad news.
Analyst repositioning. Morgan Stanley upgraded Korea equities to overweight calling the recent action a "leverage washout," and UBS initiated coverage on SK hynix on August 2, 2026 as part of a broader round of AI-semiconductor analyst moves, expecting the AI rally to resume after this near-term pullback. Five analysts tracked by investing.com currently rate SKHY a buy with an average price target near $245 — notably close to, but still short of, this trade's $210 max-profit strike.
🔮 Ahead of the Dec-18-2026 Expiry
HBM4 ramp, H2 2026. SK hynix has begun mass production of HBM4 chips with a broader ramp planned for the second half of 2026 — squarely inside this trade's window. HBM4 is the next-generation memory tier feeding Nvidia's upcoming AI accelerator platforms; a smooth, well-priced ramp is the single biggest lever for SK hynix stock between now and December.
DRAM/NAND pricing durability. The Q2 spike in DRAM (+30%) and NAND (+50%) pricing was the core of the earnings beat — whether that pricing holds, cools, or extends through year-end will likely dictate whether SKHY grinds toward the $150–$210 zone this trade needs, or stalls out below it.
Samsung and Micron competitive dynamics. SK hynix, Samsung, and Micron are the industry's "Big Three" — HBM market-share shifts between them (Samsung has been racing to catch up in HBM certification with Nvidia) are a swing factor for SK hynix's premium pricing power through the Dec-18 expiry.
China's domestic memory buildout. Chinese memory makers (most notably CXMT) have been expanding DRAM/NAND capacity, a longer-horizon supply risk that could eventually pressure pricing — a background risk more relevant to 2027+ than to this December contract, but worth flagging as a tail risk that could compress the entire memory-pricing thesis this trade depends on.
Next quarterly earnings. SK hynix's Q3 2026 results would typically land in late October, before the Dec-18 expiry — expect this trade's short leg to face binary event risk around that print (unconfirmed exact date; flag as an estimate based on historical reporting cadence, not a sourced date).
👥 Four-Reader Interpretation
🎰 YOLO Trader: This trade's shape is tempting to mimic on the long side alone — buy the $150 call outright and skip the short leg, since you can't safely be naked 2x short calls on margin anyway. That gives you unlimited upside instead of a capped tent, at the cost of actually paying full premium (≈$33.70/share) instead of a credit. If you want the exact package, you'd need a broker that allows uncovered calls and a lot of margin — most retail accounts can't do this trade as-is.
📈 Swing Trader: Watch the $150 gamma resistance as your first tell. A clean break above $150 on decent volume, with DRAM/NAND pricing news still supportive, argues for the stock working toward the $180–$210 zone where this desk's trade (and the market's own call gamma) both cluster. Consider a simple $150/$180 or $150/$200 bull call spread instead of a ratio — defined risk, same directional thesis, no unlimited tail.
💰 Premium Collector: The short $210 call by itself, if you already own SKHY shares, is a textbook covered call — collect $17.35/share against stock you hold, with upside capped at $210 (≈46% above spot). Selling it naked as part of a 2:1 ratio the way this desk did is a different animal entirely and not something to copy without deep pockets and a hedging plan for the tail.
🌱 Beginner: This is an advanced, multi-leg institutional structure with a genuinely unlimited-loss component above ≈$271 — not a starter trade. If you're new to options, the lesson here is simply this: "free" or "credit" trades are not risk-free trades. Before trying anything like this, understand covered calls and simple vertical spreads first, where the maximum loss is known and capped from day one.
⚠️ Honest Risk Factors & Limits
- Unlimited upside risk above ≈$271. This is the single most important fact about this trade. Past that point, every additional $1 SKHY rallies costs the position roughly $676,100 more, with no cap. A short squeeze, a blowout HBM4 update, or a surprise AI-demand headline could get SKHY there faster than the implied-move data suggests is "typical."
- Open vs. close is genuinely unprovable today. Both legs printed below prior OI. We do not know if this is a fresh position or an adjustment to a pre-existing ratio spread. Come back for next-day OI before drawing firm conclusions about intent.
- Thin US options liquidity for a trillion-dollar-class company. Wide NBBO spreads on both legs (6–10% of option price) mean actual fills for anyone trying to replicate or unwind a position like this would likely be worse than the screen shows.
- What the tape cannot prove: the counterparty's identity, whether this desk holds an offsetting SKHY equity or ADR-hedge position we can't see, whether this is a genuinely new bet or a rolled/adjusted existing one, and the ultimate motive (a directional bet vs. a partial unwind of a bigger existing structure).
- A cross means a known counterparty already agreed to the other side of this trade — it is negotiated position management, not urgent, aggressive buying or selling into the lit market. Don't read directional urgency into the print itself.
- Do not replicate the short leg without understanding uncovered-call margin. The 13,522-contract short call leg is not something most retail brokers will approve without either an offsetting long position of equal or greater size, or advanced options approval and substantial margin.
Disclaimer: Options trading involves substantial risk of loss and is not suitable for all investors. This analysis is for educational purposes only and is not financial advice. The open/close status of this trade is unproven as of today's tape — check back for the next-day OPRA open-interest update before drawing firm conclusions. Ratio spreads carry undefined/unlimited risk on the naked side and are generally unsuitable for retail accounts without a clear hedging plan. Always do your own research and consider consulting a licensed financial advisor before trading.
Last updated: August 4, 2026 — next-day OPRA open-interest resolution added (✅ RESOLVED box above). Original analysis published August 3, 2026.